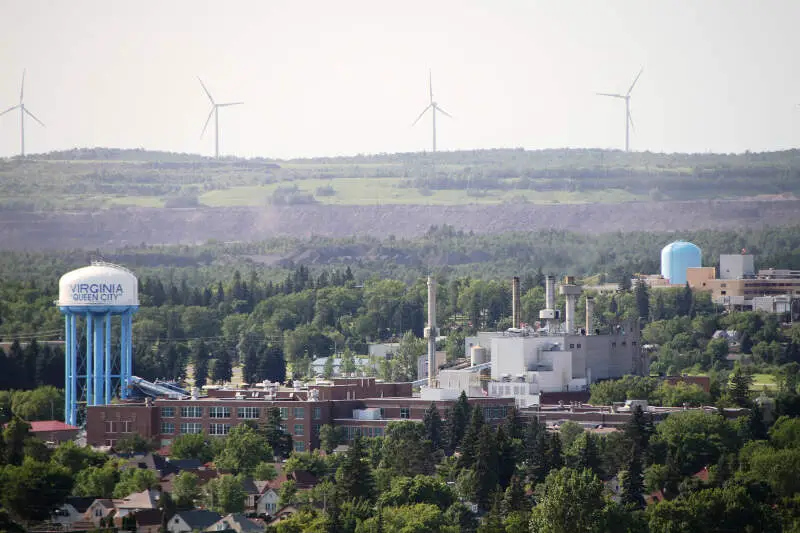
Virginia, MN
Demographics And Statistics
Living In Virginia, Minnesota Summary
Life in Virginia research summary. HomeSnacks has been using Saturday Night Science to research the quality of life in Virginia over the past nine years using Census, FBI, Zillow, and other primary data sources. Based on the most recently available data, we found the following about life in Virginia:
The population in Virginia is 8,362.
The median home value in Virginia is $132,404.
The median income in Virginia is $48,321.
The cost of living in Virginia is 88 which is 0.9x lower than the national average.
The median rent in Virginia is $789.
The unemployment rate in Virginia is 5.6%.
The poverty rate in Virginia is 23.2%.
The average high in Virginia is 49.5° and the average low is 27.5°.
Virginia SnackAbility
Overall SnackAbility
Virginia, MN Crime Report
Crime in Virginia summary. We use data from the FBI to determine the crime rates in Virginia. Key points include:
There were 203 total crimes in Virginia in the last reporting year.
The overall crime rate per 100,000 people in Virginia is 2,447.6 / 100k people.
The violent crime rate per 100,000 people in Virginia is 373.8 / 100k people.
The property crime rate per 100,000 people in Virginia is 2,073.8 / 100k people.
Overall, crime in Virginia is 15.49% above the national average.
Total Crimes
Above National Average
Crime In Virginia Comparison Table
| Statistic | Count Raw |
Virginia / 100k People |
Minnesota / 100k People |
National / 100k People |
|---|---|---|---|---|
| Total Crimes Per 100K | 203 | 2,447.6 | 1,862.9 | 2,119.2 |
| Violent Crime | 31 | 373.8 | 256.6 | 359.0 |
| Murder | 0 | 0.0 | 2.9 | 5.0 |
| Robbery | 2 | 24.1 | 48.9 | 61.0 |
| Aggravated Assault | 25 | 301.4 | 168.0 | 256.0 |
| Property Crime | 172 | 2,073.8 | 1,606.3 | 1,760.0 |
| Burglary | 19 | 229.1 | 184.7 | 229.0 |
| Larceny | 143 | 1,724.1 | 1,208.5 | 1,272.0 |
| Car Theft | 10 | 120.6 | 213.1 | 259.0 |
Virginia, MN Cost Of Living
Cost of living in Virginia summary. We use data on the cost of living to determine how expensive it is to live in Virginia. Real estate prices drive most of the variance in cost of living around Minnesota. Key points include:
The cost of living in Virginia is 88 with 100 being average.
The cost of living in Virginia is 0.9x lower than the national average.
The median home value in Virginia is $132,404.
The median income in Virginia is $48,321.
Virginia's Overall Cost Of Living
Lower Than The National Average
Cost Of Living In Virginia Comparison Table
| Living Expense | Virginia | Minnesota | National Average | |
|---|---|---|---|---|
| Overall | 88 | 97 | 100 | |
| Services | 108 | 101 | 100 | |
| Groceries | 97 | 99 | 100 | |
| Health | 126 | 110 | 100 | |
| Housing | 55 | 100 | 100 | |
| Transportation | 99 | 95 | 100 | |
| Utilities | 94 | 94 | 100 | |
Virginia, MN Weather
The average high in Virginia is 49.5° and the average low is 27.5°.
There are 60.4 days of precipitation each year.
Expect an average of 27.3 inches of precipitation each year with 60.0 inches of snow.
| Stat | Virginia |
|---|---|
| Average Annual High | 49.5 |
| Average Annual Low | 27.5 |
| Annual Precipitation Days | 60.4 |
| Average Annual Precipitation | 27.3 |
| Average Annual Snowfall | 60.0 |
Average High
Days of Rain
Virginia, MN Photos

1 Reviews & Comments About Virginia
/5

HomeSnacks User - 2019-05-10 09:32:56.382745
Virginia suffers the same way much of rural America does. The iron mines used to be the biggest employeer, but a combination of higher competition and more efficient production methods have killed many of the jobs. Combine the unemployment and high levels of drug use and a breeding ground for property crime has emerged. By and large, the locals are friendly, but rather aloof. Any newcomers may feel a bit lonely and will likely have to make an effort to establish meaningful relationships. Houses are remarkably low priced, so if you do manage to find a good paying job, you will be able to find a house at a fraction of the cost you would pay almost anywhere else.
The Good- In the summer the two lakes in the town are lovely. Lots of ducks, geese, and even some loons and swans. The mine pits have some wonderful overlooks on them as well. The town also has some interesting sculptures, artwork, and a nice park.
The Bad- Drug use is quite high for a town of it's size. Good paying jobs are very hard to find. The number of car thefts and break-ins are ridiculous for such a small town. The local hospital, while trying their best, has an awful reputation for care.
The Ugly- Some of the streets are in terrible condition and the downtown and local mall are filled with empty storefronts. The city infrastructure is in very rough shape. One hundred year old steam pipes have breaks and cracks all over.
The Really Ugly- Winters are a b***h. If you cannot tolerate snow and cold, you will not last more than a year or two. Snow can last until May, and January temps can get down to -30.
Rankings for Virginia in Minnesota


Locations Around Virginia
Map Of Virginia, MN
Best Places Around Virginia
Hibbing, MN
Population 16,100
Virginia Demographics And Statistics
Population over time in Virginia
The current population in Virginia is 8,362. The population has decreased -4.6% from 2010.
| Year | Population | % Change |
|---|---|---|
| 2023 | 8,362 | -0.6% |
| 2022 | 8,415 | -0.3% |
| 2021 | 8,444 | 0.3% |
| 2020 | 8,421 | -0.7% |
| 2019 | 8,484 | -0.6% |
| 2018 | 8,531 | -0.5% |
| 2017 | 8,570 | -0.3% |
| 2016 | 8,594 | -0.7% |
| 2015 | 8,658 | -0.1% |
| 2014 | 8,671 | -0.1% |
| 2013 | 8,680 | -0.4% |
| 2012 | 8,718 | -0.3% |
| 2011 | 8,742 | -0.3% |
| 2010 | 8,766 | - |
Race / Ethnicity in Virginia
Virginia is:
88.9% White with 7,434 White residents.
1.1% African American with 88 African American residents.
3.5% American Indian with 289 American Indian residents.
1.1% Asian with 91 Asian residents.
0.0% Hawaiian with 0 Hawaiian residents.
0.1% Other with 8 Other residents.
4.3% Two Or More with 358 Two Or More residents.
1.1% Hispanic with 94 Hispanic residents.
| Race | Virginia | MN | USA |
|---|---|---|---|
| White | 88.9% | 76.7% | 58.2% |
| African American | 1.1% | 6.7% | 12.0% |
| American Indian | 3.5% | 0.7% | 0.5% |
| Asian | 1.1% | 5.0% | 5.7% |
| Hawaiian | 0.0% | 0.0% | 0.2% |
| Other | 0.1% | 0.4% | 0.5% |
| Two Or More | 4.3% | 4.1% | 3.9% |
| Hispanic | 1.1% | 6.2% | 19.0% |
Gender in Virginia
Virginia is 49.6% female with 4,145 female residents.
Virginia is 50.4% male with 4,217 male residents.
| Gender | Virginia | MN | USA |
|---|---|---|---|
| Female | 49.6% | 49.9% | 50.5% |
| Male | 50.4% | 50.1% | 49.5% |
Highest level of educational attainment in Virginia for adults over 25
1.0% of adults in Virginia completed < 9th grade.
6.0% of adults in Virginia completed 9-12th grade.
34.0% of adults in Virginia completed high school / ged.
25.0% of adults in Virginia completed some college.
14.0% of adults in Virginia completed associate's degree.
14.0% of adults in Virginia completed bachelor's degree.
5.0% of adults in Virginia completed master's degree.
1.0% of adults in Virginia completed professional degree.
0.0% of adults in Virginia completed doctorate degree.
| Education | Virginia | MN | USA |
|---|---|---|---|
| < 9th Grade | 1.0% | 2.0% | 5.0% |
| 9-12th Grade | 6.0% | 3.0% | 6.0% |
| High School / GED | 34.0% | 24.0% | 26.0% |
| Some College | 25.0% | 20.0% | 19.0% |
| Associate's Degree | 14.0% | 12.0% | 9.0% |
| Bachelor's Degree | 14.0% | 25.0% | 21.0% |
| Master's Degree | 5.0% | 10.0% | 10.0% |
| Professional Degree | 1.0% | 2.0% | 2.0% |
| Doctorate Degree | 0.0% | 2.0% | 2.0% |
Household Income For Virginia, Minnesota
11.4% of households in Virginia earn Less than $10,000.
8.5% of households in Virginia earn $10,000 to $14,999.
9.9% of households in Virginia earn $15,000 to $24,999.
9.3% of households in Virginia earn $25,000 to $34,999.
13.8% of households in Virginia earn $35,000 to $49,999.
16.2% of households in Virginia earn $50,000 to $74,999.
12.9% of households in Virginia earn $75,000 to $99,999.
10.7% of households in Virginia earn $100,000 to $149,999.
4.7% of households in Virginia earn $150,000 to $199,999.
2.7% of households in Virginia earn $200,000 or more.
| Income | Virginia | MN | USA |
|---|---|---|---|
| Less than $10,000 | 11.4% | 3.5% | 4.9% |
| $10,000 to $14,999 | 8.5% | 2.8% | 3.6% |
| $15,000 to $24,999 | 9.9% | 5.4% | 6.6% |
| $25,000 to $34,999 | 9.3% | 5.8% | 6.8% |
| $35,000 to $49,999 | 13.8% | 9.6% | 10.4% |
| $50,000 to $74,999 | 16.2% | 15.7% | 15.7% |
| $75,000 to $99,999 | 12.9% | 13.5% | 12.7% |
| $100,000 to $149,999 | 10.7% | 19.7% | 17.4% |
| $150,000 to $199,999 | 4.7% | 10.9% | 9.3% |
| $200,000 or more | 2.7% | 13.1% | 12.6% |


