Independence, MO
Demographics And Statistics
Living In Independence, Missouri Summary
Life in Independence research summary. HomeSnacks has been using Saturday Night Science to research the quality of life in Independence over the past nine years using Census, FBI, Zillow, and other primary data sources. Based on the most recently available data, we found the following about life in Independence:
The population in Independence is 121,944.
The median home value in Independence is $205,180.
The median income in Independence is $59,480.
The cost of living in Independence is 86 which is 0.9x lower than the national average.
The median rent in Independence is $1,061.
The unemployment rate in Independence is 6.0%.
The poverty rate in Independence is 15.3%.
The average high in Independence is 65.2° and the average low is 45.0°.
Independence SnackAbility
Overall SnackAbility
Independence, MO Crime Report
Crime in Independence summary. We use data from the FBI to determine the crime rates in Independence. Key points include:
There were 4,925 total crimes in Independence in the last reporting year.
The overall crime rate per 100,000 people in Independence is 4,094.9 / 100k people.
The violent crime rate per 100,000 people in Independence is 571.2 / 100k people.
The property crime rate per 100,000 people in Independence is 3,523.7 / 100k people.
Overall, crime in Independence is 93.23% above the national average.
Total Crimes
Above National Average
Crime In Independence Comparison Table
| Statistic | Count Raw |
Independence / 100k People |
Missouri / 100k People |
National / 100k People |
|---|---|---|---|---|
| Total Crimes Per 100K | 4,925 | 4,094.9 | 2,403.3 | 2,119.2 |
| Violent Crime | 687 | 571.2 | 462.0 | 359.0 |
| Murder | 11 | 9.1 | 7.8 | 5.0 |
| Robbery | 91 | 75.7 | 51.5 | 61.0 |
| Aggravated Assault | 477 | 396.6 | 357.5 | 256.0 |
| Property Crime | 4,238 | 3,523.7 | 1,941.2 | 1,760.0 |
| Burglary | 490 | 407.4 | 236.3 | 229.0 |
| Larceny | 2,768 | 2,301.5 | 1,306.5 | 1,272.0 |
| Car Theft | 980 | 814.8 | 398.4 | 259.0 |
Independence, MO Cost Of Living
Cost of living in Independence summary. We use data on the cost of living to determine how expensive it is to live in Independence. Real estate prices drive most of the variance in cost of living around Missouri. Key points include:
The cost of living in Independence is 86 with 100 being average.
The cost of living in Independence is 0.9x lower than the national average.
The median home value in Independence is $205,180.
The median income in Independence is $59,480.
Independence's Overall Cost Of Living
Lower Than The National Average
Cost Of Living In Independence Comparison Table
| Living Expense | Independence | Missouri | National Average | |
|---|---|---|---|---|
| Overall | 86 | 88 | 100 | |
| Services | 92 | 93 | 100 | |
| Groceries | 98 | 96 | 100 | |
| Health | 83 | 91 | 100 | |
| Housing | 74 | 78 | 100 | |
| Transportation | 87 | 90 | 100 | |
| Utilities | 110 | 99 | 100 | |
Independence, MO Weather
The average high in Independence is 65.2° and the average low is 45.0°.
There are 70.6 days of precipitation each year.
Expect an average of 42.4 inches of precipitation each year with 14.1 inches of snow.
| Stat | Independence |
|---|---|
| Average Annual High | 65.2 |
| Average Annual Low | 45.0 |
| Annual Precipitation Days | 70.6 |
| Average Annual Precipitation | 42.4 |
| Average Annual Snowfall | 14.1 |
Average High
Days of Rain
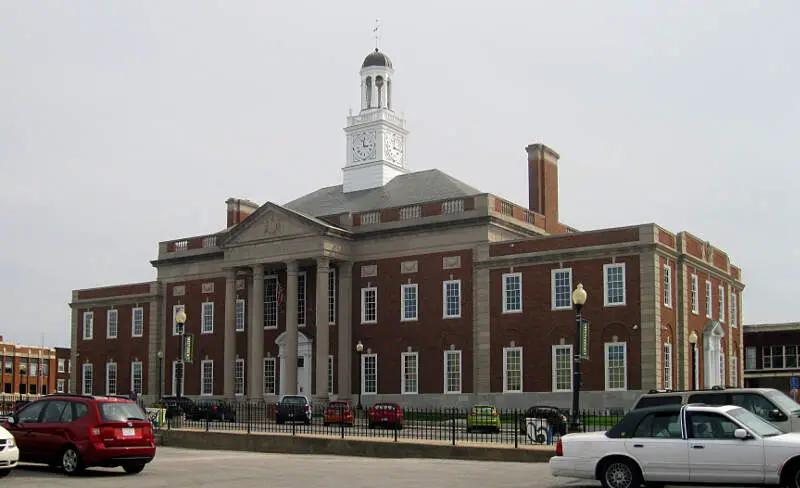
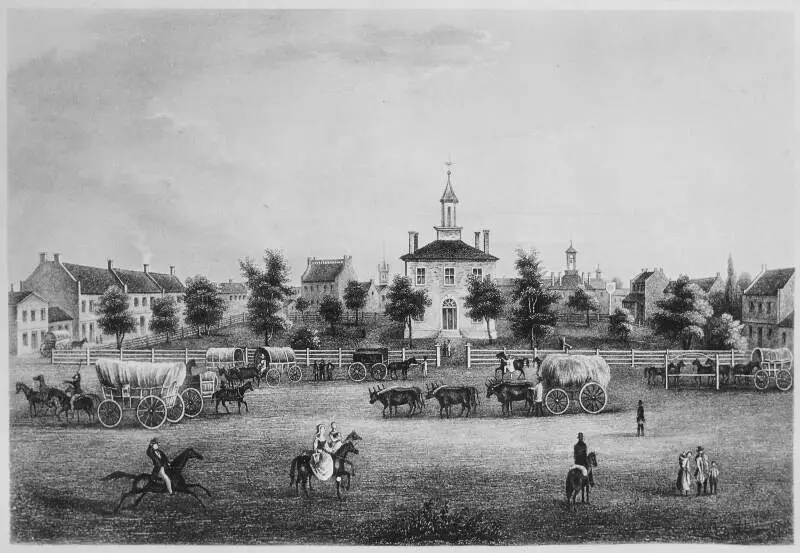
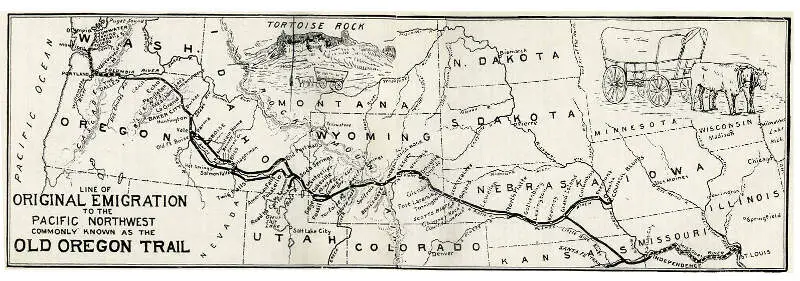
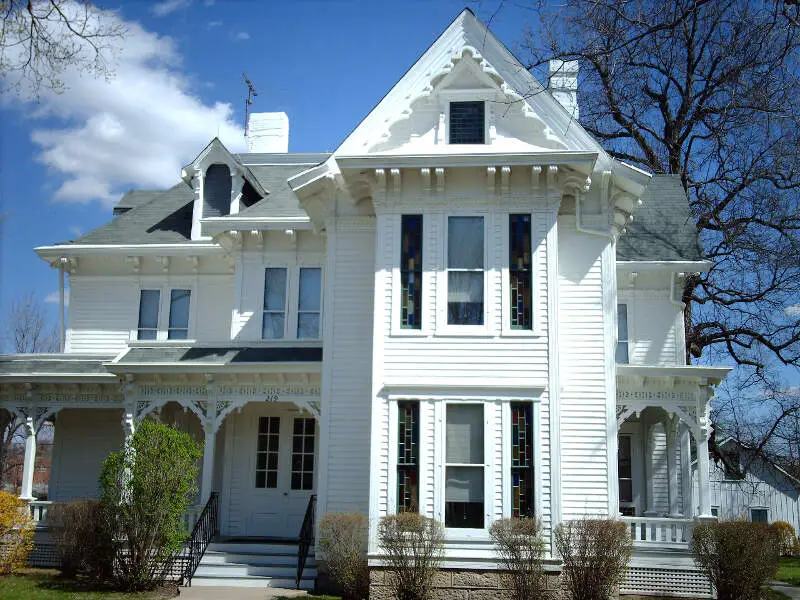
Independence, MO Photos

1 Reviews & Comments About Independence
/5

HomeSnacks User - 2019-03-18 23:11:13.830600
Too many drugs and drug users. Tax money spent on beautification not safety. Avoid this city. It's filthy and not heterosexual friendly. A liberal Mecca.
Not a damned thing the was good. Bad as an extension of Kansas City Missouri.
Rankings for Independence in Missouri


Locations Around Independence
Map Of Independence, MO
Best Places Around Independence
Lee's Summit, MO
Population 102,583
Kearney, MO
Population 10,696
Leawood, KS
Population 33,844
Mission Hills, KS
Population 3,556
Fairway, KS
Population 4,177
Liberty, MO
Population 30,446
Greenwood, MO
Population 6,000
Pleasant Hill, MO
Population 8,853
Blue Springs, MO
Population 59,416
Gladstone, MO
Population 27,069
Independence Demographics And Statistics
Population over time in Independence
The current population in Independence is 121,944. The population has increased 5.5% from 2010.
| Year | Population | % Change |
|---|---|---|
| 2023 | 121,944 | -0.2% |
| 2022 | 122,218 | -0.0% |
| 2021 | 122,230 | 4.3% |
| 2020 | 117,139 | 0.0% |
| 2019 | 117,084 | -0.1% |
| 2018 | 117,207 | -0.1% |
| 2017 | 117,369 | 0.1% |
| 2016 | 117,217 | 0.0% |
| 2015 | 117,192 | 0.0% |
| 2014 | 117,160 | 0.2% |
| 2013 | 116,881 | 0.3% |
| 2012 | 116,513 | 0.3% |
| 2011 | 116,118 | 0.5% |
| 2010 | 115,578 | - |
Race / Ethnicity in Independence
Independence is:
69.2% White with 84,342 White residents.
10.8% African American with 13,132 African American residents.
0.2% American Indian with 216 American Indian residents.
1.3% Asian with 1,627 Asian residents.
0.9% Hawaiian with 1,051 Hawaiian residents.
0.7% Other with 897 Other residents.
4.5% Two Or More with 5,493 Two Or More residents.
12.5% Hispanic with 15,186 Hispanic residents.
| Race | Independence | MO | USA |
|---|---|---|---|
| White | 69.2% | 76.8% | 58.2% |
| African American | 10.8% | 11.0% | 12.0% |
| American Indian | 0.2% | 0.2% | 0.5% |
| Asian | 1.3% | 2.1% | 5.7% |
| Hawaiian | 0.9% | 0.1% | 0.2% |
| Other | 0.7% | 0.4% | 0.5% |
| Two Or More | 4.5% | 4.4% | 3.9% |
| Hispanic | 12.5% | 5.1% | 19.0% |
Gender in Independence
Independence is 51.2% female with 62,420 female residents.
Independence is 48.8% male with 59,524 male residents.
| Gender | Independence | MO | USA |
|---|---|---|---|
| Female | 51.2% | 50.7% | 50.5% |
| Male | 48.8% | 49.3% | 49.5% |
Highest level of educational attainment in Independence for adults over 25
2.0% of adults in Independence completed < 9th grade.
7.0% of adults in Independence completed 9-12th grade.
37.0% of adults in Independence completed high school / ged.
24.0% of adults in Independence completed some college.
8.0% of adults in Independence completed associate's degree.
14.0% of adults in Independence completed bachelor's degree.
6.0% of adults in Independence completed master's degree.
1.0% of adults in Independence completed professional degree.
1.0% of adults in Independence completed doctorate degree.
| Education | Independence | MO | USA |
|---|---|---|---|
| < 9th Grade | 2.0% | 3.0% | 5.0% |
| 9-12th Grade | 7.0% | 6.0% | 6.0% |
| High School / GED | 37.0% | 30.0% | 26.0% |
| Some College | 24.0% | 21.0% | 19.0% |
| Associate's Degree | 8.0% | 8.0% | 9.0% |
| Bachelor's Degree | 14.0% | 20.0% | 21.0% |
| Master's Degree | 6.0% | 9.0% | 10.0% |
| Professional Degree | 1.0% | 2.0% | 2.0% |
| Doctorate Degree | 1.0% | 1.0% | 2.0% |
Household Income For Independence, Missouri
5.5% of households in Independence earn Less than $10,000.
3.8% of households in Independence earn $10,000 to $14,999.
10.0% of households in Independence earn $15,000 to $24,999.
8.2% of households in Independence earn $25,000 to $34,999.
13.5% of households in Independence earn $35,000 to $49,999.
20.5% of households in Independence earn $50,000 to $74,999.
13.6% of households in Independence earn $75,000 to $99,999.
15.4% of households in Independence earn $100,000 to $149,999.
6.1% of households in Independence earn $150,000 to $199,999.
3.3% of households in Independence earn $200,000 or more.
| Income | Independence | MO | USA |
|---|---|---|---|
| Less than $10,000 | 5.5% | 4.8% | 4.9% |
| $10,000 to $14,999 | 3.8% | 4.0% | 3.6% |
| $15,000 to $24,999 | 10.0% | 7.6% | 6.6% |
| $25,000 to $34,999 | 8.2% | 7.9% | 6.8% |
| $35,000 to $49,999 | 13.5% | 12.2% | 10.4% |
| $50,000 to $74,999 | 20.5% | 17.5% | 15.7% |
| $75,000 to $99,999 | 13.6% | 13.3% | 12.7% |
| $100,000 to $149,999 | 15.4% | 16.9% | 17.4% |
| $150,000 to $199,999 | 6.1% | 7.7% | 9.3% |
| $200,000 or more | 3.3% | 8.1% | 12.6% |


