St. Joseph, MO
Demographics And Statistics
Living In St. Joseph, Missouri Summary
Life in St. Joseph research summary. HomeSnacks has been using Saturday Night Science to research the quality of life in St. Joseph over the past nine years using Census, FBI, Zillow, and other primary data sources. Based on the most recently available data, we found the following about life in St. Joseph:
The population in St. Joseph is 71,542.
The median home value in St. Joseph is $178,249.
The median income in St. Joseph is $55,578.
The cost of living in St. Joseph is 85 which is 0.8x lower than the national average.
The median rent in St. Joseph is $884.
The unemployment rate in St. Joseph is 4.7%.
The poverty rate in St. Joseph is 18.7%.
The average high in St. Joseph is 64.0° and the average low is 42.7°.
St. Joseph SnackAbility
Overall SnackAbility
St. Joseph, MO Crime Report
Crime in St. Joseph summary. We use data from the FBI to determine the crime rates in St. Joseph. Key points include:
There were 3,212 total crimes in St. Joseph in the last reporting year.
The overall crime rate per 100,000 people in St. Joseph is 4,579.5 / 100k people.
The violent crime rate per 100,000 people in St. Joseph is 728.6 / 100k people.
The property crime rate per 100,000 people in St. Joseph is 3,850.9 / 100k people.
Overall, crime in St. Joseph is 116.09% above the national average.
Total Crimes
Above National Average
Crime In St. Joseph Comparison Table
| Statistic | Count Raw |
St. Joseph / 100k People |
Missouri / 100k People |
National / 100k People |
|---|---|---|---|---|
| Total Crimes Per 100K | 3,212 | 4,579.5 | 2,403.3 | 2,119.2 |
| Violent Crime | 511 | 728.6 | 462.0 | 359.0 |
| Murder | 3 | 4.3 | 7.8 | 5.0 |
| Robbery | 38 | 54.2 | 51.5 | 61.0 |
| Aggravated Assault | 345 | 491.9 | 357.5 | 256.0 |
| Property Crime | 2,701 | 3,850.9 | 1,941.2 | 1,760.0 |
| Burglary | 376 | 536.1 | 236.3 | 229.0 |
| Larceny | 1,946 | 2,774.5 | 1,306.5 | 1,272.0 |
| Car Theft | 379 | 540.4 | 398.4 | 259.0 |
St. Joseph, MO Cost Of Living
Cost of living in St. Joseph summary. We use data on the cost of living to determine how expensive it is to live in St. Joseph. Real estate prices drive most of the variance in cost of living around Missouri. Key points include:
The cost of living in St. Joseph is 85 with 100 being average.
The cost of living in St. Joseph is 0.8x lower than the national average.
The median home value in St. Joseph is $178,249.
The median income in St. Joseph is $55,578.
St. Joseph's Overall Cost Of Living
Lower Than The National Average
Cost Of Living In St. Joseph Comparison Table
| Living Expense | St. Joseph | Missouri | National Average | |
|---|---|---|---|---|
| Overall | 85 | 88 | 100 | |
| Services | 90 | 93 | 100 | |
| Groceries | 95 | 96 | 100 | |
| Health | 84 | 91 | 100 | |
| Housing | 68 | 78 | 100 | |
| Transportation | 90 | 90 | 100 | |
| Utilities | 109 | 99 | 100 | |
St. Joseph, MO Weather
The average high in St. Joseph is 64.0° and the average low is 42.7°.
There are 56.9 days of precipitation each year.
Expect an average of 36.1 inches of precipitation each year with 18.3 inches of snow.
| Stat | St. Joseph |
|---|---|
| Average Annual High | 64.0 |
| Average Annual Low | 42.7 |
| Annual Precipitation Days | 56.9 |
| Average Annual Precipitation | 36.1 |
| Average Annual Snowfall | 18.3 |
Average High
Days of Rain
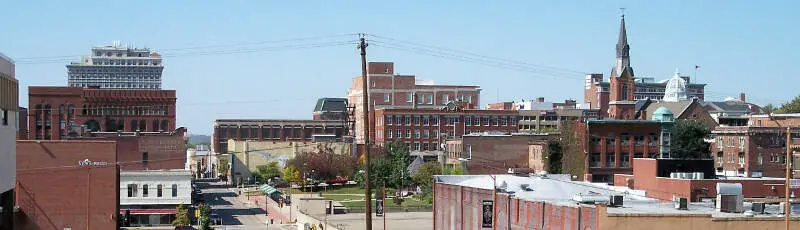
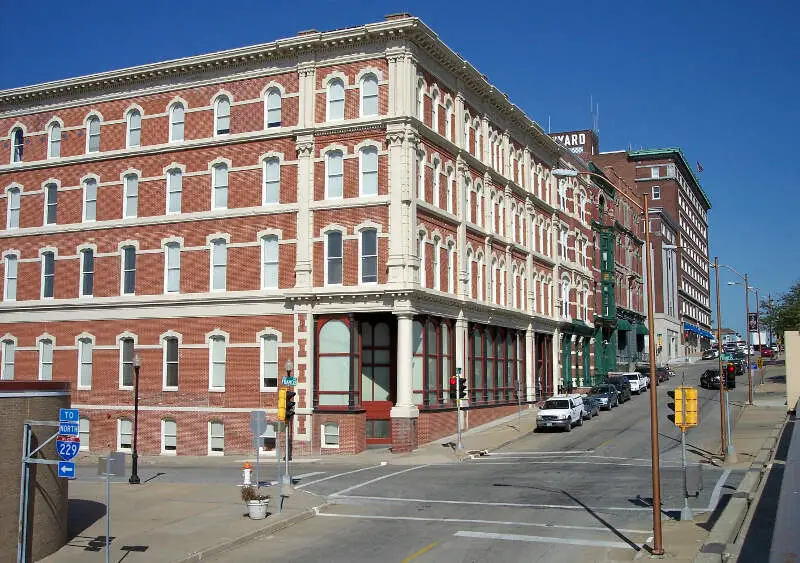
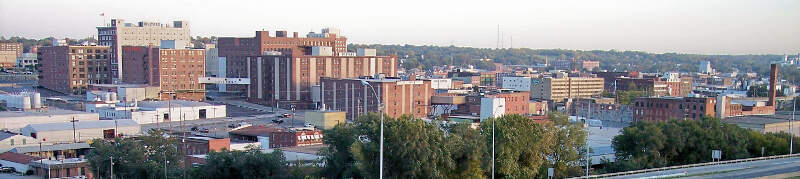
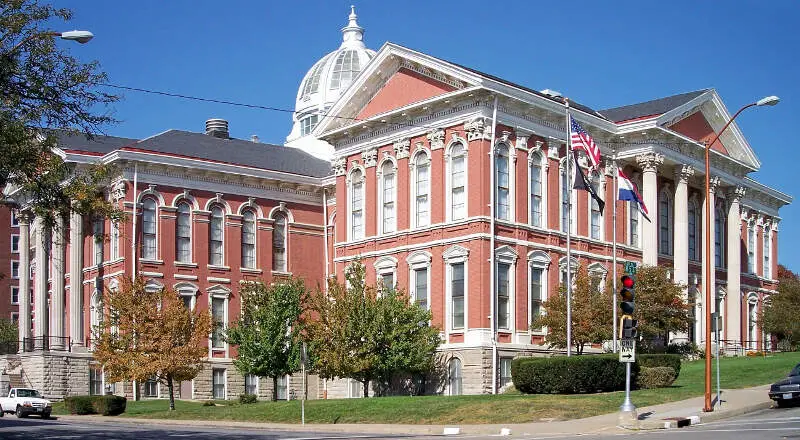
St. Joseph, MO Photos

Rankings for St. Joseph in Missouri


Locations Around St. Joseph
Map Of St. Joseph, MO
Best Places Around St. Joseph
Parkville, MO
Population 8,022
Kearney, MO
Population 10,696
Savannah, MO
Population 5,062
Liberty, MO
Population 30,446
Smithville, MO
Population 10,552
King, NC
Population 7,345
Gladstone, MO
Population 27,069
Basehor, KS
Population 7,229
Excelsior Springs, MO
Population 10,502
Maryville, MO
Population 10,556
St. Joseph Demographics And Statistics
Population over time in St. Joseph
The current population in St. Joseph is 71,542. The population has decreased -5.8% from 2010.
| Year | Population | % Change |
|---|---|---|
| 2023 | 71,542 | -0.9% |
| 2022 | 72,198 | -1.3% |
| 2021 | 73,138 | -3.0% |
| 2020 | 75,369 | -0.7% |
| 2019 | 75,913 | -0.7% |
| 2018 | 76,465 | -0.5% |
| 2017 | 76,819 | -0.1% |
| 2016 | 76,901 | -0.2% |
| 2015 | 77,037 | -0.0% |
| 2014 | 77,040 | 0.1% |
| 2013 | 76,984 | 0.3% |
| 2012 | 76,729 | 0.4% |
| 2011 | 76,447 | 0.7% |
| 2010 | 75,911 | - |
Race / Ethnicity in St. Joseph
St. Joseph is:
78.6% White with 56,265 White residents.
6.6% African American with 4,689 African American residents.
0.3% American Indian with 192 American Indian residents.
1.4% Asian with 970 Asian residents.
0.5% Hawaiian with 358 Hawaiian residents.
0.1% Other with 76 Other residents.
4.9% Two Or More with 3,498 Two Or More residents.
7.7% Hispanic with 5,494 Hispanic residents.
| Race | St. Joseph | MO | USA |
|---|---|---|---|
| White | 78.6% | 76.8% | 58.2% |
| African American | 6.6% | 11.0% | 12.0% |
| American Indian | 0.3% | 0.2% | 0.5% |
| Asian | 1.4% | 2.1% | 5.7% |
| Hawaiian | 0.5% | 0.1% | 0.2% |
| Other | 0.1% | 0.4% | 0.5% |
| Two Or More | 4.9% | 4.4% | 3.9% |
| Hispanic | 7.7% | 5.1% | 19.0% |
Gender in St. Joseph
St. Joseph is 49.5% female with 35,439 female residents.
St. Joseph is 50.5% male with 36,103 male residents.
| Gender | St. Joseph | MO | USA |
|---|---|---|---|
| Female | 49.5% | 50.7% | 50.5% |
| Male | 50.5% | 49.3% | 49.5% |
Highest level of educational attainment in St. Joseph for adults over 25
4.0% of adults in St. Joseph completed < 9th grade.
7.0% of adults in St. Joseph completed 9-12th grade.
38.0% of adults in St. Joseph completed high school / ged.
22.0% of adults in St. Joseph completed some college.
6.0% of adults in St. Joseph completed associate's degree.
16.0% of adults in St. Joseph completed bachelor's degree.
5.0% of adults in St. Joseph completed master's degree.
1.0% of adults in St. Joseph completed professional degree.
1.0% of adults in St. Joseph completed doctorate degree.
| Education | St. Joseph | MO | USA |
|---|---|---|---|
| < 9th Grade | 4.0% | 3.0% | 5.0% |
| 9-12th Grade | 7.0% | 6.0% | 6.0% |
| High School / GED | 38.0% | 30.0% | 26.0% |
| Some College | 22.0% | 21.0% | 19.0% |
| Associate's Degree | 6.0% | 8.0% | 9.0% |
| Bachelor's Degree | 16.0% | 20.0% | 21.0% |
| Master's Degree | 5.0% | 9.0% | 10.0% |
| Professional Degree | 1.0% | 2.0% | 2.0% |
| Doctorate Degree | 1.0% | 1.0% | 2.0% |
Household Income For St. Joseph, Missouri
7.7% of households in St. Joseph earn Less than $10,000.
5.3% of households in St. Joseph earn $10,000 to $14,999.
10.3% of households in St. Joseph earn $15,000 to $24,999.
9.2% of households in St. Joseph earn $25,000 to $34,999.
13.6% of households in St. Joseph earn $35,000 to $49,999.
18.0% of households in St. Joseph earn $50,000 to $74,999.
13.1% of households in St. Joseph earn $75,000 to $99,999.
12.5% of households in St. Joseph earn $100,000 to $149,999.
5.2% of households in St. Joseph earn $150,000 to $199,999.
5.0% of households in St. Joseph earn $200,000 or more.
| Income | St. Joseph | MO | USA |
|---|---|---|---|
| Less than $10,000 | 7.7% | 4.8% | 4.9% |
| $10,000 to $14,999 | 5.3% | 4.0% | 3.6% |
| $15,000 to $24,999 | 10.3% | 7.6% | 6.6% |
| $25,000 to $34,999 | 9.2% | 7.9% | 6.8% |
| $35,000 to $49,999 | 13.6% | 12.2% | 10.4% |
| $50,000 to $74,999 | 18.0% | 17.5% | 15.7% |
| $75,000 to $99,999 | 13.1% | 13.3% | 12.7% |
| $100,000 to $149,999 | 12.5% | 16.9% | 17.4% |
| $150,000 to $199,999 | 5.2% | 7.7% | 9.3% |
| $200,000 or more | 5.0% | 8.1% | 12.6% |


