Most African American cities in South Carolina research summary. We used Saturday Night Science to analyze South Carolina’s most recent Census data to determine the cities with the largest Black population, based on the percentage of Black residents.
The city with the largest African American population in South Carolina is Orangeburg (73.7% Black); the least is Mount Pleasant (2.7%). Statewide, South Carolina is 24.6% Black — the 6th blackest state in the country.
Roughly 42 million people identifying as Black or African American live in the United States, about 12% of the total population. In South Carolina, the Black population is 1,302,215, at 24.6% of the state total.
We broke down the most recent Census data to determine the cities in South Carolina with the largest African American population in 2026.
#1 most African American in South Carolina
Orangeburg, also known as The Garden City, is the principal city in and the county seat of Orangeburg County, South Carolina, United States. The population of the city was 13,964 according to the 2010 United States census. The city is located 37 miles southeast of Columbia, on the north fork of the Edisto River in the Piedmont area.
Data | Crime | Cost of living | Movers
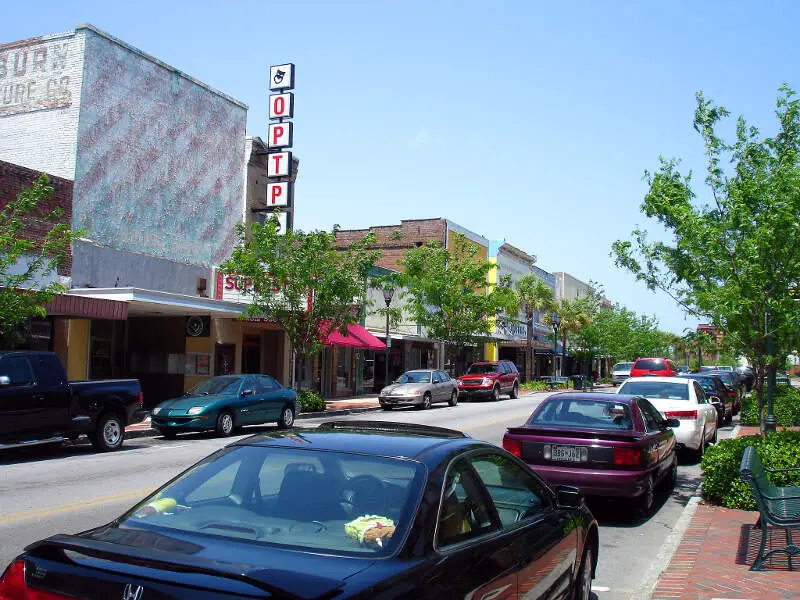
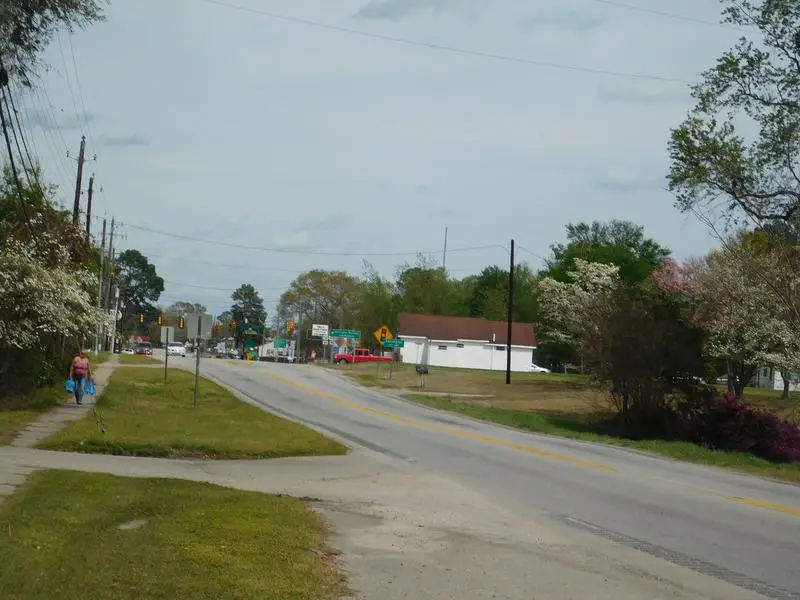
#2 most African American in South Carolina
Lake City is a city in Florence County, South Carolina, United States. The population was 6,675 at the 2010 census. Located in central South Carolina, it is south of Florence and included as part of the Florence Metropolitan Statistical Area.
Data | Crime | Cost of living | Movers
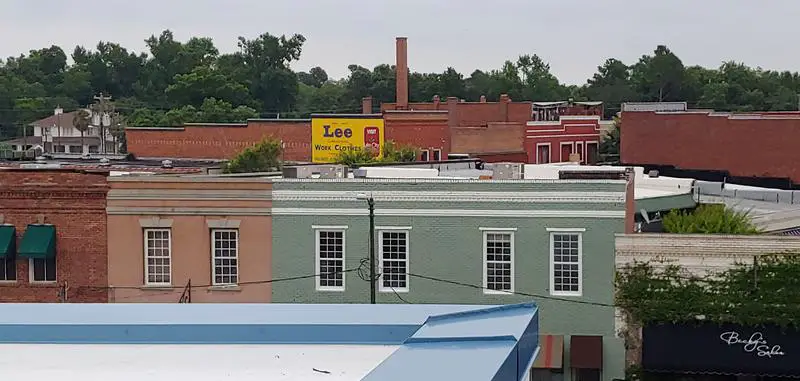
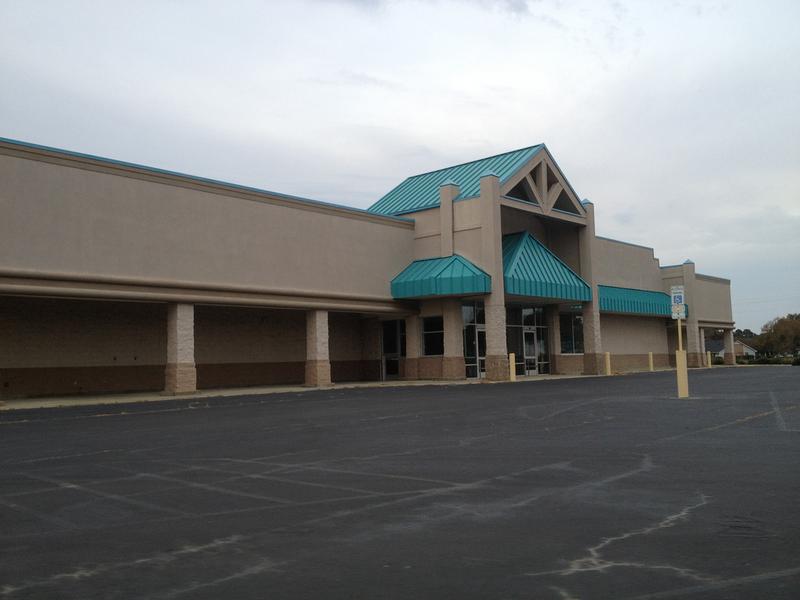
#3 most African American in South Carolina
Marion is a city in Marion County, South Carolina, United States. The population was 6,711 at the 2016 census. It is the county seat of Marion County. It is named for Francis Marion, a Brigadier General from South Carolina in the American Revolutionary War.
Data | Crime | Cost of living | Movers
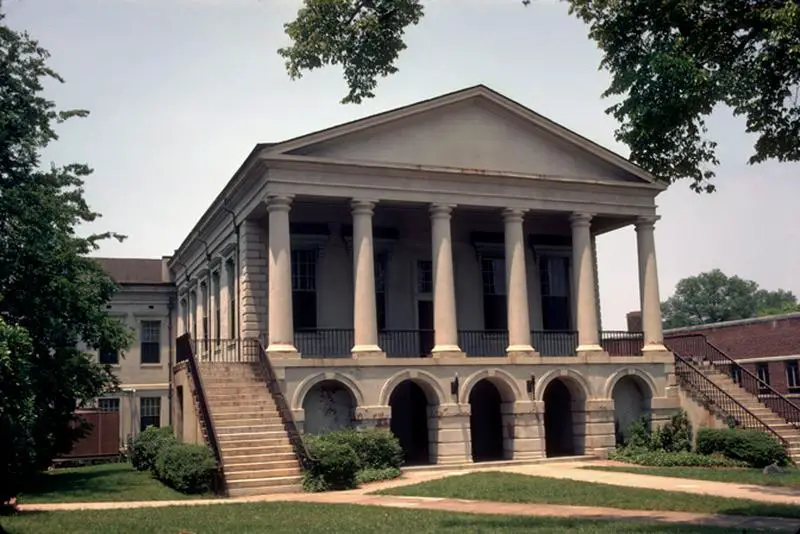
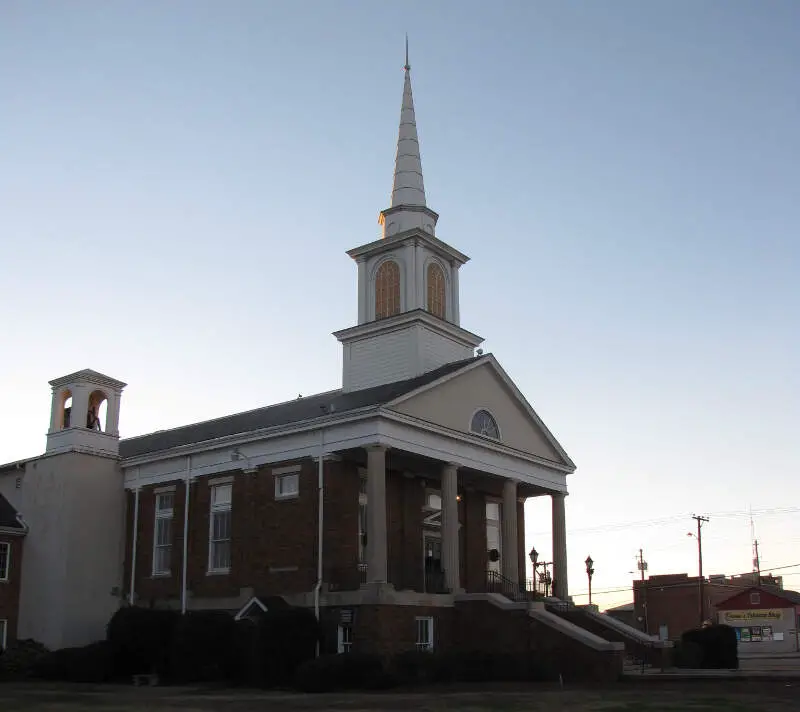
#4 most African American in South Carolina
Chester is a small rural city in Chester County, South Carolina, United States. The population was 5,607 at the 2010 census, down from 6,476 at the 2000 census. It is the county seat of Chester County.
Data | Crime | Cost of living | Movers
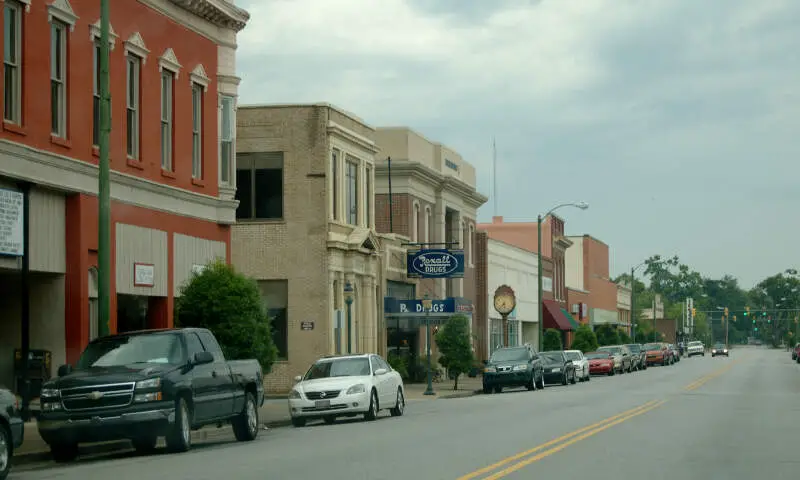
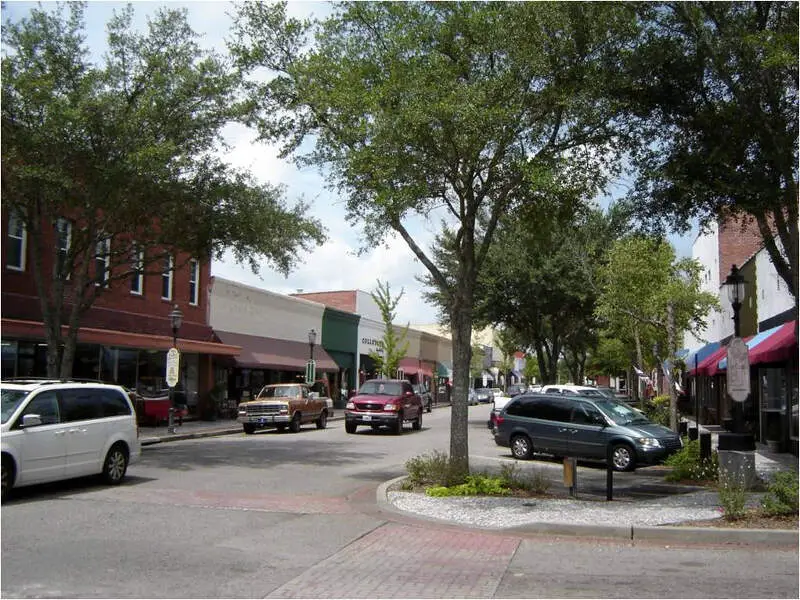
#5 most African American in South Carolina
Darlington is a city located in Darlington County, South Carolina, United States. In 2016, its population was 6,117. It is the county seat of Darlington County. It is part of the Florence, South Carolina Metropolitan Statistical Area.
Data | Crime | Cost of living | Movers
#6 most African American in South Carolina
Bennettsville is a city located in the U.S. state of South Carolina on the Great Pee Dee River. As the county seat of Marlboro County, Bennettsville is noted for its historic homes and buildings from the 19th and early 20th centuries – including the Bennettsville Historic District which is listed on the National Register of Historic Places.
Data | Crime | Cost of living | Movers
#7 most African American in South Carolina
Data | Crime | Cost of living | Movers
#8 most African American in South Carolina
Walterboro is a city in Colleton County, South Carolina, United States. The population was 5,398 at the 2010 census. It is the county seat of Colleton County. Walterboro is located 48 miles west of Charleston and is located near the ACE Basin region in the South Carolina Lowcountry.
Data | Crime | Cost of living | Movers
#9 most African American in South Carolina
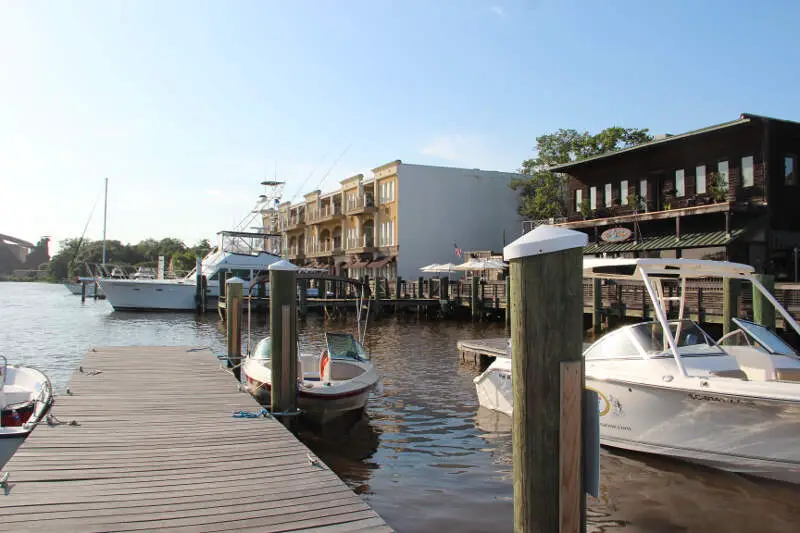
Georgetown is the third oldest city in the U.S. state of South Carolina and the county seat of Georgetown County, in the Lowcountry. As of the 2010 census it had a population of 9,163. Located on Winyah Bay at the confluence of the Black, Great Pee Dee, Waccamaw, and Sampit rivers, Georgetown is the second largest seaport in South Carolina, handling over 960,000 tons of materials a year. Georgetown is also the birthplace of former First Lady Michelle Obama’s grandfather, Fraser Robinson. Many of Michelle Obama’s relatives still reside in Georgetown.
Data | Crime | Cost of living | Movers
#10 most African American in South Carolina
Data | Crime | Cost of living | Movers
The receipts
Compare the top ten
Pick a metric. The bars rescale. The red line is South Carolina’s statewide median.
On the map
Where South Carolina’s Black communities live
Saturday Night Science
Methodology: How We Determined The Cities In South Carolina With The Largest Black Population For 2026
We still believe in the accuracy of data — especially from the Census. So that’s where we went to get the race breakdown across South Carolina.
That leads us to the Census’s most recently available data, the 2020-2024 American Community Survey data from the US Census.
Specifically, we looked at table B03002: Hispanic OR LATINO ORIGIN BY RACE. Here are the category names as defined by the Census:
- Hispanic or Latino
- White alone*
- Black or African American alone*
- American Indian and Alaska Native alone*
- Asian alone*
- Native Hawaiian and Other Pacific Islander alone*
- Some other race alone*
- Two or more races*
Our particular column of interest was the number of people who identified as Black or African American.
We limited our analysis to non-CDPs with a population greater than 5,000 people in South Carolina. That left us with 56 cities.
We then calculated the percentage of residents that are Black or African American. The percentages ranked from 73.7% to 2.7%.
Finally, we ranked each city based on the percentage of the Black population, with a higher score being more Black than a lower score. Orangeburg took the distinction of being the most Black, while Mount Pleasant was the least African American city.
We updated this article for 2026. This is our eleventh time ranking the cities in South Carolina with the largest African American population.
The full plate
African American Population By City In South Carolina
Click any column to sort. Search by city name.
| Rank | City | Population | African American Population | % African American |
|---|---|---|---|---|
| 1 | Orangeburg | 13,253 | 9,762 | 73.7% |
| 2 | Lake City | 5,988 | 4,155 | 69.4% |
| 3 | Marion | 6,206 | 4,137 | 66.7% |
| 4 | Chester | 5,218 | 3,253 | 62.3% |
| 5 | Darlington | 6,120 | 3,750 | 61.3% |
| 6 | Bennettsville | 7,751 | 4,572 | 59.0% |
| 7 | Dillon | 6,354 | 3,457 | 54.4% |
| 8 | Walterboro | 5,480 | 2,750 | 50.2% |
| 9 | Georgetown | 8,565 | 4,273 | 49.9% |
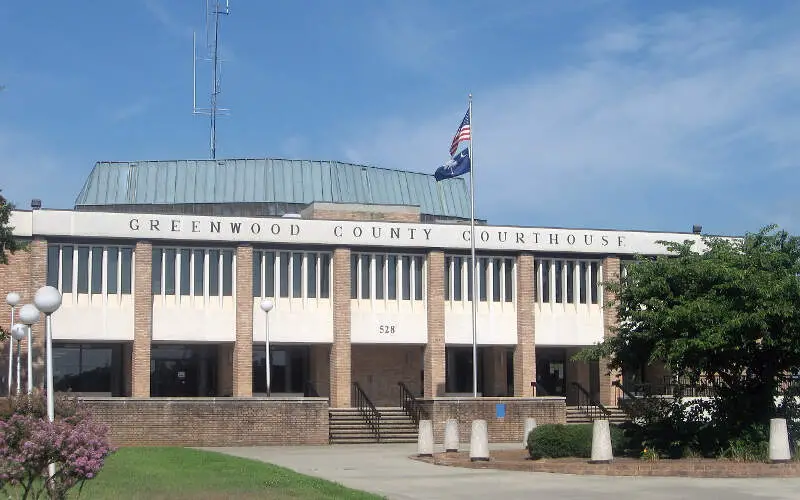
| 10 | Greenwood | 22,536 | 11,227 | 49.8% |
| 11 | Florence | 40,408 | 20,105 | 49.8% |
| 12 | Hartsville | 7,419 | 3,472 | 46.8% |
| 13 | Sumter | 43,053 | 19,850 | 46.1% |
| 14 | Lancaster | 8,921 | 4,098 | 45.9% |
| 15 | Union | 8,079 | 3,478 | 43.0% |
| 16 | Newberry | 10,790 | 4,499 | 41.7% |
| 17 | North Charleston | 119,913 | 49,477 | 41.3% |
| 18 | Gaffney | 12,596 | 5,112 | 40.6% |
| 19 | Clinton | 7,676 | 3,082 | 40.2% |
| 20 | Columbia | 139,643 | 56,006 | 40.1% |
| 21 | Spartanburg | 38,910 | 15,277 | 39.3% |
| 22 | Moncks Corner | 15,485 | 6,022 | 38.9% |
| 23 | Rock Hill | 75,259 | 28,613 | 38.0% |
| 24 | Laurens | 9,336 | 3,515 | 37.6% |
| 25 | Camden | 8,267 | 2,560 | 31.0% |
| 26 | Aiken | 32,521 | 9,800 | 30.1% |
| 27 | Irmo | 11,813 | 3,234 | 27.4% |
| 28 | Anderson | 30,051 | 8,126 | 27.0% |
| 29 | Beaufort | 13,747 | 3,573 | 26.0% |
| 30 | Fountain Inn | 12,020 | 3,101 | 25.8% |
| 31 | Cayce | 13,741 | 3,532 | 25.7% |
| 32 | York | 8,969 | 2,222 | 24.8% |
| 33 | Conway | 27,263 | 6,742 | 24.7% |
| 34 | Mauldin | 27,055 | 6,372 | 23.6% |
| 35 | Goose Creek | 48,078 | 11,040 | 23.0% |
| 36 | Greenville | 72,935 | 14,160 | 19.4% |
| 37 | Summerville | 51,654 | 10,019 | 19.4% |
| 38 | Seneca | 8,993 | 1,563 | 17.4% |
| 39 | Greer | 41,536 | 7,217 | 17.4% |
| 40 | Simpsonville | 26,144 | 4,343 | 16.6% |
| 41 | North Augusta | 25,653 | 4,162 | 16.2% |
| 42 | West Columbia | 17,963 | 2,894 | 16.1% |
| 43 | Charleston | 154,338 | 24,319 | 15.8% |
| 44 | Myrtle Beach | 38,371 | 5,646 | 14.7% |
| 45 | Port Royal | 15,579 | 2,125 | 13.6% |
| 46 | Fort Mill | 30,775 | 3,947 | 12.8% |
| 47 | Forest Acres | 10,530 | 1,345 | 12.8% |
| 48 | Lexington | 24,585 | 2,731 | 11.1% |
| 49 | Hanahan | 21,452 | 2,235 | 10.4% |
| 50 | Bluffton | 33,157 | 2,984 | 9.0% |
| 51 | Clemson | 18,072 | 1,456 | 8.1% |
| 52 | Easley | 24,841 | 1,837 | 7.4% |
| 53 | Hilton Head Island | 37,911 | 2,720 | 7.2% |
| 54 | Tega Cay | 13,615 | 565 | 4.1% |
| 55 | North Myrtle Beach | 19,855 | 575 | 2.9% |
| 56 | Mount Pleasant | 93,993 | 2,553 | 2.7% |
Source: U.S. Census ACS 2020-2024. 56 cities with more than 5,000 residents.
Summary
Summary: Black Populations Across South Carolina
If you’re looking for a breakdown of African American populations across South Carolina according to the most recent data, this is an accurate list.
The blackest cities in South Carolina are Orangeburg, Lake City, Marion, Chester, Darlington, Bennettsville, Dillon, Walterboro, Georgetown, and Greenwood. Not sold on South Carolina? Take the two-minute Find Your Place quiz and see which state actually fits you.


