Most Asian cities in Arkansas research summary. We analyzed Arkansas’s most recent Census data to determine the most Asian cities in Arkansas based on the percentage of Asian residents.
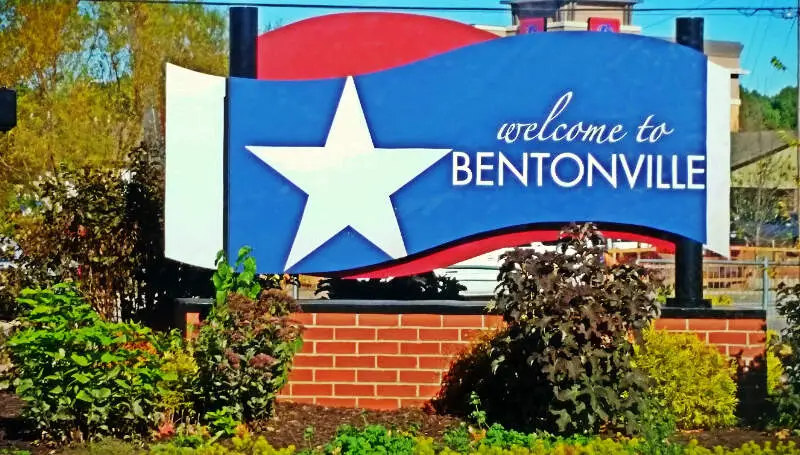
13.1% Asian · #1 most Asian in Arkansas
Bentonville is the ninth-largest city in Arkansas and the county seat of Benton County. The city is centrally located in the county with Rogers adjacent to the east. The city is the headquarters of Walmart, which is the world’s largest retailer. Originally named Osage after the Osage Indians who hunted in the area when white settlers first moved to the area in 1837, the community was renamed to Bentonville in 1906 in honor of New York inventor Linn Boyd Benton, after being first incorporated on April 3, 1873. It is one of the four main cities in the four-county Northwest Arkansas Metropolitan Statistical Area, which is ranked 109th in terms of population in the United States with 463,204 in 2010 according to the United States Census Bureau. The city itself had a population of 35,301 at the 2010 Census, with an estimated population of 47,093 in 2016.
Data | Crime | Cost of living | Movers
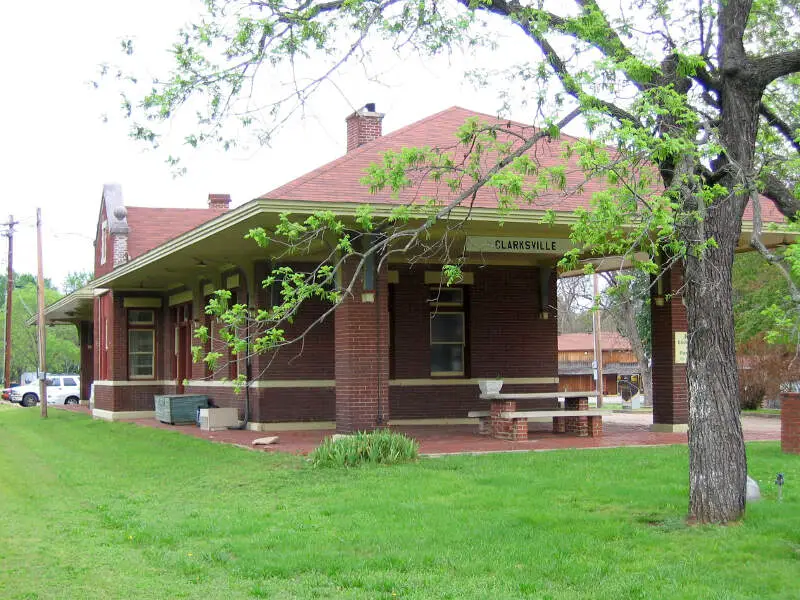
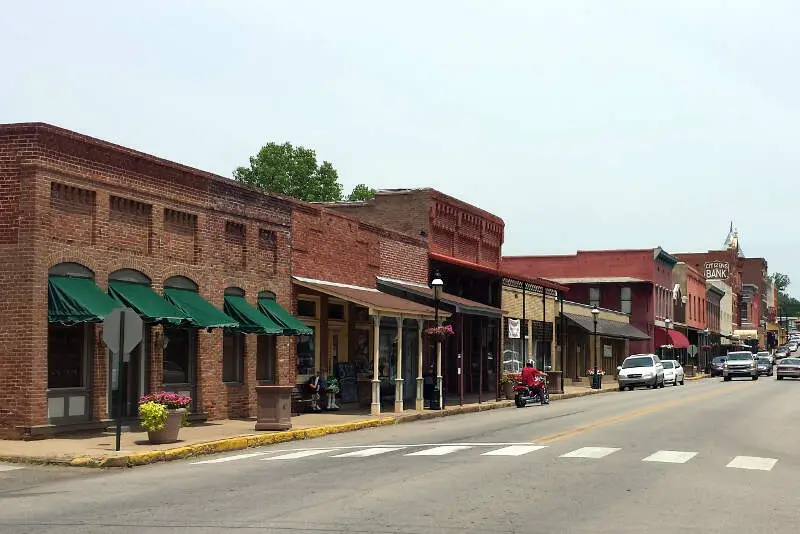
6.3% Asian · #2 most Asian in Arkansas
Data | Crime | Cost of living | Movers
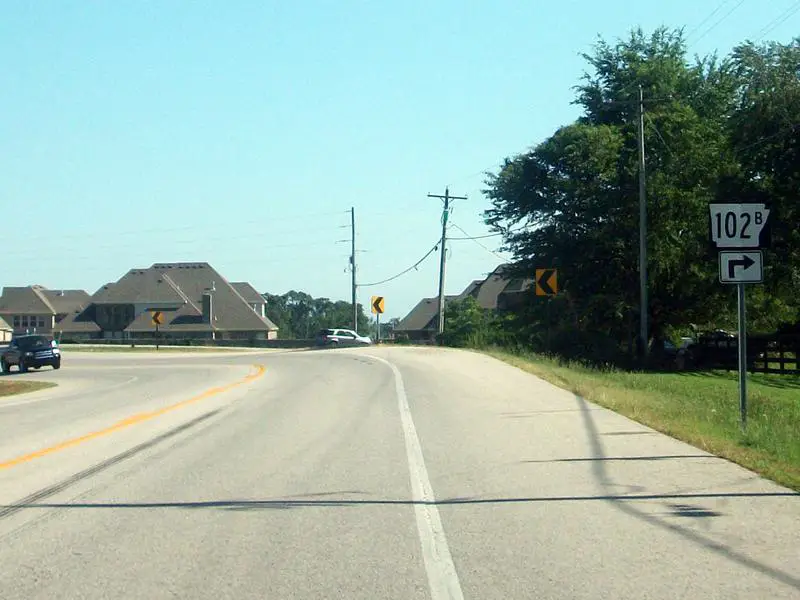
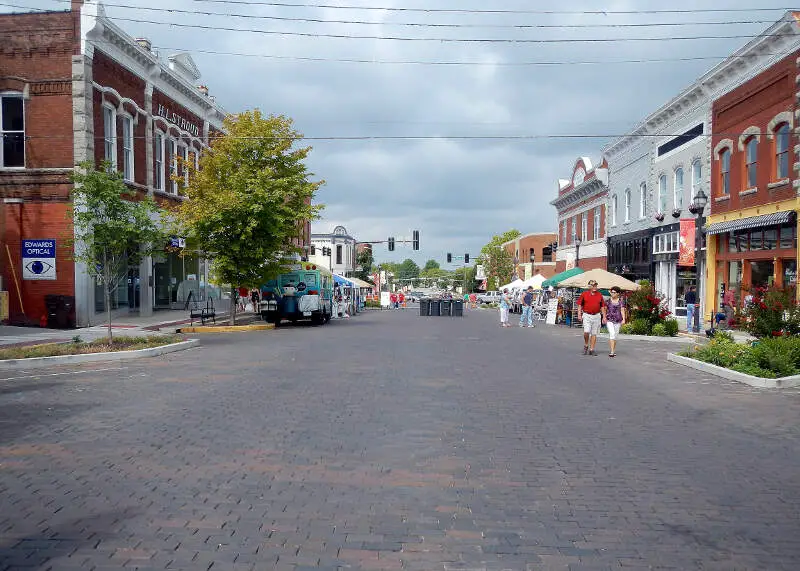
6.0% Asian · #3 most Asian in Arkansas
Centerton is a city in Benton County, Arkansas, United States. The population was 9,515 at the 2010 census. Centerton is part of the Fayetteville-Springdale-Rogers, AR-MO Metropolitan Statistical Area.
Data | Crime | Cost of living | Movers
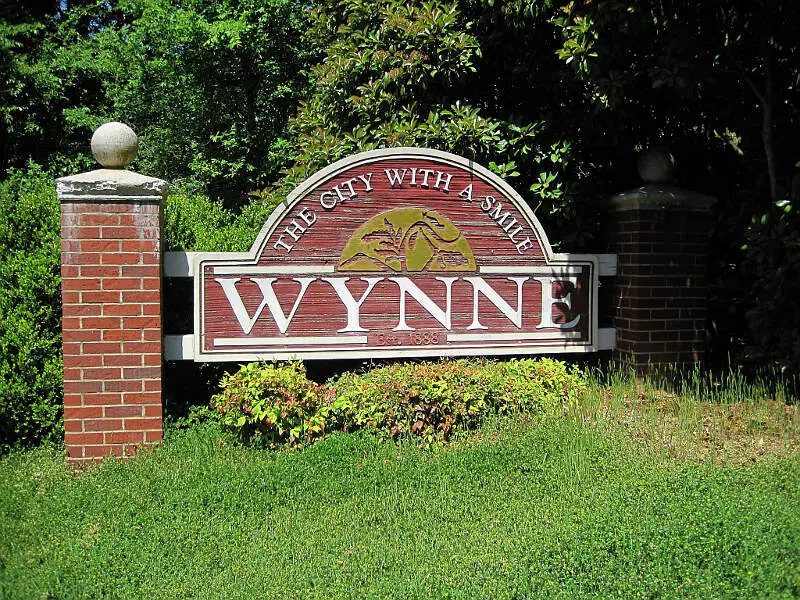
5.8% Asian · #4 most Asian in Arkansas
Data | Crime | Cost of living | Movers
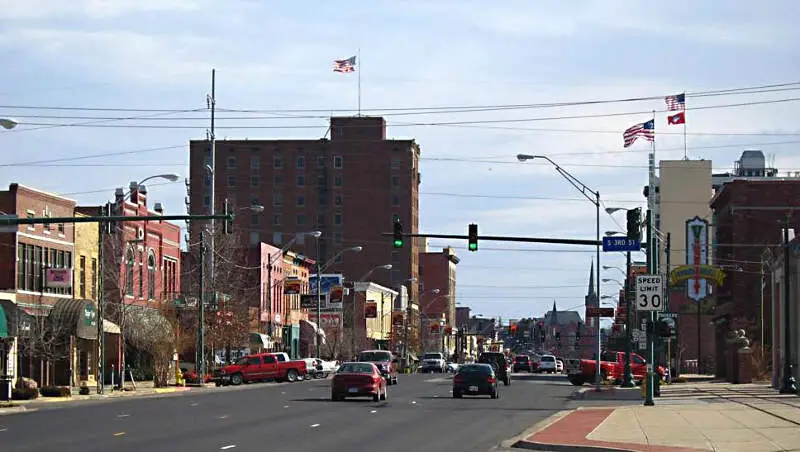
5.3% Asian · #5 most Asian in Arkansas
Fort Smith is the second-largest city in Arkansas and one of the two county seats of Sebastian County. As of the 2010 Census, the population was 86,209. With an estimated population of 87,443 In 2012, it is the principal city of the Fort Smith, Arkansas-Oklahoma Metropolitan Statistical Area, a region of 298,592 residents that encompasses the Arkansas counties of Crawford, Franklin, and Sebastian, and the Oklahoma counties of Le Flore and Sequoyah.
Data | Crime | Cost of living | Movers
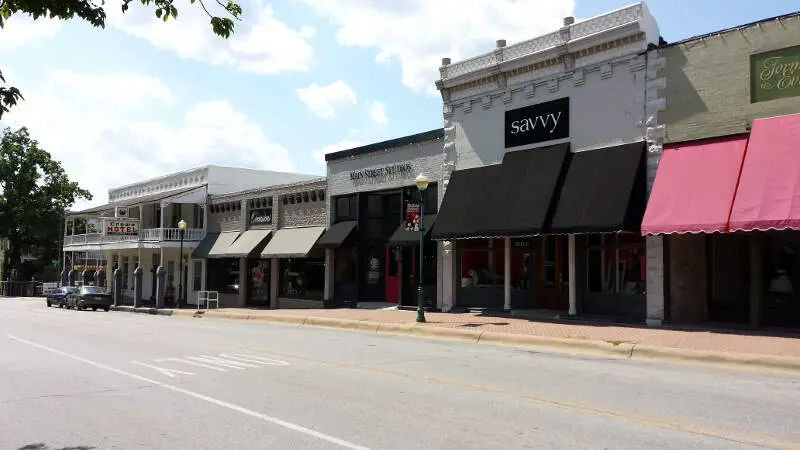
3.6% Asian · #6 most Asian in Arkansas
Siloam Springs is a city in Benton County, Arkansas, United States. The city shares a border on the Arkansas-Oklahoma state line with the city of West Siloam Springs, Oklahoma, which is within the Cherokee Nation territory. The town was founded in 1882 and was characterized by the purported healing powers of the spring water feeding Sager Creek and trading with nearby Native American tribes. John Brown University was founded in 1919 as a private, interdenominational, Christian liberal arts college in the city. Today, Siloam Springs is known for its efforts to preserve and revitalize the city’s historic downtown and as a promoter of the arts via Sager Creek Arts Center and the JBU art gallery. The community is located on the western edge of the growing Northwest Arkansas metropolitan area and has had a population increase of 47% to 15,039 between the 2000 and 2010 censuses.
Data | Crime | Cost of living | Movers
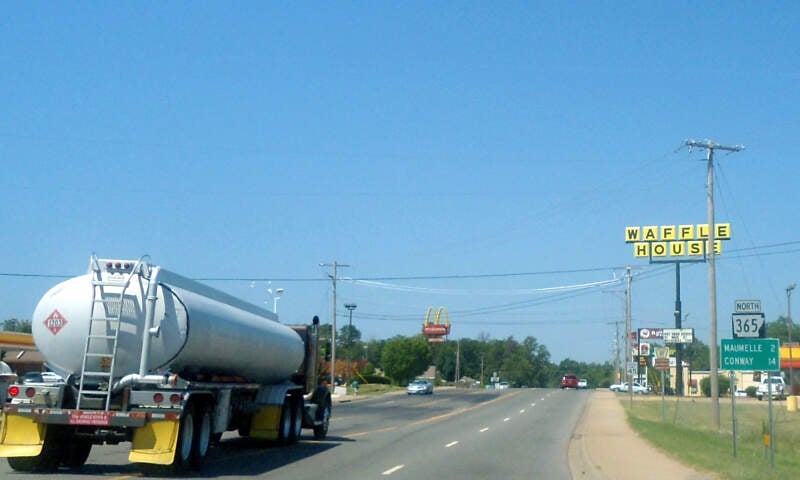
3.5% Asian · #7 most Asian in Arkansas
Maumelle is an affluent city in Pulaski County, Arkansas, United States. As of the 2010 census, the city population was 17,163. The city is located northwest of Little Rock, bordering the opposite shore of the Arkansas River and is part of the Little Rock metropolitan area.
Data | Crime | Cost of living | Movers
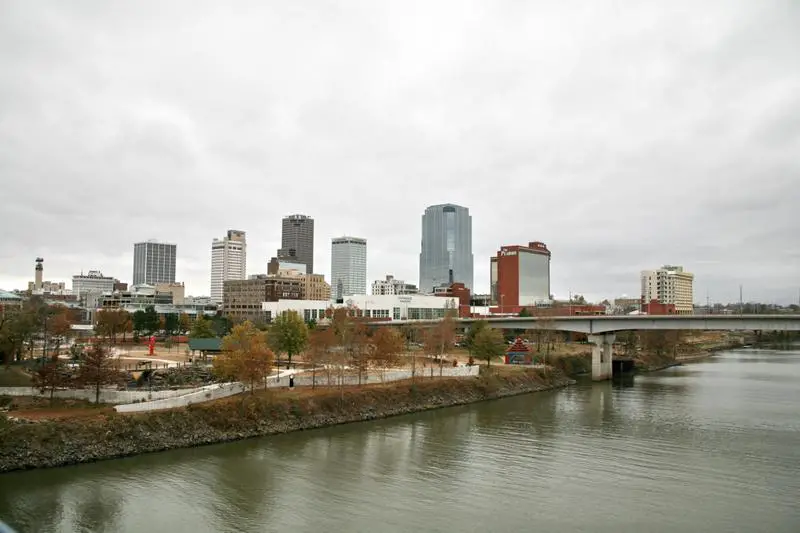
3.0% Asian · #8 most Asian in Arkansas
Little Rock is the capital and most populous city of the U.S. state of Arkansas. It is also the county seat of Pulaski County. It was incorporated on November 7, 1831, on the south bank of the Arkansas River close to the state’s geographic center. The city derives its name from a rock formation along the river, named “la petite roche” by the French explorer Jean-Baptiste Bnard de la Harpe in the 1720s. The capital of the Arkansas Territory was moved to Little Rock from Arkansas Post in 1821. The city’s population was 193,524 at the 2010 census. The six county Little Rock-North Little Rock-Conway, AR Metropolitan Statistical Area is ranked 75th in terms of population in the United States with 724,385 residents according to the 2013 estimate by the United States Census Bureau.
Data | Crime | Cost of living | Movers
2.7% Asian · #9 most Asian in Arkansas
Rogers is a city in Benton County, Arkansas, United States. As of the 2010 census, the city has a population of 55,964 making it the state’s-eighth largest city. Rogers is located in the northwest portion of the state in the Fayetteville-Springdale-Rogers Metropolitan Area, which is one of the fastest growing areas in the nation and is ranked 109th in terms of population in the United States with 465,776 in 2010 according to the United States Census Bureau.
Data | Crime | Cost of living | Movers
2.6% Asian · #10 most Asian in Arkansas
Van Buren is the second largest city in the Fort Smith, Arkansas-Oklahoma Metropolitan Statistical Area and the county seat of Crawford County, Arkansas, United States. The city is located directly northeast of Fort Smith at the Interstate 40-Interstate 540 junction. The city was incorporated in 1845 and as of the 2010 census had a population of 22,791, ranking it as the state’s 22nd largest city, behind Searcy.
Data | Crime | Cost of living | Movers
The receipts
Compare the top ten
Pick a metric. The bars rescale. The red line is Arkansas’s statewide median.
On the map
Where Arkansas’s Asian communities live
Saturday Night Science
Methodology: How We Determined The Cities In Arkansas With The Largest Asian Population For 2026
We used Saturday Night Science to compare Census data on race across every place in Arkansas.
The Census’s most recently available data comes from the 2020-2024 American Community Survey.
Specifically, we looked at table B03002: Hispanic OR LATINO ORIGIN BY RACE. Here are the category names as defined by the Census:
- Hispanic or Latino
- White alone*
- Black or African American alone*
- American Indian and Alaska Native alone*
- Asian alone*
- Native Hawaiian and Other Pacific Islander alone*
- Some other race alone*
- Two or more races*
Our particular column of interest here was the number of people who identified as Asian alone.
We limited our analysis to cities with a population greater than 5,000 people. That left us with 59 cities.
We then calculated the percentage of residents that are Asian. The percentages ranked from 13.1% to 0.0%.
Finally, we ranked each city based on the percentage of Asian population, with a higher percentage being more Asian. Bentonville took the distinction of being the most Asian, while Alma was the least Asian city.
We updated this article for 2026. This report reflects our eleventh time ranking the cities in Arkansas with the largest Asian population.
The full plate
Cities In Arkansas By Asian Population
Click any column to sort. Search by city name.
| Rank | City | Population | Asian Population | % Asian |
|---|---|---|---|---|
| 1 | Bentonville | 58,249 | 7,655 | 13.1% |
| 2 | Clarksville | 9,526 | 599 | 6.3% |
| 3 | Centerton | 21,920 | 1,319 | 6.0% |
| 4 | Wynne | 8,120 | 474 | 5.8% |
| 5 | Fort Smith | 89,805 | 4,738 | 5.3% |
| 6 | Siloam Springs | 18,699 | 681 | 3.6% |
| 7 | Maumelle | 19,373 | 677 | 3.5% |
| 8 | Little Rock | 203,436 | 6,154 | 3.0% |
| 9 | Rogers | 72,981 | 1,983 | 2.7% |
| 10 | Van Buren | 23,763 | 610 | 2.6% |
| 11 | Fayetteville | 99,319 | 2,415 | 2.4% |
| 12 | Springdale | 88,160 | 2,119 | 2.4% |
| 13 | Bryant | 21,504 | 449 | 2.1% |
| 14 | Helena-West Helena | 8,935 | 167 | 1.9% |
| 15 | El Dorado | 17,115 | 298 | 1.7% |
| 16 | White Hall | 5,512 | 93 | 1.7% |
| 17 | Lowell | 10,849 | 181 | 1.7% |
| 18 | Jacksonville | 29,221 | 487 | 1.7% |
| 19 | Jonesboro | 80,137 | 1,294 | 1.6% |
| 20 | Greenwood | 9,616 | 155 | 1.6% |
| 21 | Conway | 67,642 | 1,060 | 1.6% |
| 22 | Sherwood | 33,070 | 490 | 1.5% |
| 23 | Monticello | 8,257 | 121 | 1.5% |
| 24 | Batesville | 11,445 | 161 | 1.4% |
| 25 | Blytheville | 12,790 | 169 | 1.3% |
| 26 | Cabot | 26,960 | 353 | 1.3% |
| 27 | Marion | 13,623 | 171 | 1.3% |
| 28 | Searcy | 23,340 | 284 | 1.2% |
| 29 | Hot Springs | 37,920 | 443 | 1.2% |
| 30 | Russellville | 29,162 | 339 | 1.2% |
| 31 | Cherokee Village | 5,046 | 45 | 0.9% |
| 32 | Pocahontas | 7,538 | 67 | 0.9% |
| 33 | Benton | 36,595 | 322 | 0.9% |
| 34 | Newport | 8,024 | 59 | 0.7% |
| 35 | North Little Rock | 64,538 | 442 | 0.7% |
| 36 | Hope | 8,671 | 57 | 0.7% |
| 37 | Camden | 10,307 | 67 | 0.7% |
| 38 | Morrilton | 7,080 | 46 | 0.6% |
| 39 | Pine Bluff | 39,743 | 256 | 0.6% |
| 40 | West Memphis | 23,929 | 146 | 0.6% |
| 41 | Arkadelphia | 10,099 | 59 | 0.6% |
| 42 | Paragould | 30,215 | 176 | 0.6% |
| 43 | Texarkana | 29,177 | 151 | 0.5% |
| 44 | Beebe | 8,707 | 37 | 0.4% |
| 45 | Farmington | 9,094 | 30 | 0.3% |
| 46 | Magnolia | 10,894 | 20 | 0.2% |
| 47 | Mountain Home | 13,108 | 24 | 0.2% |
| 48 | Forrest City | 12,646 | 23 | 0.2% |
| 49 | Berryville | 5,707 | 10 | 0.2% |
| 50 | Harrison | 13,350 | 19 | 0.1% |
| 51 | Stuttgart | 7,903 | 10 | 0.1% |
| 55 | Heber Springs | 7,161 | 0 | 0.0% |
| 55 | Warren | 5,353 | 0 | 0.0% |
| 55 | De Queen | 6,058 | 0 | 0.0% |
| 55 | Trumann | 7,410 | 0 | 0.0% |
| 55 | Mena | 5,582 | 0 | 0.0% |
| 55 | Malvern | 10,953 | 0 | 0.0% |
| 55 | Osceola | 6,688 | 0 | 0.0% |
| 55 | Alma | 5,906 | 0 | 0.0% |
Source: U.S. Census ACS 2020-2024. 59 cities with more than 5,000 residents.
Summary
Summary: Asian Populations Across Arkansas
If you’re looking for a breakdown of Asian populations across Arkansas according to the most recent data, this is an accurate list.
The most Asian cities in Arkansas are Bentonville, Clarksville, Centerton, Wynne, Fort Smith, Siloam Springs, Maumelle, Little Rock, Rogers, and Van Buren.