
Before you decide to relocate to Connecticut, it’s important to research the exact cost of living around the state. And that’s what we’re going to help you do.
These are the places in Connecticut that cost a pretty penny — the most expensive cities in the state.
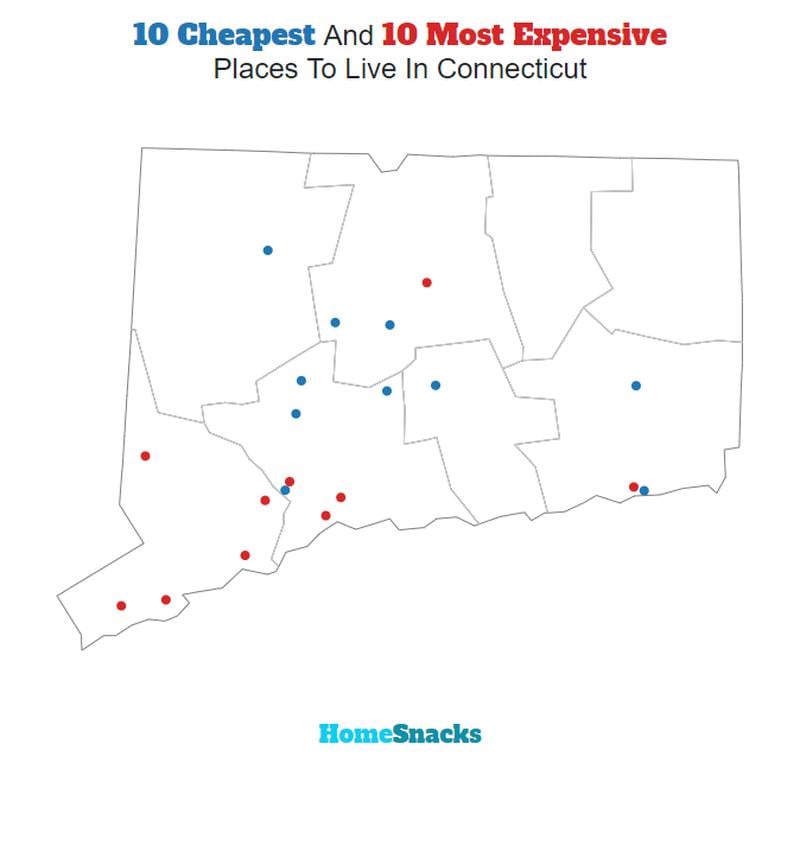
We used Saturday Night Science to compare the 2020-2024 American Community Survey on cost of living for the 55 places in Connecticut with more than 5,000 people.
After we saved up for months and could finally afford it, we landed on this list of the ten most expensive cities in Connecticut for 2026.
Table Of Contents: Top Ten | Methodology | Summary | Table
The 10 Most Expensive Places To Live In Connecticut For 2026
What’s the most expensive place to live in Connecticut? Well, HomeSnacks crunched the numbers and discovered that Old Greenwich is the most expensive place to live in Connecticut.
Willimantic (the cheapest place to live in Connecticut) can show these guys how to live on a budget in the coming years. Read on for how these places had costs rise faster than inflation.
And if you already knew these places were expensive, check out some more reading about Connecticut and the most expensive cities in the country:
The 10 Most Expensive Places To Live In Connecticut For 2026

/10
Population: 6,936
Cost Of Living Index: 289
Median Income: $250,001
Average Home Price: $2,194,167
Home Price To Income Ratio: 8.8x
More on Old Greenwich: Data | Cost Of Living | Movers
The overall cost of living in Old Greenwich is 289. The median income in Old Greenwich comes in at $250,001 and the average home value is $2,194,167 for 2026.

/10
Population: 8,954
Cost Of Living Index: 277
Median Income: $250,001
Average Home Price: $2,260,300
Home Price To Income Ratio: 9.0x
More on Riverside: Data | Cost Of Living | Movers
The overall cost of living in Riverside is 277. The median income in Riverside comes in at $250,001 and the average home value is $2,260,300 for 2026.

/10
Population: 14,792
Cost Of Living Index: 235
Median Income: $134,914
Average Home Price: $2,265,961
Home Price To Income Ratio: 16.8x
More on Greenwich: Data | Crime | Cost Of Living | Movers
The overall cost of living in Greenwich is 235. The median income in Greenwich comes in at $134,914 and the average home value is $2,265,961 for 2026.

/10
Population: 7,546
Cost Of Living Index: 217
Median Income: $190,481
Average Home Price: $1,439,703
Home Price To Income Ratio: 7.6x
More on Cos Cob: Data | Cost Of Living | Movers
The overall cost of living in Cos Cob is 217. The median income in Cos Cob comes in at $190,481 and the average home value is $1,439,703 for 2026.

/10
Population: 6,970
Cost Of Living Index: 167
Median Income: $148,279
Average Home Price: $977,266
Home Price To Income Ratio: 6.6x
More on Ridgefield: Data | Crime | Cost Of Living | Movers
The overall cost of living in Ridgefield is 167. The median income in Ridgefield comes in at $148,279 and the average home value is $977,266 for 2026.


/10
Population: 137,144
Cost Of Living Index: 158
Median Income: $111,586
Average Home Price: $704,417
Home Price To Income Ratio: 6.3x
More on Stamford: Data | Crime | Cost Of Living | Movers
The overall cost of living in Stamford is 158. The median income in Stamford comes in at $111,586 and the average home value is $704,417 for 2026.

/10
Population: 92,187
Cost Of Living Index: 143
Median Income: $107,616
Average Home Price: $653,113
Home Price To Income Ratio: 6.1x
More on Norwalk: Data | Crime | Cost Of Living | Movers
The overall cost of living in Norwalk is 143. The median income in Norwalk comes in at $107,616 and the average home value is $653,113 for 2026.

/10
Population: 14,315
Cost Of Living Index: 137
Median Income: $142,325
Average Home Price: $619,525
Home Price To Income Ratio: 4.4x
More on Orange: Data | Crime | Cost Of Living | Movers
The overall cost of living in Orange is 137. The median income in Orange comes in at $142,325 and the average home value is $619,525 for 2026.


/10
Population: 41,889
Cost Of Living Index: 129
Median Income: $108,185
Average Home Price: $549,373
Home Price To Income Ratio: 5.1x
More on Shelton: Data | Crime | Cost Of Living | Movers
The overall cost of living in Shelton is 129. The median income in Shelton comes in at $108,185 and the average home value is $549,373 for 2026.

/10
Population: 6,198
Cost Of Living Index: 128
Median Income: $138,242
Average Home Price: $491,002
Home Price To Income Ratio: 3.6x
More on Simsbury Center: Data | Cost Of Living | Movers
The overall cost of living in Simsbury Center is 128. The median income in Simsbury Center comes in at $138,242 and the average home value is $491,002 for 2026.
Methodology: How We Determined The Most Expensive Places To Live In The Constitution State For 2026
The two most important things to think about when it comes to being able to afford a city in Connecticut are:
- How much money do I make?
- How much do I have to spend to live there?
You need to understand your costs in the context of how much money you make.
For example, if the median household earns $100,000 and spends $40,000 on housing, it’s actually cheaper to live there than a place with a median income of $50,000 and housing costs of $21,000. You might spend more on housing, but you have more money overall to play with.
With that example in mind, we derived several statistics from the latest Census American Community Survey 2020-2024 around incomes and costs. They are:
- Overall Cost Of Living Index
- Median Home Price / Median Income (lower is better)
- Median Income / Median Rent (Higher is better)
- Median Home Price
You can then compare these metrics in each of the places in Connecticut to figure out which is the most expensive.
You are left with a “Cost of Living Index” by taking the average rank of each of these metrics for each city.
So we used that cost of living index to rank all of the 55 places in Connecticut that have more than 5,000 people.
The place with the highest cost of living in Connecticut according to the data is Old Greenwich. We updated this article for 2026. This article is our eleventh time ranking the most expensive places to live in Connecticut.
Summary: Taking A Chunk Out Of Your Paycheck In Connecticut For 2026
Well, there you have it, the places in Connecticut that have the highest cost of living, with Old Greenwich ranking as the most expensive city in the Constitution State.
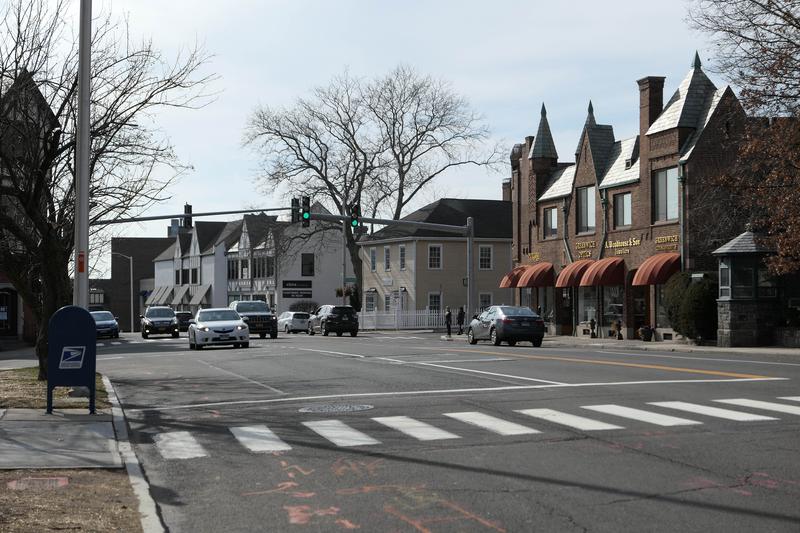
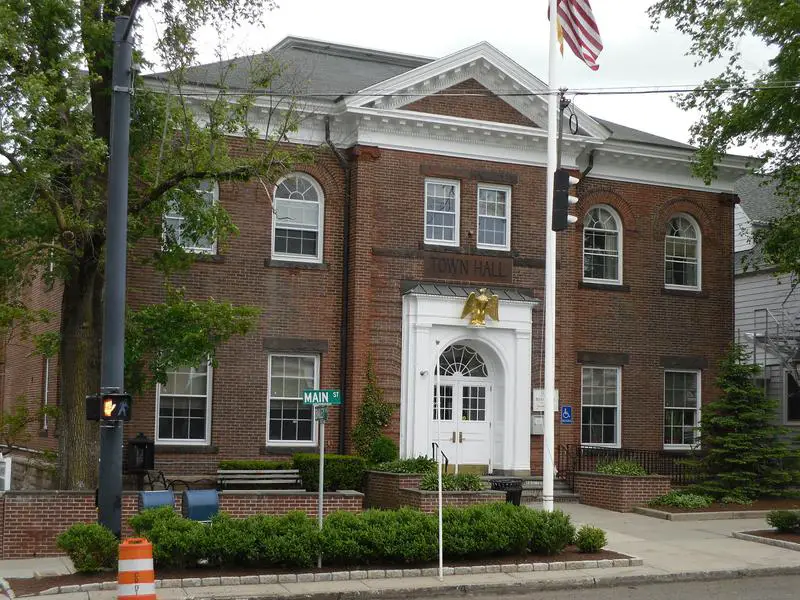
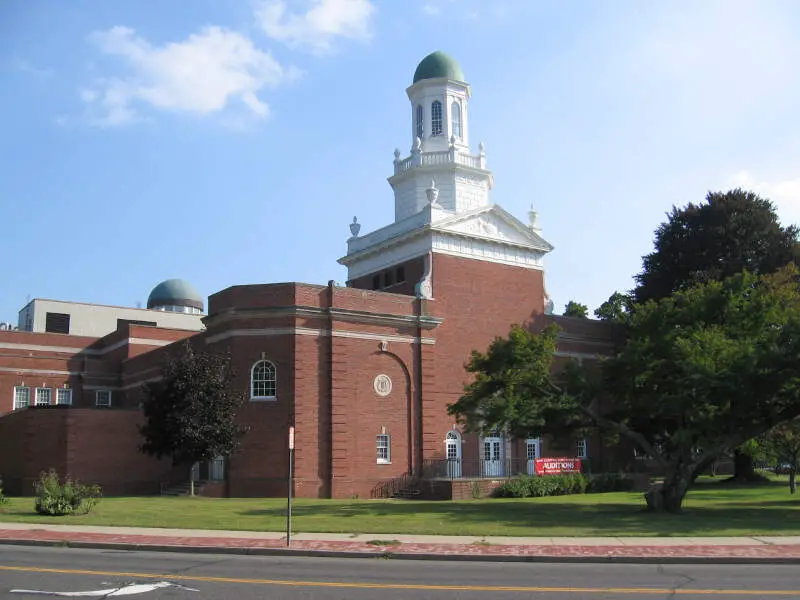
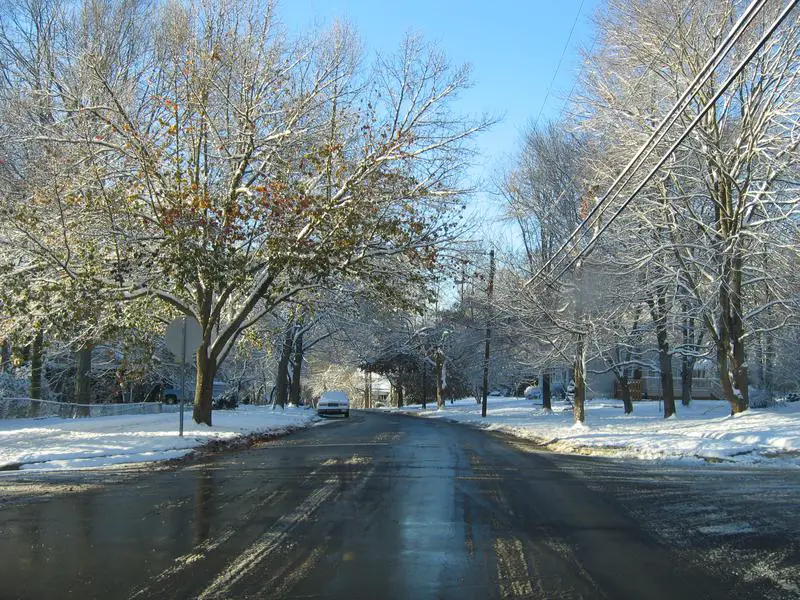
The most expensive cities in Connecticut are Old Greenwich, Riverside, Greenwich, Cos Cob, Ridgefield, Stamford, Norwalk, Orange, Shelton, and Simsbury Center.
Here’s a look at the most affordable cities in Connecticut according to the data:
- Willimantic
- Waterbury
- Rockville
For more Connecticut reading, check out:
- Best Places To Live In Connecticut
- Cheapest Places To Live In Connecticut
- Most Dangerous Cities In Connecticut
- Best Places To Raise A Family In Connecticut
- Safest Places In Connecticut
- Worst Places To Live In Connecticut
Most Expensive Cities In Connecticut
| Rank | City | Cost Of Living | Population | Median Income | Average Home Price | Home/Income Ratio |
|---|---|---|---|---|---|---|
| 1 | Old Greenwich | 289 | 6,936 | $250,001 | $2,194,167 | 8.8x |
| 2 | Riverside | 277 | 8,954 | $250,001 | $2,260,300 | 9.0x |
| 3 | Greenwich | 235 | 14,792 | $134,914 | $2,265,961 | 16.8x |
| 4 | Cos Cob | 217 | 7,546 | $190,481 | $1,439,703 | 7.6x |
| 5 | Ridgefield | 167 | 6,970 | $148,279 | $977,266 | 6.6x |
| 6 | Stamford | 158 | 137,144 | $111,586 | $704,417 | 6.3x |
| 7 | Norwalk | 143 | 92,187 | $107,616 | $653,113 | 6.1x |
| 8 | Orange | 137 | 14,315 | $142,325 | $619,525 | 4.4x |
| 9 | Shelton | 129 | 41,889 | $108,185 | $549,373 | 5.1x |
| 10 | Simsbury Center | 128 | 6,198 | $138,242 | $491,002 | 3.6x |
| 11 | West Hartford | 127 | 63,620 | $129,890 | $487,818 | 3.8x |
| 12 | Danbury | 126 | 87,263 | $83,393 | $478,978 | 5.7x |
| 13 | Bethel | 125 | 11,404 | $90,848 | $554,247 | 6.1x |
| 14 | Cheshire Village | 125 | 6,172 | $117,218 | $504,443 | 4.3x |
| 15 | North Haven | 123 | 24,336 | $132,689 | $460,565 | 3.5x |
| 16 | Glastonbury Center | 121 | 7,266 | $107,357 | $444,019 | 4.1x |
| 17 | Branford Center | 120 | 6,305 | $74,150 | $393,230 | 5.3x |
| 18 | Southwood Acres | 119 | 8,115 | $110,286 | $318,652 | 2.9x |
| 19 | Sherwood Manor | 119 | 5,706 | $90,821 | $303,665 | 3.3x |
| 20 | New Milford | 118 | 8,188 | $83,235 | $460,615 | 5.5x |
| 21 | Kensington | 117 | 9,962 | $109,447 | $392,992 | 3.6x |
| 22 | Storrs | 116 | 15,207 | $37,839 | $386,688 | 10.2x |
| 23 | Pawcatuck | 116 | 5,577 | $80,114 | $428,913 | 5.4x |
| 24 | Wallingford Center | 115 | 18,208 | $89,959 | $379,670 | 4.2x |
| 25 | New Haven | 114 | 134,349 | $56,851 | $326,440 | 5.7x |
| 26 | Wethersfield | 114 | 27,250 | $126,806 | $424,098 | 3.3x |
| 27 | Thompsonville | 114 | 7,927 | $71,805 | $287,369 | 4.0x |
| 28 | Windsor Locks | 113 | 12,579 | $81,205 | $327,844 | 4.0x |
| 29 | Oakville | 113 | 9,276 | $95,515 | $333,639 | 3.5x |
| 30 | East Haven | 112 | 27,806 | $94,628 | $353,435 | 3.7x |
| 31 | Hazardville | 112 | 6,022 | $81,893 | $288,915 | 3.5x |
| 32 | Portland | 112 | 5,944 | $89,401 | $402,704 | 4.5x |
| 33 | Bridgeport | 111 | 149,153 | $58,685 | $355,126 | 6.1x |
| 34 | West Haven | 111 | 55,351 | $74,382 | $354,725 | 4.8x |
| 35 | Middletown | 111 | 47,958 | $79,438 | $354,794 | 4.5x |
| 36 | Derby | 111 | 12,487 | $79,500 | $336,764 | 4.2x |
| 37 | Bristol | 110 | 61,462 | $79,076 | $339,023 | 4.3x |
| 38 | Newington | 110 | 30,896 | $102,884 | $369,180 | 3.6x |
| 39 | Groton | 110 | 9,490 | $79,577 | $425,383 | 5.3x |
| 40 | New London | 109 | 27,625 | $59,098 | $312,695 | 5.3x |
| 41 | Ansonia | 109 | 19,033 | $85,877 | $374,885 | 4.4x |
| 42 | Terryville | 109 | 5,461 | $72,813 | $289,986 | 4.0x |
| 43 | Meriden | 108 | 60,545 | $71,253 | $315,833 | 4.4x |
| 44 | Naugatuck | 107 | 31,800 | $96,324 | $346,061 | 3.6x |
| 45 | East Hartford | 106 | 50,918 | $70,778 | $300,291 | 4.2x |
| 46 | Norwich | 106 | 39,973 | $65,024 | $293,051 | 4.5x |
| 47 | Hartford | 104 | 121,127 | $46,411 | $198,964 | 4.3x |
| 48 | New Britain | 104 | 74,223 | $58,613 | $298,511 | 5.1x |
| 49 | Manchester | 104 | 36,759 | $74,267 | $323,532 | 4.4x |
| 50 | Winsted | 104 | 6,977 | $64,871 | $272,292 | 4.2x |
| 51 | Putnam | 103 | 7,120 | $65,511 | $343,176 | 5.2x |
| 52 | Torrington | 102 | 35,547 | $70,856 | $295,023 | 4.2x |
| 53 | Rockville | 102 | 7,072 | $51,232 | $260,131 | 5.1x |
| 54 | Waterbury | 101 | 114,869 | $51,886 | $276,344 | 5.3x |
| 55 | Willimantic | 101 | 18,096 | $45,962 | $266,599 | 5.8x |