Before you decide to relocate to Kentucky, it’s important to research the exact cost of living around the state. And that’s what we’re going to help you do.
These are the places in Kentucky that cost a pretty penny — the most expensive cities in the state.
We used Saturday Night Science to compare the 2020-2024 American Community Survey on cost of living for the 78 places in Kentucky with more than 5,000 people.
After we saved up for months and could finally afford it, we landed on this list of the ten most expensive cities in Kentucky for 2026.
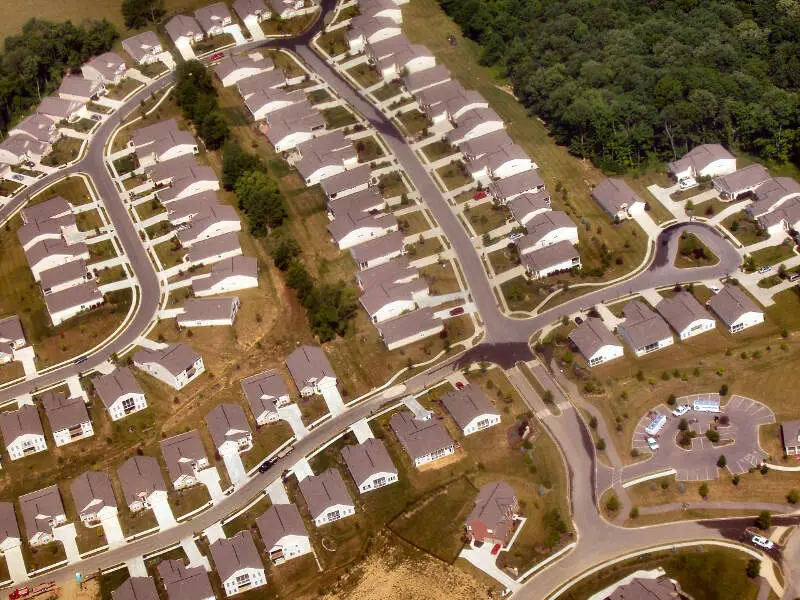
$136,712 median income · $449,093 median home · #2 home prices in Kentucky
Union is a home rule-class city in Boone County, Kentucky, United States. The population was 5,379 as of the 2010 United States Census. The area was rural until mass residential growth in the 1990s and 2000s.
Data | Crime | Cost of living | Movers
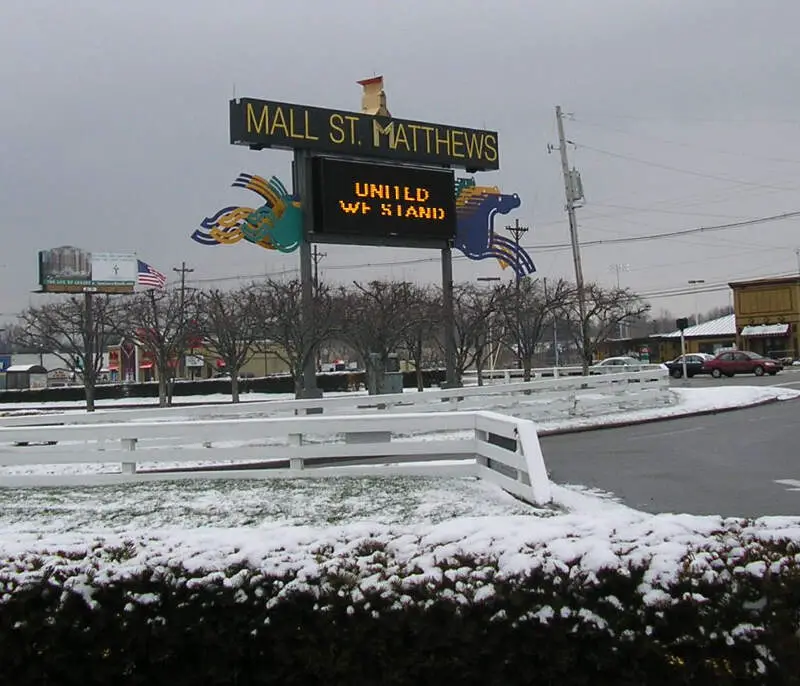
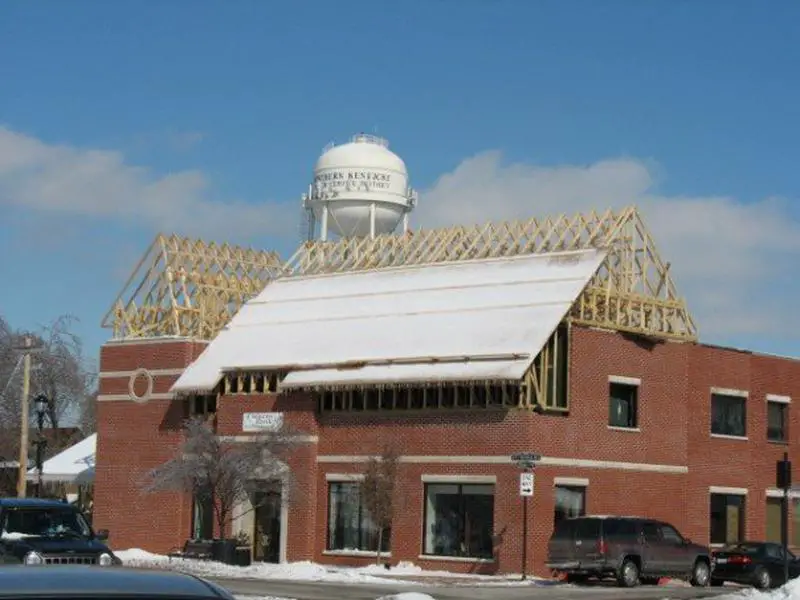
$82,412 median income · $381,227 median home · #7 home prices in Kentucky
St. Matthews is a city in Jefferson County, Kentucky, United States. It forms part of the Louisville Metro government but is separately incorporated as a home rule-class city. The population was 15,852 at the 2000 census, making it the 20th-largest city in the state.
Data | Crime | Cost of living | Movers
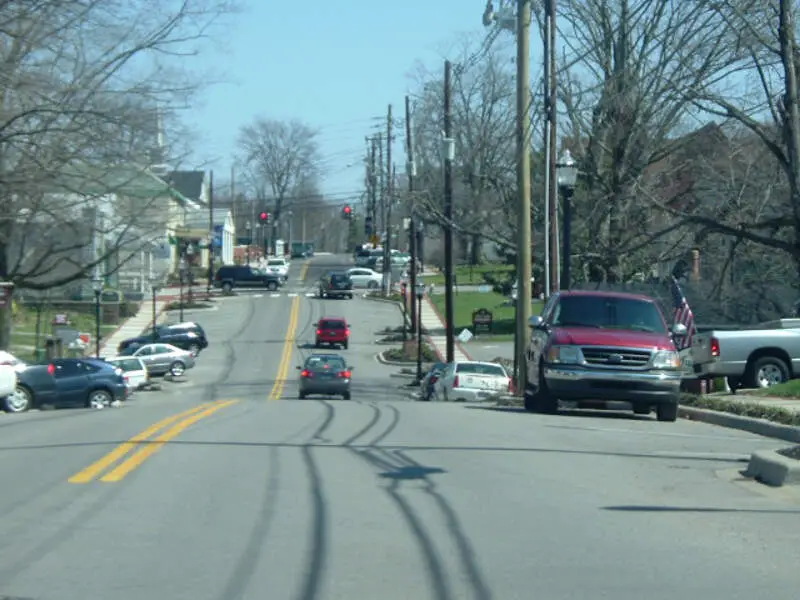
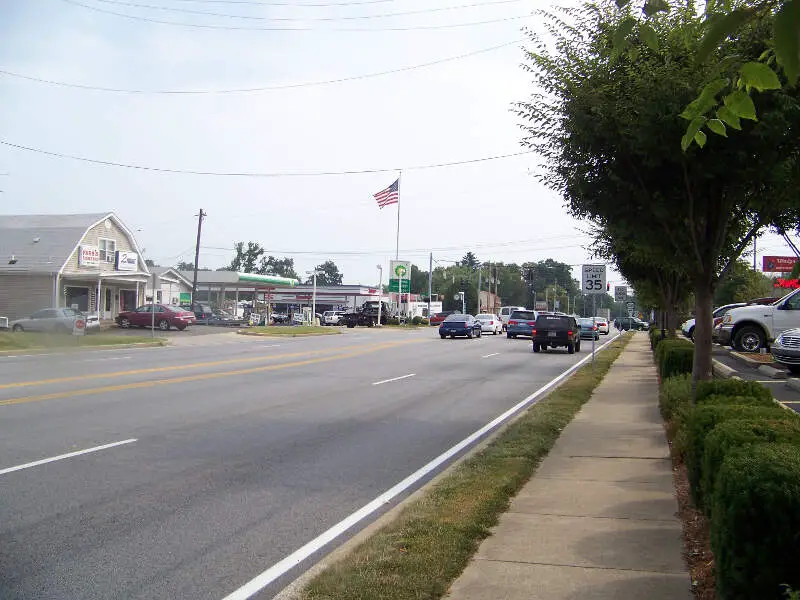
$82,537 median income · $378,971 median home · #8 home prices in Kentucky
Middletown is an independent, home rule-class city in Jefferson County, Kentucky, United States, and a former neighborhood of Louisville. The population was 7,218 at the 2010 census.
Data | Crime | Cost of living | Movers
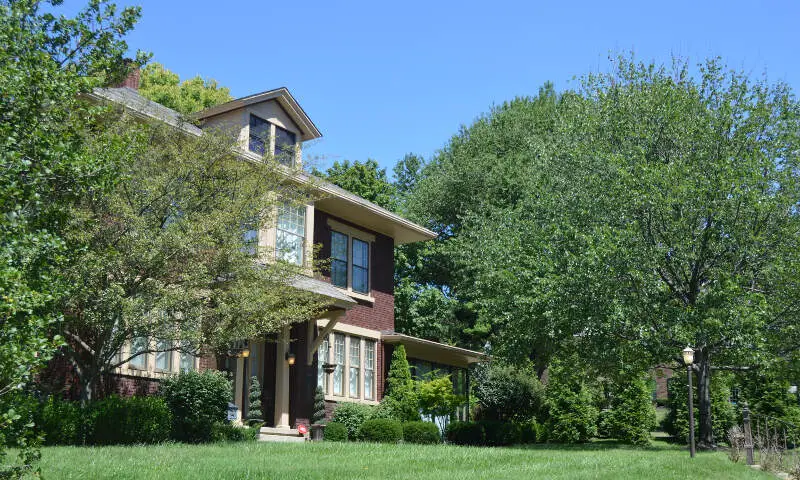
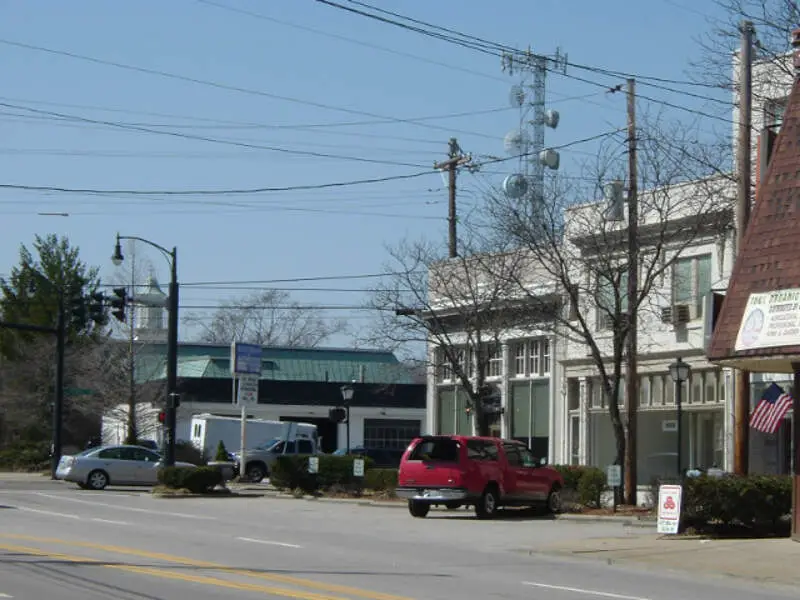
$86,310 median income · $398,735 median home · #3 home prices in Kentucky
Fort Mitchell is a home rule-class city in Kenton County, Kentucky, in the United States. The population was 8,207 at the 2010 census.
Data | Crime | Cost of living | Movers
$108,046 median income · $481,032 median home · #1 home prices in Kentucky
Data | Crime | Cost of living | Movers
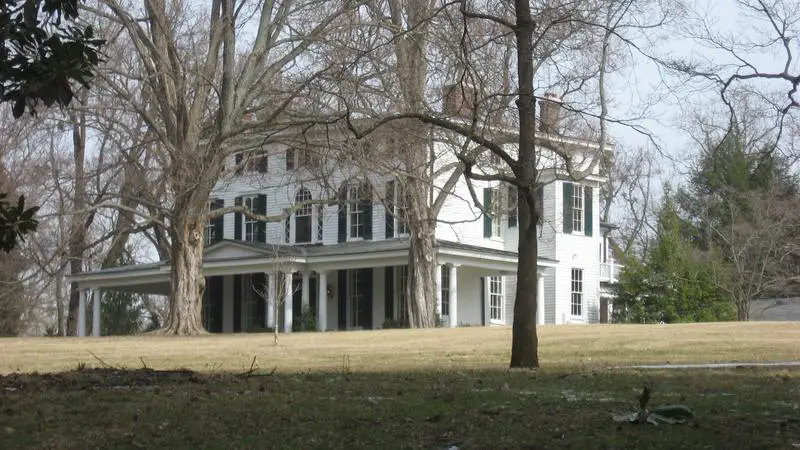
$78,482 median income · $390,589 median home · #6 home prices in Kentucky
Douglass Hills is a home rule-class city in eastern Jefferson County, Kentucky, United States. The population was 5,718 at the 2000 census.
Data | Crime | Cost of living | Movers
$104,350 median income · $368,293 median home · #9 home prices in Kentucky
Fort Thomas is a home rule-class city in Campbell County, Kentucky, United States, on the southern bank of the Ohio River and the site of an 1890 US Army post. The population was 16,325 at the 2010 census, making it the largest city in Campbell County and it is officially part of the Cincinnati – Northern Kentucky metropolitan area.
Data | Crime | Cost of living | Movers
$65,679 median income · $312,200 median home · #19 home prices in Kentucky
Lyndon is a home rule-class city in Jefferson County, Kentucky, United States. The population was 9,369 at the 2000 U.S. census.
Data | Crime | Cost of living | Movers
$81,506 median income · $282,762 median home · #27 home prices in Kentucky
Jeffersontown is a home rule-class city in Jefferson County, Kentucky, United States. The population was 26,595 at the 2010 U.S. census.
Data | Crime | Cost of living | Movers
$119,028 median income · $361,115 median home · #10 home prices in Kentucky
Data | Crime | Cost of living | Movers
The receipts
Compare the top ten
Pick a metric. The bars rescale. The red line is Kentucky’s statewide median.
Kentucky statewide median: $231,894
Kentucky statewide median: $63,726
On the map
Mapping the most expensive places in Kentucky
Saturday Night Science
Methodology: How We Determined The Most Expensive Places To Live In The Bluegrass State For 2026
The two most important things to think about when it comes to being able to afford a city in Kentucky are how much money you make and how much you have to spend to live there.
You need to understand your costs in the context of how much money you make.
For example, if the median household earns $100,000 and spends $40,000 on housing, it’s actually cheaper to live there than a place with a median income of $50,000 and housing costs of $21,000. You might spend more on housing, but you have more money overall to play with.
With that example in mind, we derived several statistics from the latest Census American Community Survey 2020-2024 around incomes and costs. They are:
- Overall Cost Of Living Index
- Median Home Price / Median Income (lower is better)
- Median Income / Median Rent (Higher is better)
- Median Home Price
You can then compare these metrics in each of the places in Kentucky to figure out which is the most expensive.
You are left with a “Cost of Living Index” by taking the average rank of each of these metrics for each city.
So we used that cost of living index to rank all of the 78 places in Kentucky that have more than 5,000 people.
The place with the highest cost of living in Kentucky according to the data is Union. We updated this article for 2026. This article is our eleventh time ranking the most expensive places to live in Kentucky. The median Kentucky home is 43 years old — old enough that it pays to compare home warranty plans before something expensive breaks.
The full plate
Most Expensive Cities In Kentucky
Click any column to sort. Search by city name.
| Rank | City | Cost Of Living | Population | Median Income | Average Home Price | Home/Income Ratio |
|---|---|---|---|---|---|---|
| 1 | Union | 116 | 7,642 | $136,712 | $449,093 | 3.3x |
| 2 | St. Matthews | 108 | 17,577 | $82,412 | $381,227 | 4.6x |
| 3 | Middletown | 108 | 9,763 | $82,537 | $378,971 | 4.6x |
| 4 | Fort Mitchell | 107 | 8,713 | $86,310 | $398,735 | 4.6x |
| 5 | Crestwood | 107 | 6,356 | $108,046 | $481,032 | 4.5x |
| 6 | Douglass Hills | 107 | 5,474 | $78,482 | $390,589 | 5.0x |
| 7 | Fort Thomas | 103 | 17,169 | $104,350 | $368,293 | 3.5x |
| 8 | Lyndon | 103 | 11,030 | $65,679 | $312,200 | 4.8x |
| 9 | Jeffersontown | 101 | 29,199 | $81,506 | $282,762 | 3.5x |
| 10 | Edgewood | 101 | 8,447 | $119,028 | $361,115 | 3.0x |
| 11 | Fort Wright | 100 | 5,887 | $105,024 | $334,172 | 3.2x |
| 12 | Shelbyville | 99 | 17,668 | $75,610 | $305,922 | 4.0x |
| 13 | Villa Hills | 99 | 7,480 | $107,859 | $393,017 | 3.6x |
| 14 | Vine Grove | 99 | 6,830 | $72,560 | $269,116 | 3.7x |
| 15 | Cold Spring | 99 | 6,341 | $75,000 | $302,336 | 4.0x |
| 16 | Alexandria | 98 | 10,562 | $102,239 | $338,680 | 3.3x |
| 17 | Georgetown | 97 | 39,117 | $80,088 | $336,540 | 4.2x |
| 18 | Mount Washington | 97 | 18,480 | $96,239 | $325,406 | 3.4x |
| 19 | La Grange | 97 | 10,311 | $88,464 | $392,372 | 4.4x |
| 20 | Pikeville | 97 | 7,490 | $39,955 | $123,118 | 3.1x |
| 21 | Independence | 96 | 29,392 | $102,361 | $323,031 | 3.2x |
| 22 | Walton | 96 | 5,730 | $77,917 | $349,337 | 4.5x |
| 23 | Bowling Green | 95 | 75,388 | $48,873 | $288,241 | 5.9x |
| 24 | Wilmore | 95 | 6,057 | $77,665 | $311,534 | 4.0x |
| 25 | Hillview | 94 | 8,797 | $68,111 | $224,675 | 3.3x |
| 26 | Taylor Mill | 94 | 6,937 | $88,546 | $276,590 | 3.1x |
| 27 | Florence | 93 | 32,803 | $71,003 | $286,328 | 4.0x |
| 28 | Elizabethtown | 93 | 32,576 | $60,760 | $268,313 | 4.4x |
| 29 | Versailles | 93 | 10,492 | $62,368 | $348,651 | 5.6x |
| 30 | Morehead | 93 | 6,870 | $36,741 | $179,844 | 4.9x |
| 31 | Erlanger | 92 | 19,875 | $75,840 | $245,646 | 3.2x |
| 32 | Murray | 92 | 18,080 | $44,091 | $198,098 | 4.5x |
| 33 | Berea | 92 | 15,786 | $59,495 | $247,721 | 4.2x |
| 34 | Shepherdsville | 92 | 14,533 | $71,476 | $285,270 | 4.0x |
| 35 | Lawrenceburg | 92 | 11,943 | $66,486 | $261,326 | 3.9x |
| 36 | Elsmere | 92 | 9,205 | $60,503 | $222,955 | 3.7x |
| 37 | Oak Grove | 92 | 7,962 | $49,354 | $210,939 | 4.3x |
| 38 | Bellevue | 92 | 5,636 | $71,166 | $245,119 | 3.4x |
| 39 | Richmond | 91 | 37,111 | $50,870 | $297,033 | 5.8x |
| 40 | Nicholasville | 91 | 32,197 | $68,503 | $320,269 | 4.7x |
| 41 | Frankfort | 91 | 28,503 | $53,073 | $240,679 | 4.5x |
| 42 | Danville | 91 | 17,327 | $52,646 | $247,085 | 4.7x |
| 43 | Bardstown | 91 | 13,804 | $51,381 | $262,584 | 5.1x |
| 44 | Winchester | 90 | 19,213 | $54,378 | $256,849 | 4.7x |
| 45 | Newport | 90 | 13,967 | $60,853 | $242,641 | 4.0x |
| 46 | Campbellsville | 90 | 11,622 | $49,644 | $209,817 | 4.2x |
| 47 | Mount Sterling | 90 | 7,551 | $55,827 | $218,631 | 3.9x |
| 48 | Dayton | 90 | 5,743 | $65,992 | $200,111 | 3.0x |
| 49 | Owensboro | 89 | 60,302 | $56,357 | $209,852 | 3.7x |
| 50 | Paducah | 89 | 26,845 | $49,915 | $191,091 | 3.8x |
| 51 | Madisonville | 89 | 19,515 | $53,860 | $159,338 | 3.0x |
| 52 | Franklin | 89 | 10,360 | $59,052 | $247,589 | 4.2x |
| 53 | Paris | 89 | 10,160 | $55,839 | $256,361 | 4.6x |
| 54 | Maysville | 89 | 8,737 | $39,013 | $157,413 | 4.0x |
| 55 | London | 89 | 7,561 | $47,591 | $182,770 | 3.8x |
| 56 | Hazard | 89 | 5,008 | $51,016 | $102,374 | 2.0x |
| 57 | Covington | 88 | 41,110 | $61,166 | $221,429 | 3.6x |
| 58 | Radcliff | 88 | 22,864 | $58,559 | $209,910 | 3.6x |
| 59 | Corbin | 88 | 8,246 | $51,065 | $176,478 | 3.5x |
| 60 | Flatwoods | 88 | 7,269 | $59,972 | $142,236 | 2.4x |
| 61 | Hopkinsville | 87 | 30,906 | $49,139 | $195,680 | 4.0x |
| 62 | Henderson | 87 | 27,852 | $48,186 | $198,772 | 4.1x |
| 63 | Ashland | 87 | 21,295 | $52,715 | $121,324 | 2.3x |
| 64 | Shively | 87 | 15,638 | $50,221 | $174,485 | 3.5x |
| 65 | Glasgow | 87 | 15,197 | $43,074 | $214,446 | 5.0x |
| 66 | Harrodsburg | 87 | 9,313 | $48,381 | $237,089 | 4.9x |
| 67 | Highland Heights | 87 | 6,444 | $53,275 | $205,650 | 3.9x |
| 68 | Mayfield | 86 | 9,868 | $40,965 | $158,700 | 3.9x |
| 69 | Russellville | 86 | 7,316 | $45,484 | $187,675 | 4.1x |
| 70 | Cynthiana | 86 | 6,458 | $54,647 | $236,040 | 4.3x |
| 71 | Lebanon | 86 | 6,430 | $45,479 | $227,854 | 5.0x |
| 72 | Somerset | 85 | 12,216 | $34,704 | $191,314 | 5.5x |
| 73 | Leitchfield | 85 | 6,819 | $44,347 | $166,231 | 3.7x |
| 74 | Central City | 85 | 5,707 | $50,885 | $120,968 | 2.4x |
| 75 | Monticello | 84 | 5,753 | $44,952 | $158,807 | 3.5x |
| 76 | Middlesborough | 83 | 9,123 | $31,106 | $112,676 | 3.6x |
| 77 | Princeton | 82 | 6,241 | $47,411 | $146,193 | 3.1x |
| 78 | Williamsburg | 81 | 5,270 | $38,147 | $125,457 | 3.3x |
Source: U.S. Census ACS 2020-2024, Zillow research. 78 places with more than 5,000 residents.
Summary
Summary: Taking A Chunk Out Of Your Paycheck In Kentucky For 2026
Well, there you have it, the places in Kentucky that have the highest cost of living, with Union ranking as the most expensive city in the Bluegrass State.
The most expensive cities in Kentucky are Union, St. Matthews, Middletown, Fort Mitchell, Crestwood, Douglass Hills, Fort Thomas, Lyndon, Jeffersontown, and Edgewood. Not sold on Kentucky? Take the two-minute Find Your Place quiz and see which state actually fits you.
Questions and answers
Most Expensive Places In Kentucky FAQs
What is the most expensive place to live in Kentucky?
Union is the most expensive place to live in Kentucky for 2026. The median home there runs $449,093, and it posts the highest cost of living of the 78 places we scored.
What are the 10 most expensive cities in Kentucky?
The ten most expensive cities in Kentucky are Union, St. Matthews, Middletown, Fort Mitchell, Crestwood, Douglass Hills, Fort Thomas, Lyndon, Jeffersontown, and Edgewood. We ranked all 78 places with more than 5,000 residents on home prices, incomes, and an overall cost of living index.
How expensive are homes in Union?
The median home value in Union is $449,093, versus $231,894 across Kentucky as a whole. Across the ten most expensive cities, the median home runs $380,099.
What salary do you need to live in the most expensive parts of Kentucky?
The median household income in the ten most expensive Kentucky cities starts at $65,679, and in Union it is $136,712. If your paycheck is closer to the statewide median of $63,726, these places will squeeze your budget.
What is the cheapest place to live in Kentucky?
Williamsburg is the cheapest of the 78 Kentucky places we ranked on cost of living. It sits at the very bottom of the same index that put Union on top.


