Most Hispanic/Latino cities in Florida research summary. We used Saturday Night Science to analyze Florida’s most recent Census data to determine the most Hispanic/Latino cities based on the percentage of Hispanic/Latino residents.
96.4% Hispanic · #1 most Hispanic in Florida
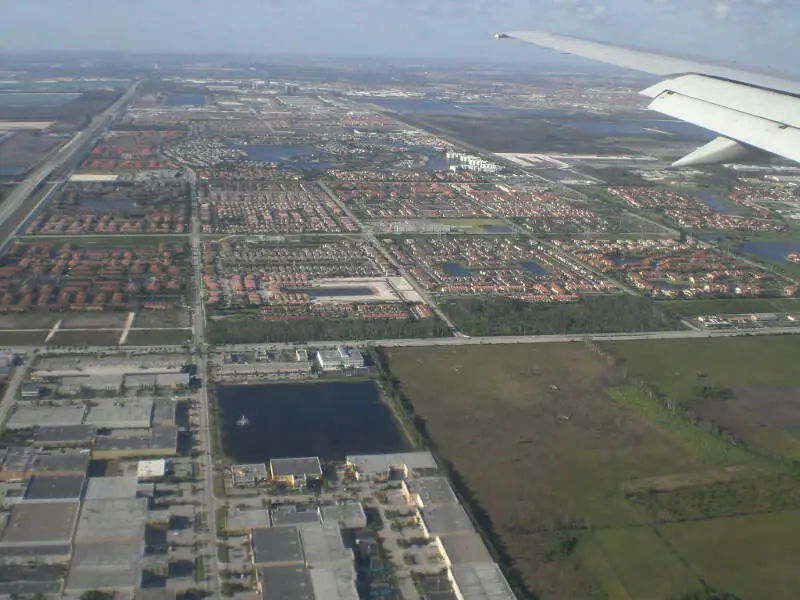
Hialeah Gardens is a city in Miami-Dade County, Florida, United States. The population was 19,297 at the 2000 census. As of 2010, the population recorded by the U.S. Census Bureau is 21,744, with a population density of 6690.1 per mi2, made up of mostly single story development.
Data | Crime | Cost of living | Movers
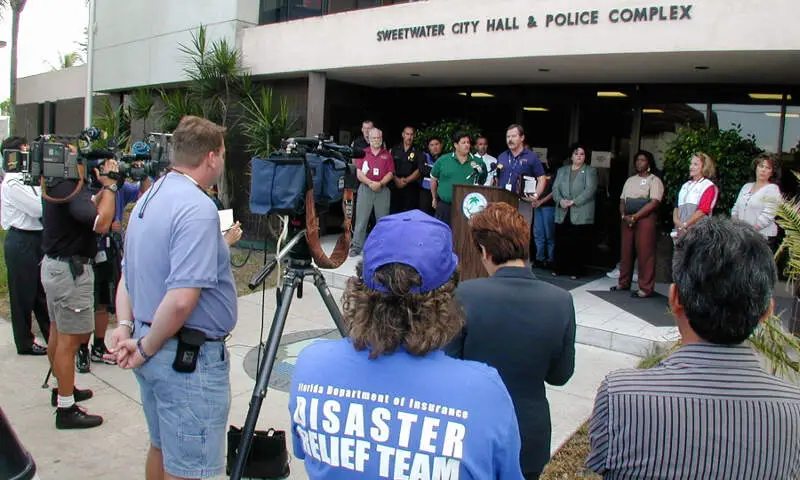
95.6% Hispanic · #2 most Hispanic in Florida
Data | Crime | Cost of living | Movers
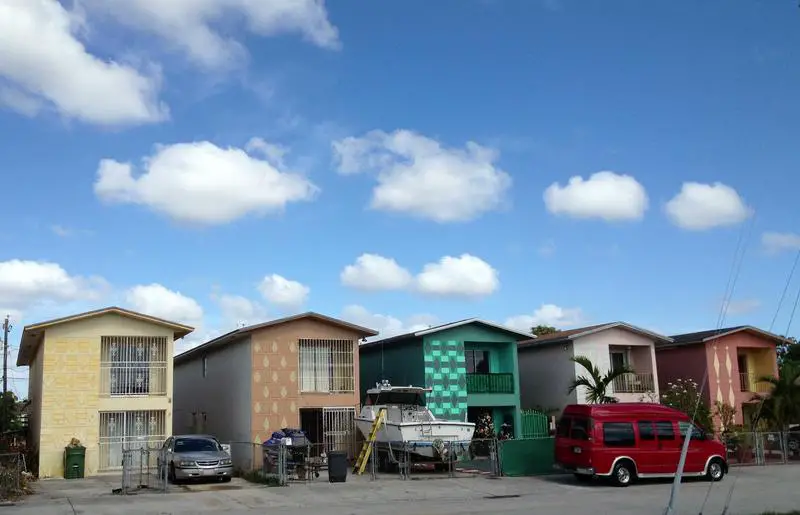
95.1% Hispanic · #3 most Hispanic in Florida
Hialeah is a city in Miami-Dade County, Florida, United States. As of the 2010 census, Hialeah has a population of 224,669. Hialeah is the sixth-largest city in the state. It is a principal city of the Miami metropolitan area, which was home to an estimated 6,012,331 people at the 2015 census. It is located west-northwest of Miami, and is the only place in the county, other than Homestead, Florida, to have its own street grid numbered separately from the rest of the county.
Data | Crime | Cost of living | Movers
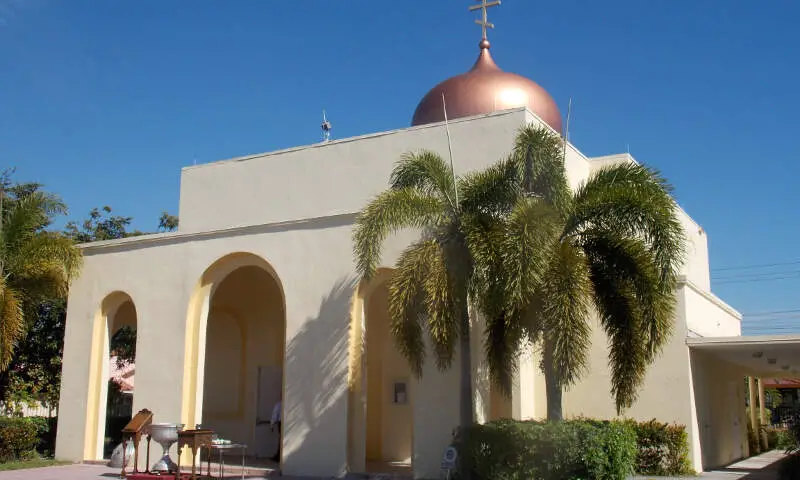
89.0% Hispanic · #4 most Hispanic in Florida
Miami Lakes is a suburb of Miami, an incorporated town and former census-designated place in Miami-Dade County, Florida, United States. As of 2015 US Census, 30,791 people live in Miami Lakes.
Data | Crime | Cost of living | Movers
86.0% Hispanic · #5 most Hispanic in Florida
West Miami is a city in Miami-Dade County, Florida, United States. The population was 5,965 at the 2010 census.
Data | Crime | Cost of living | Movers
85.5% Hispanic · #6 most Hispanic in Florida
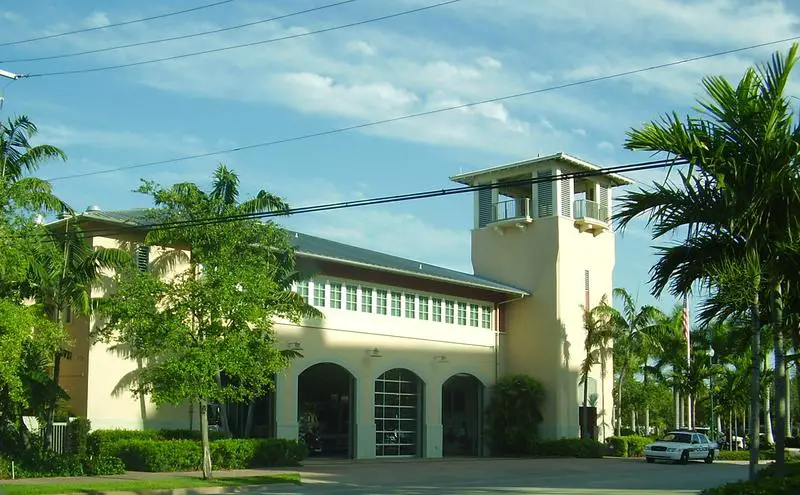
Doral is a city in Miami-Dade County, Florida, United States. One of thirty-four municipalities in the county, it is located just one mile from Miami International Airport and thirteen miles from Downtown Miami. The city regularly hosts in excess of 100,000 people who work in Miami. The City of Doral occupies a land area of 15 square miles bordered on the west by the Ronald Reagan Turnpike, to the north by the Town of Medley, to the east by the Palmetto Expressway and to the South by the City of Sweetwater.
Data | Crime | Cost of living | Movers
79.9% Hispanic · #7 most Hispanic in Florida
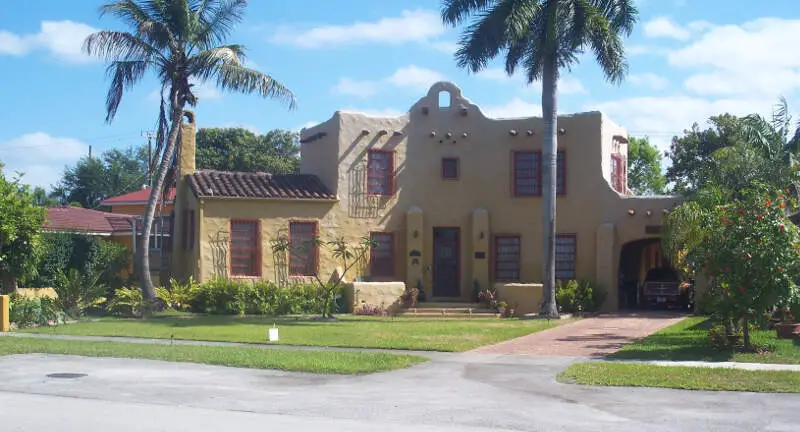
Miami Springs is a city located in Miami-Dade County, Florida. The city was founded by Glenn Hammond Curtiss, “The Father of Naval Aviation”, and James Bright, during the famous “land boom” of the 1920s and was originally named Country Club Estates. It, along with other cities in Miami-Dade County such as Coral Gables, Florida and Opa-locka, Florida, formed some of the first planned communities in the state. Like its counterparts, the city had an intended theme which in its case, was to reflect a particular architecture and ambiance.
Data | Crime | Cost of living | Movers
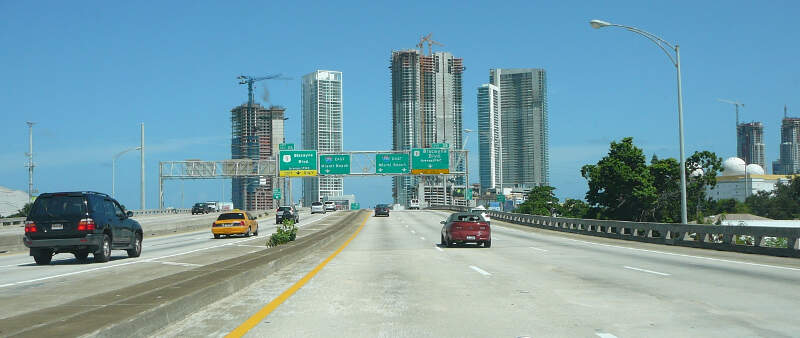
71.5% Hispanic · #8 most Hispanic in Florida
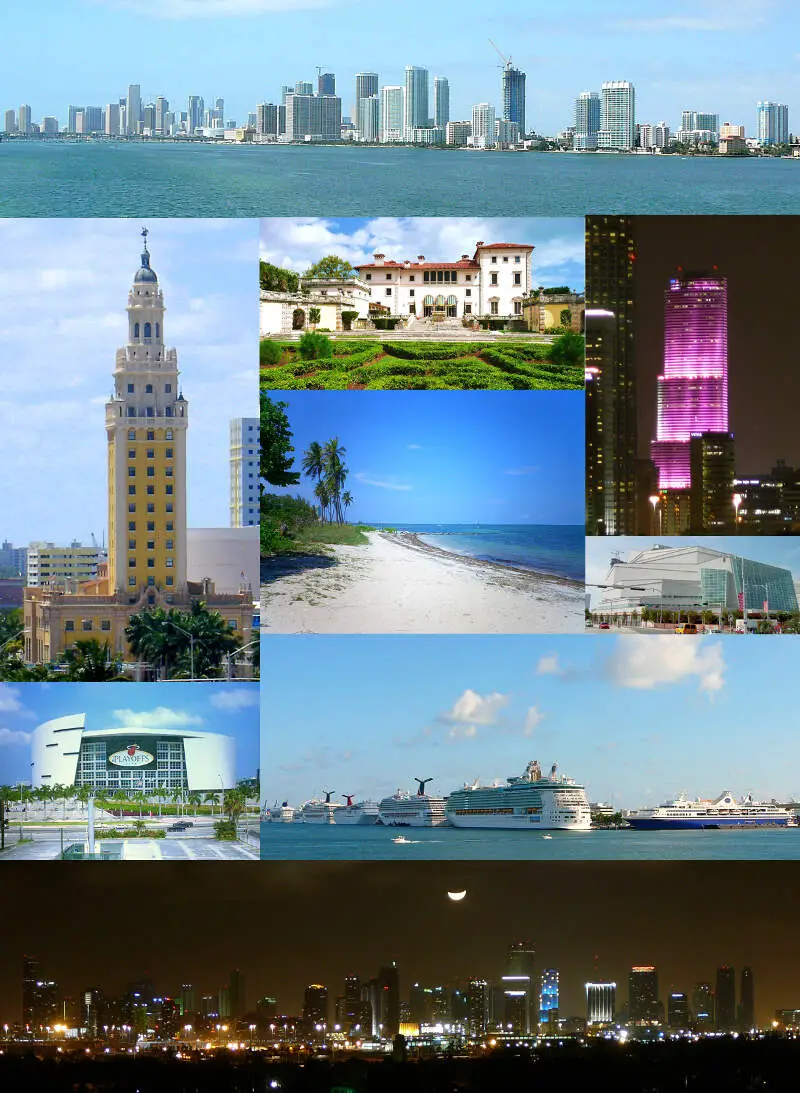
Miami is a major port city on the Atlantic coast of south Florida in the southeastern United States. As the seat of Miami-Dade County, the municipality is the principal, central, and the most populous city of the Miami metropolitan area and part of the second-most populous metropolis in the southeastern United States. According to the U.S. Census Bureau, Miami’s metro area is the eighth-most populous and fourth-largest urban area in the U.S., with a population of around 5.5 million.
Data | Crime | Cost of living | Movers
70.3% Hispanic · #9 most Hispanic in Florida
Key Biscayne is an island town in Miami-Dade County, Florida, United States. The population was 12,344 at the 2010 census.
Data | Crime | Cost of living | Movers
68.8% Hispanic · #10 most Hispanic in Florida
Kissimmee is a city in Osceola County, Florida, United States. As of the 2010 United States Census, the population was 59,682. It is the county seat of Osceola County. It is a Principal City of the Orlando-Kissimmee-Sanford, Florida, Metropolitan Statistical Area, which had a 2010 population of 2,134,411.
Data | Crime | Cost of living | Movers
The receipts
Compare the top ten
Pick a metric. The bars rescale. The red line is Florida’s statewide median.
On the map
Where Florida’s Hispanic and Latino communities live
Saturday Night Science
Methodology: How We Determined The Cities In Florida With The Largest Hispanic Population For 2026
We used Saturday Night Science to compare data on race from the US Census for every city in Florida.
Florida’s most recently available data comes from the 2020-2024 American Community Survey.
Specifically, we looked at table B03002: Hispanic OR LATINO ORIGIN BY RACE. Here are the category names as defined by the Census:
- Hispanic or Latino
- White alone*
- Black or African American alone*
- American Indian and Alaska Native alone*
- Asian alone*
- Native Hawaiian and Other Pacific Islander alone*
- Some other race alone*
- Two or more races*
Our particular column of interest here was the number of people who identified as Hispanic or Latino.
We limited our analysis to places in Florida with a population greater than 5,000 people. That left us with 208 cities.
We then calculated the percentage of Hispanic or Latino residents in each Florida city. The percentages ranked from 96.4% to 2.0%.
Finally, we ranked each city based on the percentage of the Hispanic or Latino population, with a higher percentage being more Hispanic or Latino. Hialeah Gardens was the most Hispanic or Latino, while Sanibel was the least Hispanic or Latino city.
We updated this article for 2026. This article represents our eleventh time ranking the cities in Florida with the largest Hispanic/Latino population.
The full plate
Cities In Florida By Hispanic Population
Click any column to sort. Search by city name.
| Rank | City | Population | Hispanic Population | % Hispanic |
|---|---|---|---|---|
| 1 | Hialeah Gardens | 22,915 | 22,101 | 96.4% |
| 2 | Sweetwater | 20,085 | 19,206 | 95.6% |
| 3 | Hialeah | 226,165 | 215,133 | 95.1% |
| 4 | Miami Lakes | 31,553 | 28,092 | 89.0% |
| 5 | West Miami | 7,162 | 6,162 | 86.0% |
| 6 | Doral | 79,216 | 67,753 | 85.5% |
| 7 | Miami Springs | 13,726 | 10,968 | 79.9% |
| 8 | Miami | 459,745 | 328,679 | 71.5% |
| 9 | Key Biscayne | 14,791 | 10,398 | 70.3% |
| 10 | Kissimmee | 81,479 | 56,026 | 68.8% |
| 11 | Homestead | 82,807 | 55,837 | 67.4% |
| 12 | Cutler Bay | 45,070 | 28,844 | 64.0% |
| 13 | Palm Springs | 27,356 | 16,983 | 62.1% |
| 14 | North Bay Village | 8,118 | 4,873 | 60.0% |
| 15 | Weston | 68,837 | 39,111 | 56.8% |
| 16 | Coral Gables | 49,802 | 28,212 | 56.6% |
| 17 | Florida City | 12,943 | 7,287 | 56.3% |
| 18 | Bay Harbor Islands | 5,847 | 3,282 | 56.1% |
| 19 | Opa-locka | 16,282 | 8,810 | 54.1% |
| 20 | South Miami | 12,277 | 6,602 | 53.8% |
| 21 | Miami Beach | 82,031 | 43,043 | 52.5% |
| 22 | St. Cloud | 65,130 | 33,852 | 52.0% |
| 23 | Palmetto Bay | 24,639 | 12,594 | 51.1% |
| 24 | Clewiston | 7,348 | 3,737 | 50.9% |
| 25 | Pembroke Pines | 173,194 | 86,567 | 50.0% |
| 26 | Haines City | 34,234 | 17,055 | 49.8% |
| 27 | Pinecrest | 18,462 | 8,989 | 48.7% |
| 28 | Aventura | 39,885 | 18,194 | 45.6% |
| 29 | Greenacres | 44,373 | 19,866 | 44.8% |
| 30 | West Park | 15,249 | 6,628 | 43.5% |
| 31 | Hollywood | 155,082 | 67,004 | 43.2% |
| 32 | Sunny Isles Beach | 22,437 | 9,680 | 43.1% |
| 33 | Davie | 108,346 | 45,862 | 42.3% |
| 34 | Pahokee | 5,609 | 2,323 | 41.4% |
| 35 | Arcadia | 7,707 | 3,168 | 41.1% |
| 36 | Deltona | 97,334 | 39,793 | 40.9% |
| 37 | Hallandale Beach | 41,854 | 16,960 | 40.5% |
| 38 | North Miami Beach | 43,898 | 17,548 | 40.0% |
| 39 | Southwest Ranches | 7,656 | 3,059 | 40.0% |
| 40 | Miramar | 138,600 | 54,498 | 39.3% |
| 41 | Miami Shores | 11,752 | 4,377 | 37.2% |
| 42 | Miami Gardens | 113,177 | 41,131 | 36.3% |
| 43 | Sunrise | 97,918 | 35,267 | 36.0% |
| 44 | Pembroke Park | 6,360 | 2,268 | 35.7% |
| 45 | Orlando | 319,758 | 113,128 | 35.4% |
| 46 | Dania Beach | 32,180 | 11,117 | 34.5% |
| 47 | Marathon | 9,914 | 3,395 | 34.2% |
| 48 | Okeechobee | 5,479 | 1,862 | 34.0% |
| 49 | North Miami | 60,344 | 20,464 | 33.9% |
| 50 | Plant City | 40,887 | 13,850 | 33.9% |
| 51 | Avon Park | 10,057 | 3,372 | 33.5% |
| 52 | Oakland Park | 44,682 | 14,785 | 33.1% |
| 53 | Fort Meade | 5,225 | 1,704 | 32.6% |
| 54 | Tamarac | 73,019 | 23,009 | 31.5% |
| 55 | Coral Springs | 136,103 | 42,452 | 31.2% |
| 56 | Belle Glade | 16,972 | 5,288 | 31.2% |
| 57 | Minneola | 16,598 | 5,159 | 31.1% |
| 58 | Lake Wales | 16,785 | 5,178 | 30.8% |
| 59 | Cooper City | 34,660 | 10,639 | 30.7% |
| 60 | Royal Palm Beach | 40,344 | 12,380 | 30.7% |
| 61 | Plantation | 96,293 | 29,426 | 30.6% |
| 62 | Groveland | 22,012 | 6,713 | 30.5% |
| 63 | Altamonte Springs | 46,116 | 13,966 | 30.3% |
| 64 | Apopka | 58,232 | 17,336 | 29.8% |
| 65 | Sebring | 11,382 | 3,308 | 29.1% |
| 66 | Longwood | 16,337 | 4,738 | 29.0% |
| 67 | Surfside | 5,631 | 1,630 | 28.9% |
| 68 | Wellington | 62,146 | 17,704 | 28.5% |
| 69 | Sanford | 63,730 | 18,138 | 28.5% |
| 70 | Coconut Creek | 58,330 | 16,460 | 28.2% |
| 71 | Ocoee | 49,033 | 13,715 | 28.0% |
| 72 | Casselberry | 30,135 | 8,427 | 28.0% |
| 73 | North Lauderdale | 45,234 | 12,109 | 26.8% |
| 74 | Margate | 59,198 | 15,790 | 26.7% |
| 75 | Cape Coral | 215,536 | 56,967 | 26.4% |
| 76 | Tampa | 401,618 | 105,270 | 26.2% |
| 77 | Lake Park | 9,081 | 2,299 | 25.3% |
| 78 | DeLand | 41,611 | 10,482 | 25.2% |
| 79 | Pompano Beach | 114,147 | 28,402 | 24.9% |
| 80 | Fort Myers | 95,051 | 23,546 | 24.8% |
| 81 | West Palm Beach | 122,290 | 30,096 | 24.6% |
| 82 | Winter Haven | 55,200 | 13,474 | 24.4% |
| 83 | Clermont | 46,853 | 11,428 | 24.4% |
| 84 | Port St. Lucie | 232,491 | 55,870 | 24.0% |
| 85 | Mount Dora | 17,278 | 4,097 | 23.7% |
| 86 | Palmetto | 13,588 | 3,222 | 23.7% |
| 87 | Oviedo | 40,599 | 9,510 | 23.4% |
| 88 | Deerfield Beach | 88,093 | 20,631 | 23.4% |
| 89 | Auburndale | 18,530 | 4,243 | 22.9% |
| 90 | Winter Garden | 47,872 | 10,858 | 22.7% |
| 91 | Temple Terrace | 27,275 | 6,178 | 22.7% |
| 92 | Maitland | 19,469 | 4,396 | 22.6% |
| 93 | Key West | 25,720 | 5,780 | 22.5% |
| 94 | Quincy | 7,942 | 1,781 | 22.4% |
| 95 | Lauderdale-by-the-Sea | 6,232 | 1,337 | 21.5% |
| 96 | Winter Springs | 38,951 | 8,332 | 21.4% |
| 97 | Stuart | 18,520 | 3,953 | 21.3% |
| 98 | Leesburg | 30,807 | 6,522 | 21.2% |
| 99 | Bradenton | 57,014 | 11,940 | 20.9% |
| 100 | Cocoa | 19,554 | 4,089 | 20.9% |
Source: U.S. Census ACS 2020-2024. 208 cities with more than 5,000 residents.
Summary
Summary: Hispanic or Latino Populations Across Florida
According to the most recent data, this is an accurate list if you’re looking for a breakdown of Latino populations for each place across Florida.
The most Hispanic/Latino cities in Florida are Hialeah Gardens, Sweetwater, Hialeah, Miami Lakes, West Miami, Doral, Miami Springs, Miami, Key Biscayne, and Kissimmee.


