Most Hispanic/Latino cities in Louisiana research summary. We used Saturday Night Science to analyze Louisiana’s most recent Census data to determine the most Hispanic/Latino cities based on the percentage of Hispanic/Latino residents.
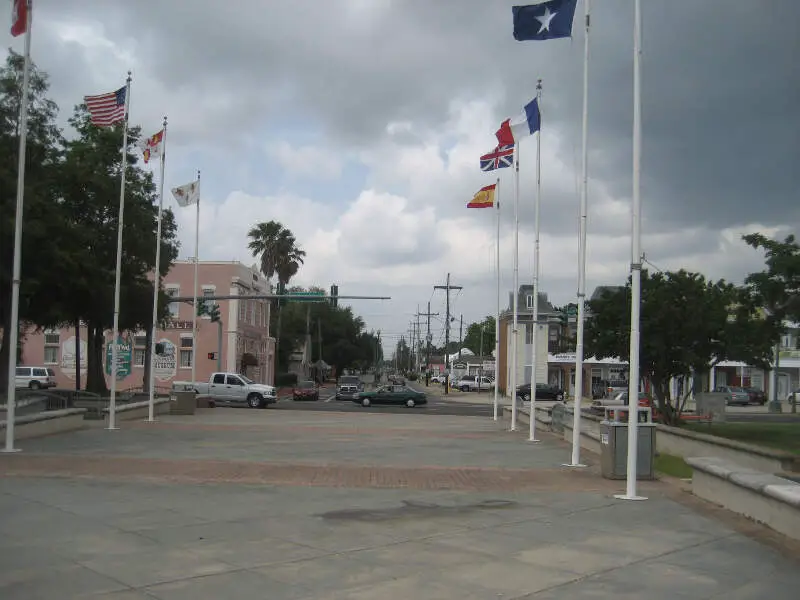
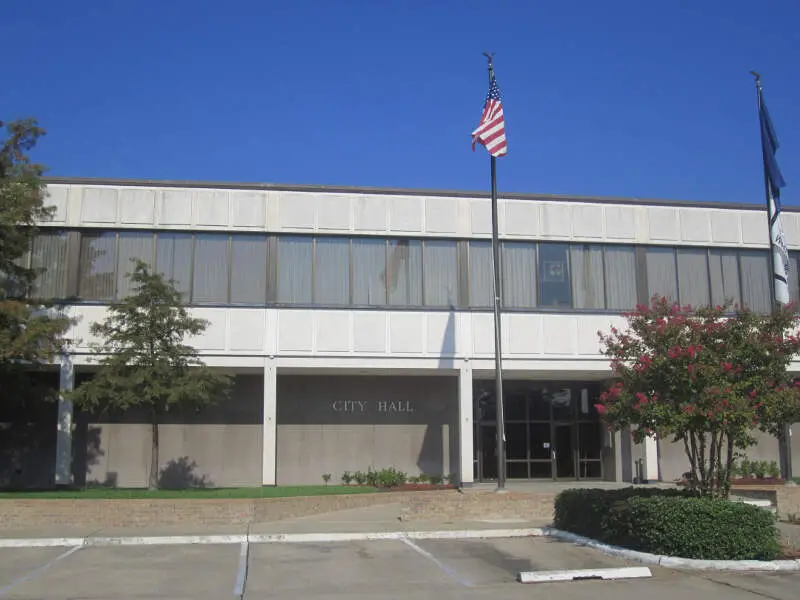
29.5% Hispanic · #1 most Hispanic in Louisiana
Kenner is the sixth-largest city in the U.S. State of Louisiana. It is the largest city in Jefferson Parish, United States, Louisiana’s second-most populous parish, and a suburb of New Orleans. The population was 66,702 at the 2010 census.
Data | Crime | Cost of living | Movers
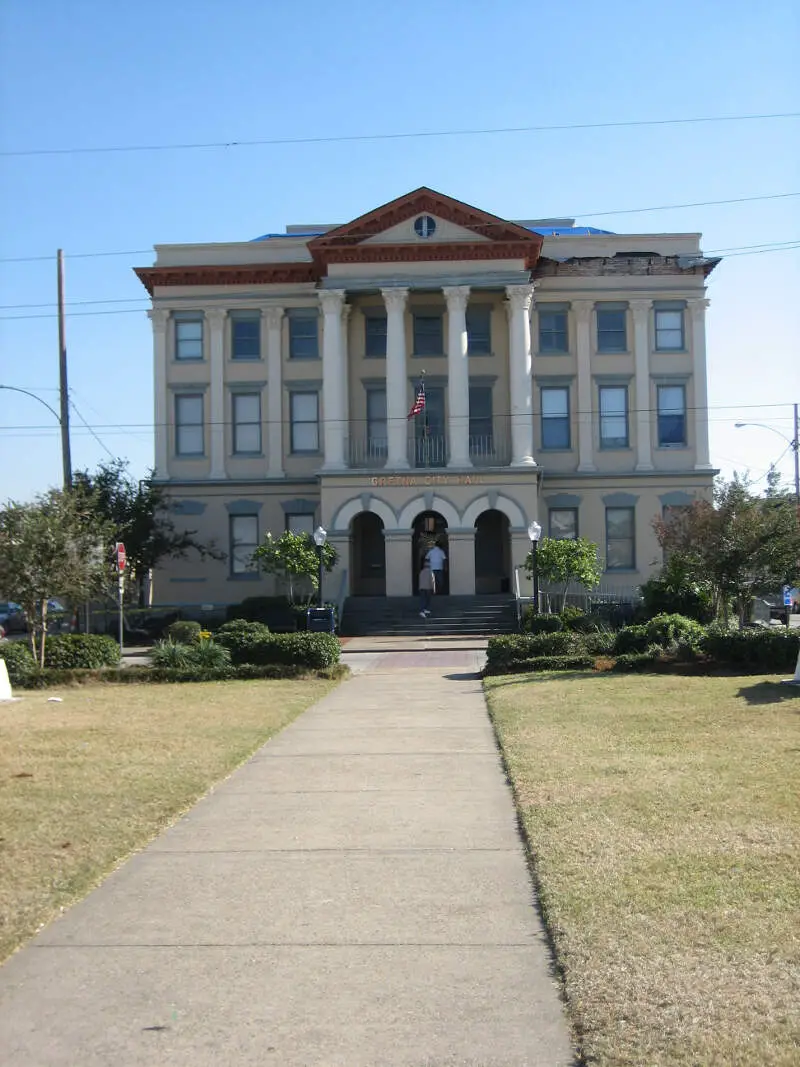
24.5% Hispanic · #2 most Hispanic in Louisiana
Gretna is the second-largest city and parish seat of Jefferson Parish, Louisiana, United States. Gretna is on the west bank of the Mississippi River, just east and across the river from uptown New Orleans. It is part of the New Orleans-Metairie-Kenner Metropolitan Statistical Area. The population was 17,736 at the 2010 census.
Data | Crime | Cost of living | Movers
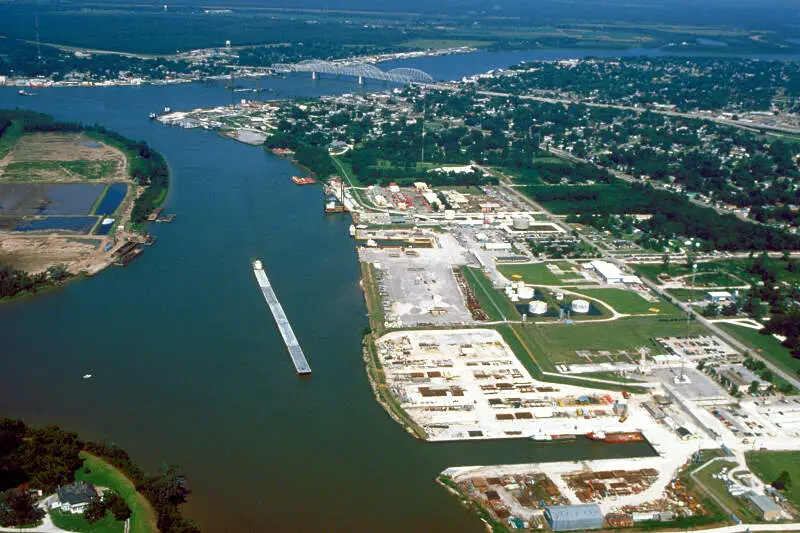
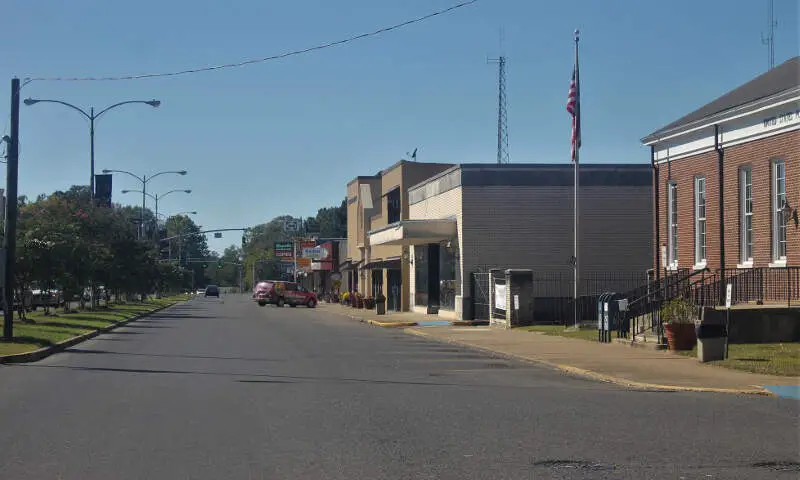
19.2% Hispanic · #3 most Hispanic in Louisiana
Data | Crime | Cost of living | Movers
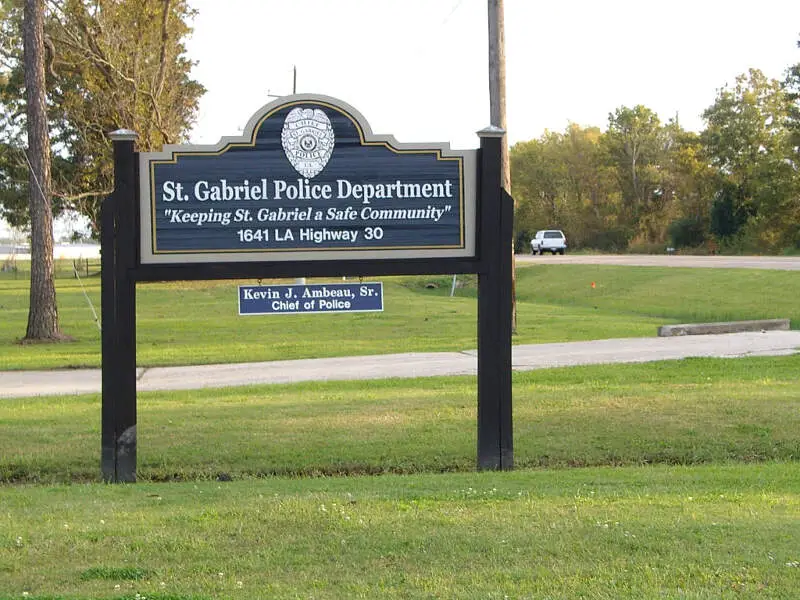
14.7% Hispanic · #4 most Hispanic in Louisiana
St. Gabriel is a city in Iberville Parish, Louisiana, United States. The population was 6,677 at the 2010 census. The city of St. Gabriel includes the areas of Sunshine and Carville. It is part of the Baton Rouge Metropolitan Statistical Area.
Data | Crime | Cost of living | Movers
14.6% Hispanic · #5 most Hispanic in Louisiana
Data | Crime | Cost of living | Movers
12.7% Hispanic · #6 most Hispanic in Louisiana
Bossier City is a city in Bossier Parish, Louisiana, United States.
Data | Crime | Cost of living | Movers
12.4% Hispanic · #7 most Hispanic in Louisiana
Denham Springs is a city in Livingston Parish, Louisiana, United States. The 2010 census placed the population at 10,215, up from 8,757 at the 2000 census. The city is the largest area of commercial and residential development in Livingston Parish. As of the 2010 census, Denham Springs and Walker are the only parish municipalities classified as cities.
Data | Crime | Cost of living | Movers
11.9% Hispanic · #8 most Hispanic in Louisiana
Gonzales is a small city in Ascension Parish, Louisiana, United States. As of the 2010 census, it had a population of 9,781. Known as the “Jambalaya Capital of the World”, it is famous for its annual Jambalaya Festival, which was first held in 1968. Stephen “Steve” F. Juneau came up with the idea for the Jambalaya Festival and served as the first president of the Jambalaya Festival Association President.
Data | Crime | Cost of living | Movers
10.2% Hispanic · #9 most Hispanic in Louisiana
Data | Crime | Cost of living | Movers
9.8% Hispanic · #10 most Hispanic in Louisiana
Slidell is the largest city situated on the northeast shore of Lake Pontchartrain and St. Tammany Parish, Louisiana, United States. The population was 27,068 at the 2010 census. Greater Slidell has a population of about 90,000. It is part of the New OrleansMetairieKenner Metropolitan Statistical Area.
Data | Crime | Cost of living | Movers
The receipts
Compare the top ten
Pick a metric. The bars rescale. The red line is Louisiana’s statewide median.
On the map
Where Louisiana’s Hispanic and Latino communities live
Saturday Night Science
Methodology: How We Determined The Cities In Louisiana With The Largest Hispanic Population For 2026
We used Saturday Night Science to compare data on race from the US Census for every city in Louisiana.
Louisiana’s most recently available data comes from the 2020-2024 American Community Survey.
Specifically, we looked at table B03002: Hispanic OR LATINO ORIGIN BY RACE. Here are the category names as defined by the Census:
- Hispanic or Latino
- White alone*
- Black or African American alone*
- American Indian and Alaska Native alone*
- Asian alone*
- Native Hawaiian and Other Pacific Islander alone*
- Some other race alone*
- Two or more races*
Our particular column of interest here was the number of people who identified as Hispanic or Latino.
We limited our analysis to places in Louisiana with a population greater than 5,000 people. That left us with 57 cities.
We then calculated the percentage of Hispanic or Latino residents in each Louisiana city. The percentages ranked from 29.5% to 0.4%.
Finally, we ranked each city based on the percentage of the Hispanic or Latino population, with a higher percentage being more Hispanic or Latino. Kenner was the most Hispanic or Latino, while Zachary was the least Hispanic or Latino city.
We updated this article for 2026. This article represents our eleventh time ranking the cities in Louisiana with the largest Hispanic/Latino population.
The full plate
Cities In Louisiana By Hispanic Population
Click any column to sort. Search by city name.
| Rank | City | Population | Hispanic Population | % Hispanic |
|---|---|---|---|---|
| 1 | Kenner | 64,904 | 19,179 | 29.5% |
| 2 | Gretna | 17,389 | 4,256 | 24.5% |
| 3 | Morgan City | 11,064 | 2,127 | 19.2% |
| 4 | St. Gabriel | 6,639 | 976 | 14.7% |
| 5 | Oakdale | 6,546 | 957 | 14.6% |
| 6 | Bossier City | 62,901 | 8,010 | 12.7% |
| 7 | Denham Springs | 9,323 | 1,153 | 12.4% |
| 8 | Gonzales | 13,108 | 1,564 | 11.9% |
| 9 | West Monroe | 12,729 | 1,292 | 10.2% |
| 10 | Slidell | 28,561 | 2,800 | 9.8% |
| 11 | Harahan | 8,904 | 738 | 8.3% |
| 12 | New Orleans | 371,853 | 30,425 | 8.2% |
| 13 | Leesville | 5,495 | 446 | 8.1% |
| 14 | Lafayette | 121,715 | 9,853 | 8.1% |
| 15 | Houma | 32,392 | 2,421 | 7.5% |
| 16 | Scott | 8,609 | 587 | 6.8% |
| 17 | DeRidder | 9,763 | 619 | 6.3% |
| 18 | Baton Rouge | 222,771 | 13,785 | 6.2% |
| 19 | New Iberia | 27,571 | 1,635 | 5.9% |
| 20 | Mandeville | 12,946 | 756 | 5.8% |
| 21 | Lake Charles | 81,143 | 4,639 | 5.7% |
| 22 | Covington | 11,658 | 665 | 5.7% |
| 23 | Franklin | 6,461 | 362 | 5.6% |
| 24 | Central | 29,783 | 1,660 | 5.6% |
| 25 | Jennings | 9,553 | 496 | 5.2% |
| 26 | Westwego | 8,335 | 405 | 4.9% |
| 27 | Abbeville | 11,003 | 532 | 4.8% |
| 28 | Broussard | 14,322 | 685 | 4.8% |
| 29 | Thibodaux | 15,732 | 707 | 4.5% |
| 30 | Natchitoches | 17,577 | 776 | 4.4% |
| 31 | Shreveport | 180,982 | 7,356 | 4.1% |
| 32 | Crowley | 11,422 | 453 | 4.0% |
| 33 | Donaldsonville | 6,831 | 265 | 3.9% |
| 34 | Ponchatoula | 7,808 | 285 | 3.7% |
| 35 | Minden | 11,455 | 398 | 3.5% |
| 36 | Youngsville | 17,427 | 601 | 3.4% |
| 37 | Alexandria | 44,060 | 1,513 | 3.4% |
| 38 | Sulphur | 20,775 | 660 | 3.2% |
| 39 | Bogalusa | 10,468 | 327 | 3.1% |
| 40 | Ville Platte | 6,253 | 191 | 3.1% |
| 41 | Bastrop | 9,232 | 279 | 3.0% |
| 42 | Hammond | 21,539 | 643 | 3.0% |
| 43 | Opelousas | 15,495 | 443 | 2.9% |
| 44 | Monroe | 47,004 | 1,285 | 2.7% |
| 45 | Carencro | 11,619 | 312 | 2.7% |
| 46 | Patterson | 5,744 | 147 | 2.6% |
| 47 | Plaquemine | 6,075 | 134 | 2.2% |
| 48 | Eunice | 9,239 | 182 | 2.0% |
| 49 | Walker | 6,390 | 122 | 1.9% |
| 50 | Ruston | 22,284 | 417 | 1.9% |
| 51 | Baker | 12,253 | 212 | 1.7% |
| 52 | Pineville | 14,160 | 233 | 1.6% |
| 53 | Tallulah | 5,969 | 95 | 1.6% |
| 54 | Rayne | 7,105 | 105 | 1.5% |
| 55 | St. Martinville | 5,297 | 77 | 1.5% |
| 56 | Breaux Bridge | 7,501 | 103 | 1.4% |
| 57 | Zachary | 19,952 | 85 | 0.4% |
Source: U.S. Census ACS 2020-2024. 57 cities with more than 5,000 residents.
Summary
Summary: Hispanic or Latino Populations Across Louisiana
According to the most recent data, this is an accurate list if you’re looking for a breakdown of Latino populations for each place across Louisiana.
The most Hispanic/Latino cities in Louisiana are Kenner, Gretna, Morgan City, St. Gabriel, Oakdale, Bossier City, Denham Springs, Gonzales, West Monroe, and Slidell.


