Most Hispanic/Latino cities in New Jersey research summary. We used Saturday Night Science to analyze New Jersey’s most recent Census data to determine the most Hispanic/Latino cities based on the percentage of Hispanic/Latino residents.
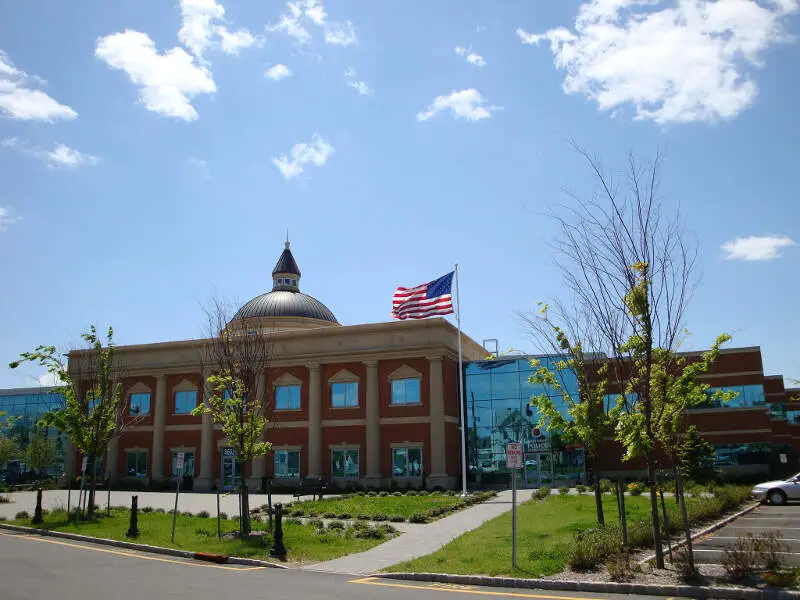
83.6% Hispanic · #1 most Hispanic in New Jersey
Perth Amboy is a city in Middlesex County, New Jersey, United States. The City of Perth Amboy is part of the New York metropolitan area. As of the 2010 United States Census, the city’s population was 50,814, reflecting an increase of 3,511 from the 47,303 counted in the 2000 Census, which had in turn increased by 5,336 from the 41,967 counted in the 1990 Census. Perth Amboy is known as the “City by the Bay,” referring to Raritan Bay.
Data | Crime | Cost of living | Movers
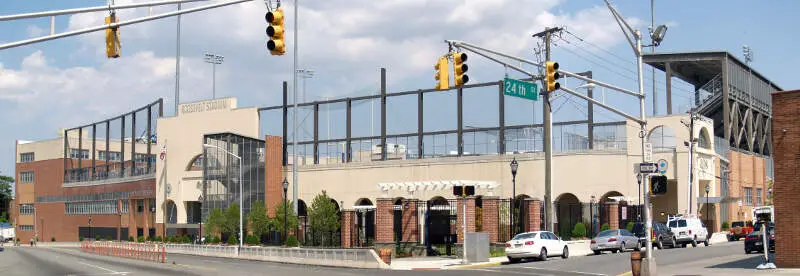
81.8% Hispanic · #2 most Hispanic in New Jersey
Union City is a city in Hudson County, New Jersey, United States. According to the 2010 United States Census the city had a total population of 66,455, reflecting a decline of 633 from the 67,088 counted in the 2000 Census, which had in turn increased by 9,076 from the 58,012 counted in the 1990 Census. As of the 2010 Census it was the most densely populated city in the United States,a with a density of 51,810.1 per square mile.
Data | Crime | Cost of living | Movers
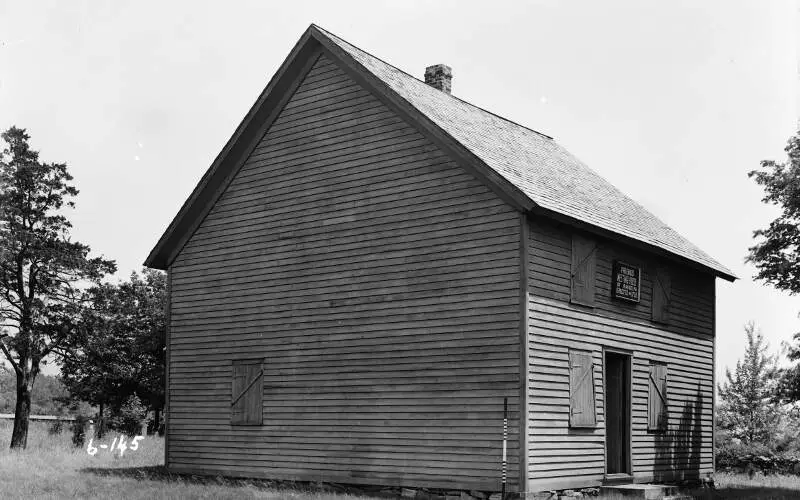
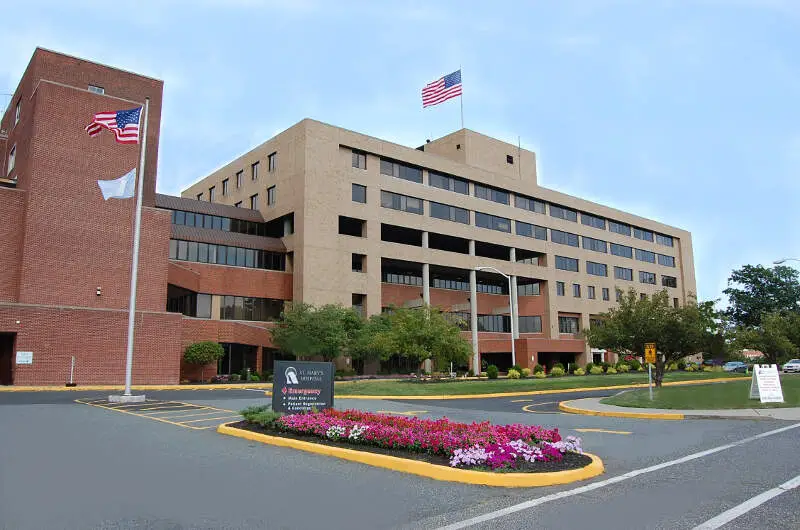
76.4% Hispanic · #3 most Hispanic in New Jersey
Dover is a town in Morris County, New Jersey, United States. Located on the Rockaway River, Dover is about 31 miles west of New York City and about 23 miles west of Newark, New Jersey. As of the 2010 United States Census, the town’s population was 18,157, reflecting a decline of 31 from the 18,188 counted in the 2000 Census, which had in turn increased by 3,073 from the 15,115 counted in the 1990 Census. Dover has become a majority minority community, with nearly 70% of the population as of the 2010 Census identifying themselves as Hispanic, up from 25% in 1980.
Data | Crime | Cost of living | Movers
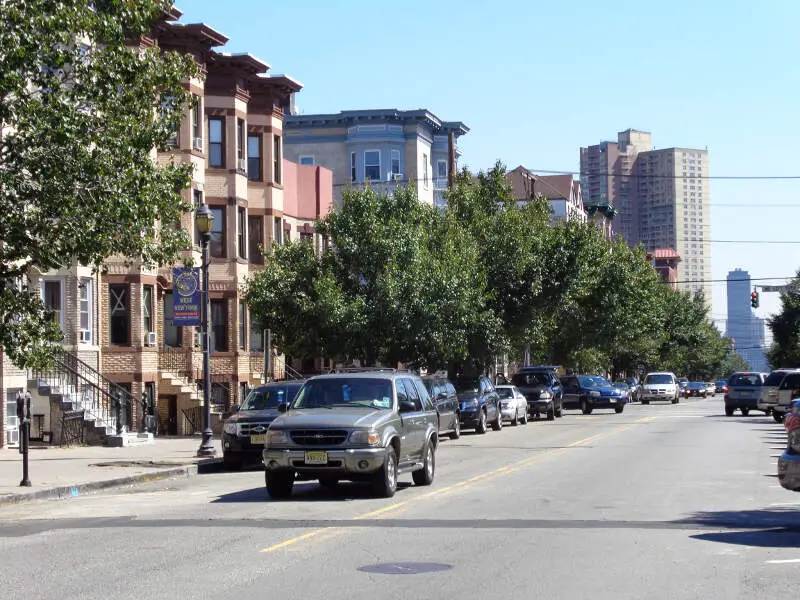
75.9% Hispanic · #4 most Hispanic in New Jersey
West New York is a town in Hudson County, New Jersey, United States, situated upon the New Jersey Palisades. As of the 2010 United States Census, the town’s population was 49,708, reflecting an increase of 3,940 from the 45,768 counted in the 2000 Census, which had in turn increased by 7,643 from the 38,125 counted in the 1990 Census.
Data | Crime | Cost of living | Movers
73.3% Hispanic · #5 most Hispanic in New Jersey
Passaic is a city in Passaic County, New Jersey, United States. As of the 2010 United States Census, the city had a total population of 69,781, maintaining its status as the 15th largest municipality in New Jersey with an increase of 1,920 residents from the 2000 Census population of 67,861, which had in turn increased by 9,820 from the 58,041 counted in the 1990 Census. Passaic is the tenth most densely populated municipality in the entire United States with 22,000+ people per square mile.
Data | Crime | Cost of living | Movers
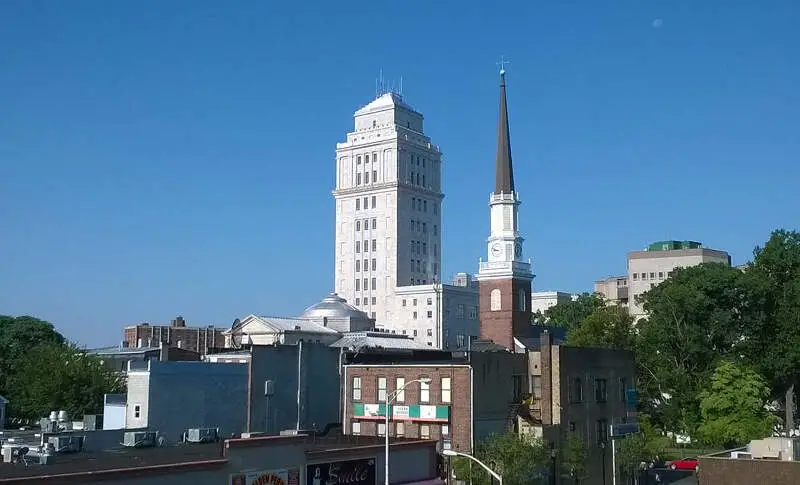
67.4% Hispanic · #6 most Hispanic in New Jersey
Elizabeth is both the largest city and the county seat of Union County, in New Jersey, United States. As of the 2010 United States Census, the city had a total population of 124,969, retaining its ranking as New Jersey’s fourth largest city. The population increased by 4,401 from the 120,568 counted in the 2000 Census, which had in turn increased by 10,566 from the 110,002 counted in the 1990 Census. For 2015, the Census Bureau’s Population Estimates Program calculated a population of 129,007, an increase of 3.2% from the 2010 enumeration, ranking the city the 210th largest in the nation.
Data | Crime | Cost of living | Movers
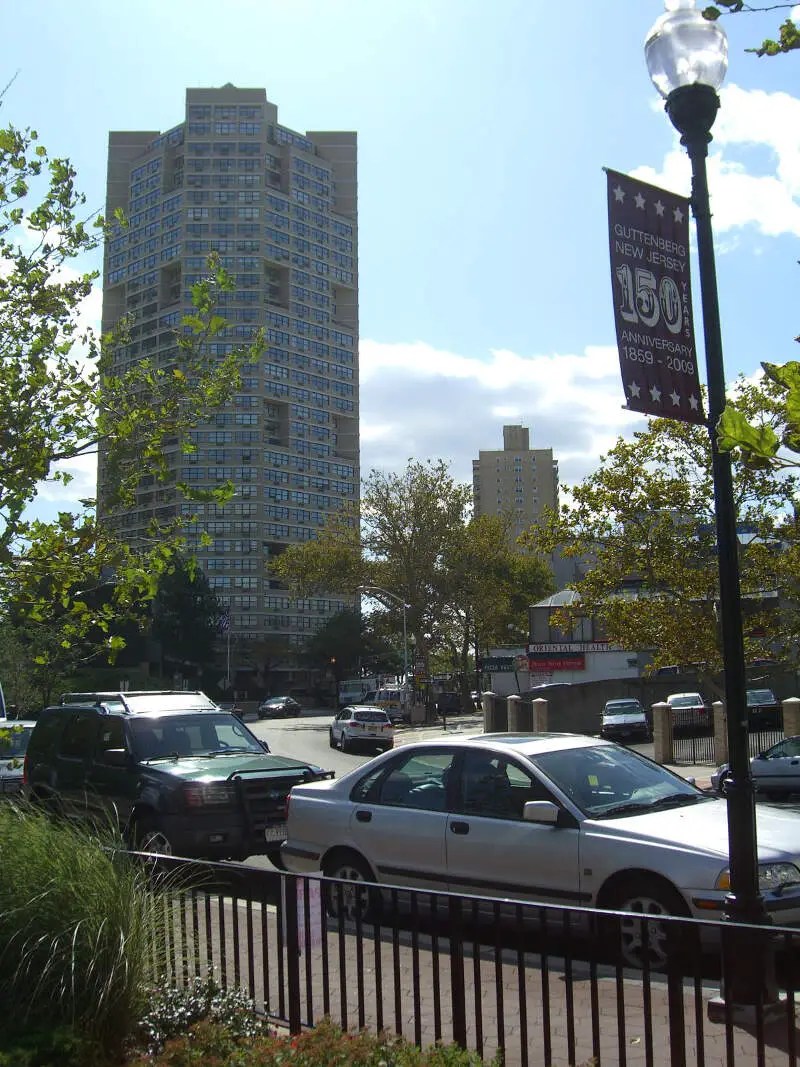
66.8% Hispanic · #7 most Hispanic in New Jersey
Guttenberg is a town in Hudson County, New Jersey, United States. As of the 2010 United States Census, the town’s population was 11,176. Only four blocks wide, Guttenberg is the ninth-smallest municipality in the state and the most densely populated incorporated municipality in the United States, as well as one of the most densely populated municipalities worldwide, with 57,116 people per square mile of land area.
Data | Crime | Cost of living | Movers
65.8% Hispanic · #8 most Hispanic in New Jersey
Data | Crime | Cost of living | Movers
64.9% Hispanic · #9 most Hispanic in New Jersey
Data | Crime | Cost of living | Movers
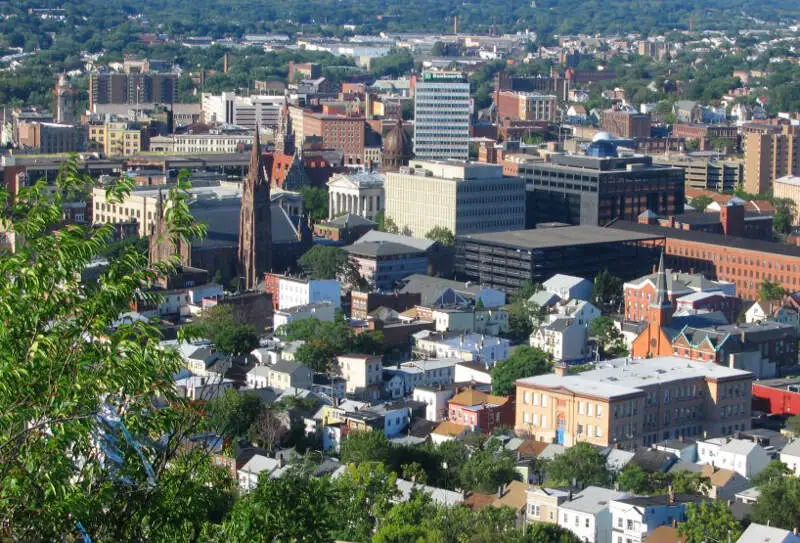
64.5% Hispanic · #10 most Hispanic in New Jersey
Paterson is the largest city in and the county seat of Passaic County, New Jersey, United States. As of the 2010 United States Census, its population was 146,199, rendering it New Jersey’s third-most-populous city. Paterson has the second-highest density of any U.S. city with over 100,000 people, behind only New York City. For 2015, the Census Bureau’s Population Estimates Program calculated a population of 147,754, an increase of 1.1% from the 2010 enumeration, ranking the city the 177th-largest in the nation.
Data | Crime | Cost of living | Movers
The receipts
Compare the top ten
Pick a metric. The bars rescale. The red line is New Jersey’s statewide median.
On the map
Where New Jersey’s Hispanic and Latino communities live
Saturday Night Science
Methodology: How We Determined The Cities In New Jersey With The Largest Hispanic Population For 2026
We used Saturday Night Science to compare data on race from the US Census for every city in New Jersey.
New Jersey’s most recently available data comes from the 2020-2024 American Community Survey.
Specifically, we looked at table B03002: Hispanic OR LATINO ORIGIN BY RACE. Here are the category names as defined by the Census:
- Hispanic or Latino
- White alone*
- Black or African American alone*
- American Indian and Alaska Native alone*
- Asian alone*
- Native Hawaiian and Other Pacific Islander alone*
- Some other race alone*
- Two or more races*
Our particular column of interest here was the number of people who identified as Hispanic or Latino.
We limited our analysis to places in New Jersey with a population greater than 5,000 people. That left us with 251 cities.
We then calculated the percentage of Hispanic or Latino residents in each New Jersey city. The percentages ranked from 83.6% to 1.0%.
Finally, we ranked each city based on the percentage of the Hispanic or Latino population, with a higher percentage being more Hispanic or Latino. Perth Amboy was the most Hispanic or Latino, while Fair Haven was the least Hispanic or Latino city.
We updated this article for 2026. This article represents our eleventh time ranking the cities in New Jersey with the largest Hispanic/Latino population.
The full plate
Cities In New Jersey By Hispanic Population
Click any column to sort. Search by city name.
| Rank | City | Population | Hispanic Population | % Hispanic |
|---|---|---|---|---|
| 1 | Perth Amboy | 55,855 | 46,668 | 83.6% |
| 2 | Union City | 66,463 | 54,391 | 81.8% |
| 3 | Dover | 18,563 | 14,174 | 76.4% |
| 4 | West New York | 52,004 | 39,467 | 75.9% |
| 5 | Passaic | 70,002 | 51,341 | 73.3% |
| 6 | Elizabeth | 137,302 | 92,543 | 67.4% |
| 7 | Guttenberg | 11,754 | 7,850 | 66.8% |
| 8 | Fairview | 15,099 | 9,928 | 65.8% |
| 9 | Prospect Park | 6,319 | 4,103 | 64.9% |
| 10 | Paterson | 158,735 | 102,436 | 64.5% |
| 11 | Bridgeton | 27,001 | 16,019 | 59.3% |
| 12 | Bound Brook | 12,219 | 7,158 | 58.6% |
| 13 | Plainfield | 55,236 | 31,556 | 57.1% |
| 14 | North Plainfield | 22,809 | 12,482 | 54.7% |
| 15 | New Brunswick | 56,345 | 30,777 | 54.6% |
| 16 | East Franklin | 11,070 | 5,946 | 53.7% |
| 17 | Pleasantville | 20,712 | 11,123 | 53.7% |
| 18 | Camden | 71,496 | 38,259 | 53.5% |
| 19 | Freehold | 12,507 | 6,660 | 53.3% |
| 20 | Kearny | 40,614 | 20,992 | 51.7% |
| 21 | Wharton | 7,318 | 3,754 | 51.3% |
| 22 | Ridgefield Park | 13,235 | 6,624 | 50.0% |
| 23 | Bogota | 9,360 | 4,582 | 49.0% |
| 24 | Garfield | 32,783 | 15,505 | 47.3% |
| 25 | Jamesburg | 5,770 | 2,720 | 47.1% |
| 26 | Haledon | 8,980 | 4,166 | 46.4% |
| 27 | Trenton | 90,338 | 41,890 | 46.4% |
| 28 | Dunellen | 7,911 | 3,579 | 45.2% |
| 29 | Vineland | 61,006 | 27,303 | 44.8% |
| 30 | Roselle | 22,646 | 10,007 | 44.2% |
| 31 | Harrison | 20,369 | 8,087 | 39.7% |
| 32 | Clifton | 89,379 | 35,175 | 39.4% |
| 33 | Lodi | 26,082 | 10,167 | 39.0% |
| 34 | Ridgefield | 11,498 | 4,345 | 37.8% |
| 35 | Newark | 310,178 | 116,594 | 37.6% |
| 36 | Little Ferry | 10,996 | 4,132 | 37.6% |
| 37 | Hackensack | 46,057 | 17,120 | 37.2% |
| 38 | Twin Rivers | 8,382 | 2,986 | 35.6% |
| 39 | Linden | 44,192 | 15,546 | 35.2% |
| 40 | Cliffside Park | 25,781 | 8,892 | 34.5% |
| 41 | Carteret | 25,496 | 8,714 | 34.2% |
| 42 | Englewood | 29,638 | 9,942 | 33.5% |
| 43 | Bergenfield | 28,450 | 9,402 | 33.0% |
| 44 | Morristown | 20,453 | 6,722 | 32.9% |
| 45 | Roselle Park | 14,093 | 4,540 | 32.2% |
| 46 | Bayonne | 71,553 | 22,985 | 32.1% |
| 47 | Atlantic City | 38,632 | 12,331 | 31.9% |
| 48 | Red Bank | 12,862 | 4,104 | 31.9% |
| 49 | Kenilworth | 8,401 | 2,656 | 31.6% |
| 50 | Woodland Park | 13,355 | 4,207 | 31.5% |
| 51 | Finderne | 6,489 | 1,992 | 30.7% |
| 52 | Manville | 10,921 | 3,332 | 30.5% |
| 53 | North Arlington | 16,461 | 4,993 | 30.3% |
| 54 | Lindenwold | 21,719 | 6,479 | 29.8% |
| 55 | Elmwood Park | 21,412 | 6,323 | 29.5% |
| 56 | Fort Dix | 7,984 | 2,275 | 28.5% |
| 57 | Rahway | 30,109 | 8,253 | 27.4% |
| 58 | Maywood | 10,093 | 2,760 | 27.3% |
| 59 | Dumont | 18,279 | 4,935 | 27.0% |
| 60 | Westwood | 11,283 | 2,958 | 26.2% |
| 61 | Hawthorne | 19,628 | 5,132 | 26.1% |
| 62 | Wildwood | 5,130 | 1,334 | 26.0% |
| 63 | Keansburg | 9,719 | 2,510 | 25.8% |
| 64 | Keyport | 7,171 | 1,848 | 25.8% |
| 65 | Jersey City | 294,078 | 75,547 | 25.7% |
| 66 | Totowa | 10,959 | 2,815 | 25.7% |
| 67 | Hackett | 10,140 | 2,602 | 25.7% |
| 68 | Asbury Park | 15,295 | 3,898 | 25.5% |
| 69 | Avenel | 17,121 | 4,338 | 25.3% |
| 70 | Leonia | 9,336 | 2,362 | 25.3% |
| 71 | Long Branch | 32,530 | 8,211 | 25.2% |
| 72 | Gloucester City | 11,509 | 2,889 | 25.1% |
| 73 | Butler | 8,133 | 2,034 | 25.0% |
| 74 | Hammonton | 14,840 | 3,667 | 24.7% |
| 75 | Woodbridge | 20,756 | 5,098 | 24.6% |
| 76 | South River | 16,124 | 3,944 | 24.5% |
| 77 | Hight | 5,920 | 1,440 | 24.3% |
| 78 | Middlesex | 14,645 | 3,562 | 24.3% |
| 79 | Fords | 12,771 | 3,069 | 24.0% |
| 80 | Hopatcong | 14,565 | 3,441 | 23.6% |
| 81 | White Horse | 10,507 | 2,465 | 23.5% |
| 82 | North Haledon | 8,778 | 2,039 | 23.2% |
| 83 | Carlstadt | 6,378 | 1,466 | 23.0% |
| 84 | South Amboy | 9,989 | 2,270 | 22.7% |
| 85 | East Rutherford | 10,313 | 2,339 | 22.7% |
| 86 | Palisades Park | 20,290 | 4,523 | 22.3% |
| 87 | Brookdale | 9,960 | 2,217 | 22.3% |
| 88 | Bloomingdale | 7,716 | 1,714 | 22.2% |
| 89 | Raritan | 8,368 | 1,816 | 21.7% |
| 90 | Hasbrouck Heights | 12,115 | 2,597 | 21.4% |
| 91 | Kingston Estates | 6,668 | 1,429 | 21.4% |
| 92 | Budd Lake | 10,650 | 2,258 | 21.2% |
| 93 | Sayreville | 45,838 | 9,712 | 21.2% |
| 94 | Somerville | 13,410 | 2,835 | 21.1% |
| 95 | Clementon | 5,410 | 1,133 | 20.9% |
| 96 | Wood-Ridge | 10,218 | 2,137 | 20.9% |
| 97 | Rutherford | 18,894 | 3,938 | 20.8% |
| 98 | Caldwell | 9,003 | 1,872 | 20.8% |
| 99 | New Milford | 16,995 | 3,485 | 20.5% |
| 100 | Ramtown | 6,203 | 1,270 | 20.5% |
Source: U.S. Census ACS 2020-2024. 251 cities with more than 5,000 residents.
Summary
Summary: Hispanic or Latino Populations Across New Jersey
According to the most recent data, this is an accurate list if you’re looking for a breakdown of Latino populations for each place across New Jersey.
The most Hispanic/Latino cities in New Jersey are Perth Amboy, Union City, Dover, West New York, Passaic, Elizabeth, Guttenberg, Fairview, Prospect Park, and Paterson.


