In this article, we will explore some of the most liberal cities in Kentucky, where progressive ideas and inclusive attitudes flourish.
If you’re looking to move to Kentucky and want to know where the majority of Kentuckians lean left, you’ve come to the right place.
Specifically, we wanted to know which cities have the highest number of liberal voters in the Bluegrass State.
To do so, we analyzed how the people in each city in Kentucky with a population greater than 5,000 voted during the last presidential election. The cities with the highest percentage of voters who voted Democrat were named the most liberal cities in the state.
59.3% Democrat vote · #1 most liberal in Kentucky
Lexington, consolidated with Fayette County and often denoted as Lexington-Fayette, is the second-largest city in Kentucky and the 60th-largest city in the United States. By land area, Lexington is the 28th largest city in the United States. Known as the “Horse Capital of the World,” it is the heart of the state’s Bluegrass region. With a mayor-alderman form of government, it is one of two cities in Kentucky designated by the state as first-class; the other is the state’s largest city of Louisville. In the 2016 U.S. Census Estimate, the city’s population was 318,449, anchoring a metropolitan area of 506,751 people and a combined statistical area of 723,849 people. Due to constant increases in population, Lexington suffers some of the worst traffic congestion in Kentucky, because two interstates bypass the city to the north and east, resulting in a lack of freeways going through the most populated areas of the city.
59.1% Democrat vote · #5 most liberal in Kentucky
Louisville LOO–vl or LUUV-l) is the largest city in the Commonwealth of Kentucky and the 29th-most populous city in the United States. It is one of two cities in Kentucky designated as first-class, the other being the state’s second-largest city of Lexington. Louisville is the historical seat and, since 2003, the nominal seat of Jefferson County.
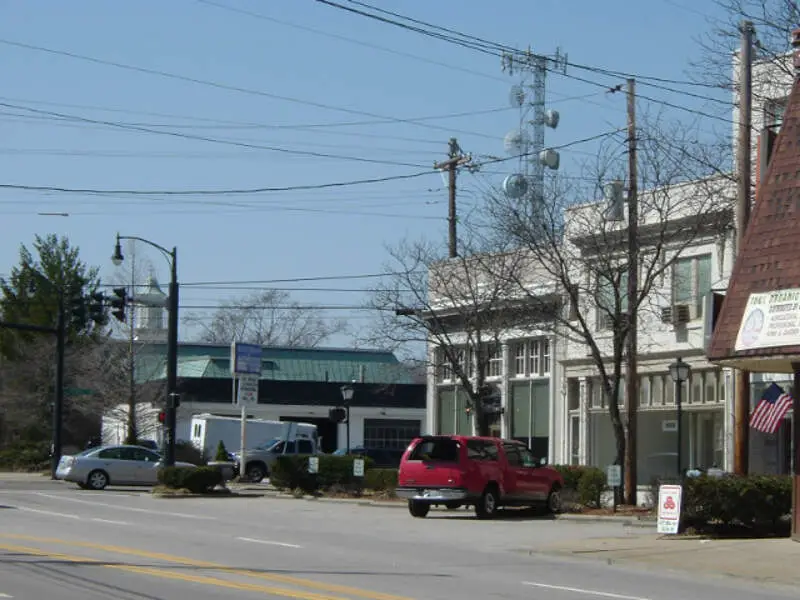
59.1% Democrat vote · #5 most liberal in Kentucky
Jeffersontown is a home rule-class city in Jefferson County, Kentucky, United States. The population was 26,595 at the 2010 U.S. census.
Data | Crime | Cost of living | Movers
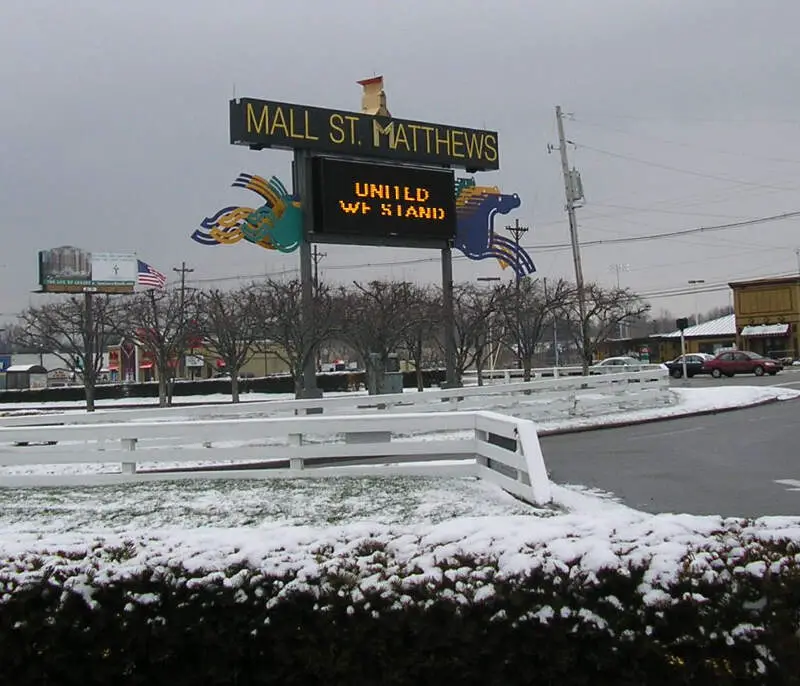
59.1% Democrat vote · #5 most liberal in Kentucky
St. Matthews is a city in Jefferson County, Kentucky, United States. It forms part of the Louisville Metro government but is separately incorporated as a home rule-class city. The population was 15,852 at the 2000 census, making it the 20th-largest city in the state.
Data | Crime | Cost of living | Movers
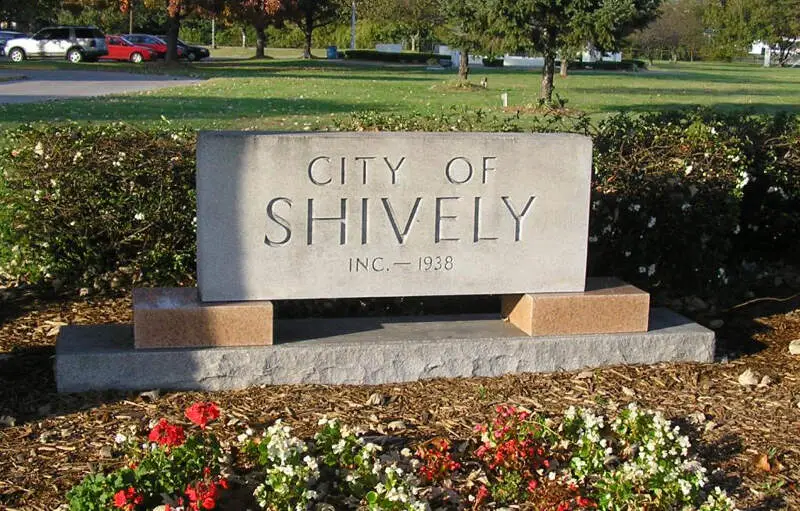
59.1% Democrat vote · #5 most liberal in Kentucky
Shively is a home rule-class city in Jefferson County, Kentucky, United States and a suburb of Louisville within the Louisville Metro government. As of the 2010 Census, the city’s population was 15,264, reflecting an increase of 107 from 15,157 in 2000.
Data | Crime | Cost of living | Movers
59.1% Democrat vote · #5 most liberal in Kentucky
Lyndon is a home rule-class city in Jefferson County, Kentucky, United States. The population was 9,369 at the 2000 U.S. census.
Data | Crime | Cost of living | Movers
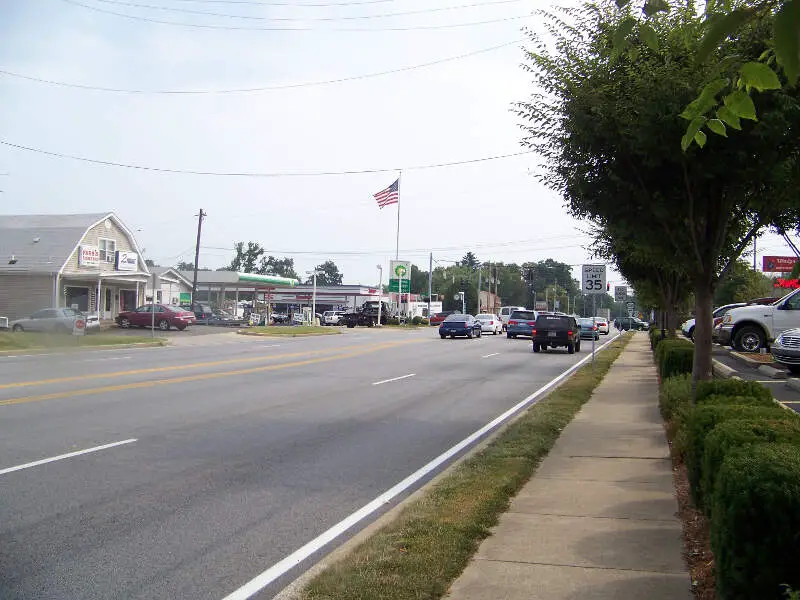
59.1% Democrat vote · #5 most liberal in Kentucky
Middletown is an independent, home rule-class city in Jefferson County, Kentucky, United States, and a former neighborhood of Louisville. The population was 7,218 at the 2010 census.
Data | Crime | Cost of living | Movers
59.1% Democrat vote · #5 most liberal in Kentucky
Douglass Hills is a home rule-class city in eastern Jefferson County, Kentucky, United States. The population was 5,718 at the 2000 census.
Data | Crime | Cost of living | Movers
48.5% Democrat vote · #9 most liberal in Kentucky
Frankfort is the capital city of the Commonwealth of Kentucky and the seat of Franklin County. It is a home rule-class city in Kentucky; the population was 25,527 at the 2010 census. Located along the Kentucky River, Frankfort is the principal city of the Frankfort, Kentucky Micropolitan Statistical Area, which includes all of Franklin and Anderson counties.
Data | Crime | Cost of living | Movers
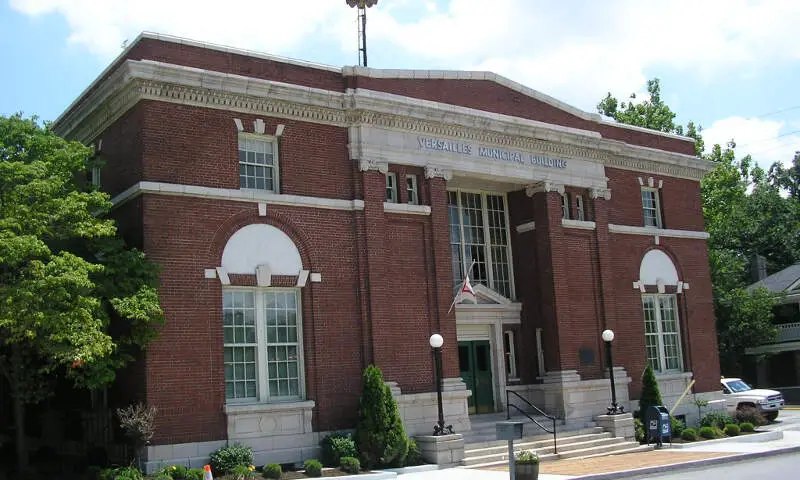
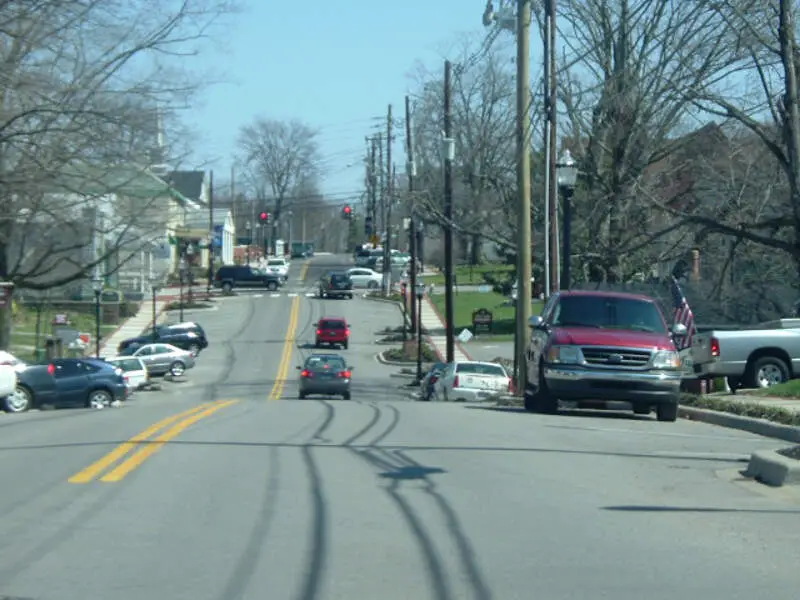
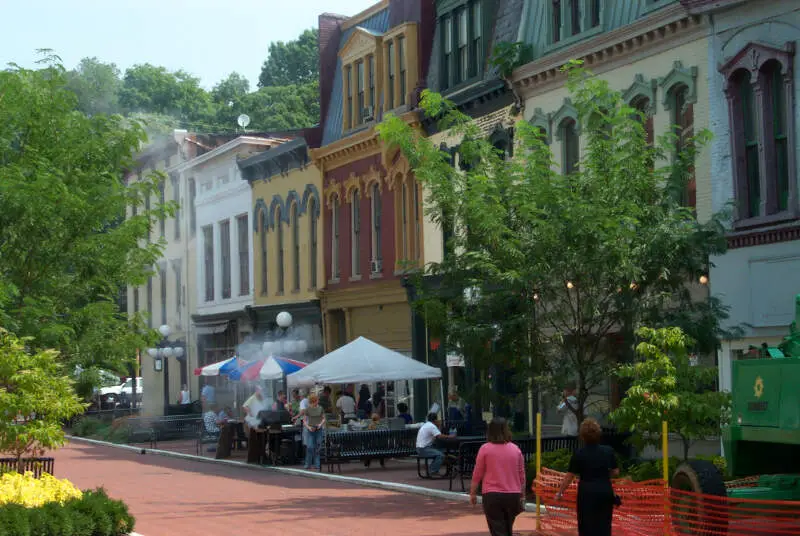
42.9% Democrat vote · #10 most liberal in Kentucky
Versailles is a home rule-class city in Woodford County, Kentucky, United States and is located near Lexington. It is part of the Lexington-Fayette Metropolitan Statistical Area. The population was 8,568 at the 2010 census. It is the county seat of Woodford County. The city’s name is pronounced vr-SAYLZ, not like the French city of the same name.
Data | Crime | Cost of living | Movers
The receipts
Compare the top ten
Pick a metric. The bars rescale. The red line is Kentucky’s statewide median.
On the map
Mapping the liberal strongholds in Kentucky
Saturday Night Science
How we determined the most liberal cities in Kentucky for 2026
To find the most liberal places in Kentucky, we used Saturday Night Science – the argument you’d make at a bar – to find the cities with the most liberals.
We started by making a list of every city in Kentucky over 5,000 people based on the 2020-2024 American Community Survey. That left us with 80 cities and towns.
We then measured the voting record and MIT election data to determine which places lean the most leftward in their allegiances by:
- Percentage Of Votes For Democratic President In 2020
Because no voting data exists at the city level, we used county-level election results from the 2020 election. We assigned every city in a county the percentage of votes that went to the Democrats, effectively extending the county’s results to the city level. In cases where larger cities encompassed an entire county, the election outcomes accurately reflected the city’s political landscape.
The winner, Lexington-Fayette urban county, is “The Most liberal City in Kentucky For 2026”. The most conservative place in Kentucky was London.
We updated this article for 2026. This report is our eleventh time ranking the most liberal places to live in Kentucky.
The full plate
Most Liberal Places In Kentucky
Click any column to sort. Search by city name.
| Rank | City | Population | % Liberal |
|---|---|---|---|
| 1 | Lexington-Fayette urban county | 323,725 | 59.3% |
| 5 | Louisville/Jefferson County metro government (balance) | 631,818 | 59.1% |
| 5 | Jeffersontown | 29,199 | 59.1% |
| 5 | St. Matthews | 17,577 | 59.1% |
| 5 | Shively | 15,638 | 59.1% |
| 5 | Lyndon | 11,030 | 59.1% |
| 5 | Middletown | 9,763 | 59.1% |
| 5 | Douglass Hills | 5,474 | 59.1% |
| 9 | Frankfort | 28,503 | 48.5% |
| 10 | Versailles | 10,492 | 42.9% |
| 11 | Bowling Green | 75,388 | 40.6% |
| 15 | Bellevue | 5,636 | 39.7% |
| 15 | Dayton | 5,743 | 39.7% |
| 15 | Cold Spring | 6,341 | 39.7% |
| 15 | Fort Thomas | 17,169 | 39.7% |
| 15 | Alexandria | 10,562 | 39.7% |
| 15 | Newport | 13,967 | 39.7% |
| 15 | Highland Heights | 6,444 | 39.7% |
| 23 | Villa Hills | 7,480 | 39.3% |
| 23 | Walton | 5,730 | 39.3% |
| 23 | Fort Wright | 5,887 | 39.3% |
| 23 | Taylor Mill | 6,937 | 39.3% |
| 23 | Edgewood | 8,447 | 39.3% |
| 23 | Independence | 29,392 | 39.3% |
| 23 | Elsmere | 9,205 | 39.3% |
| 23 | Erlanger | 19,875 | 39.3% |
| 23 | Covington | 41,110 | 39.3% |
| 23 | Fort Mitchell | 8,713 | 39.3% |
| 29 | Morehead | 6,870 | 38.6% |
| 30 | La Grange | 10,311 | 38.2% |
| 30 | Crestwood | 6,356 | 38.2% |
| 33 | Elizabethtown | 32,576 | 37.0% |
| 33 | Radcliff | 22,864 | 37.0% |
| 33 | Vine Grove | 6,830 | 37.0% |
| 35 | Henderson | 27,852 | 36.9% |
| 36 | Danville | 17,327 | 36.6% |
| 37 | Georgetown | 39,117 | 36.5% |
| 38 | Richmond | 37,111 | 35.5% |
| 38 | Berea | 15,786 | 35.5% |
| 40 | Owensboro | 60,302 | 35.1% |
| 41 | Hopkinsville | 30,906 | 34.8% |
| 41 | Oak Grove | 7,962 | 34.8% |
| 43 | Shelbyville | 17,668 | 34.3% |
| 44 | Paris | 10,160 | 34.2% |
| 45 | Paducah | 26,845 | 33.4% |
| 46 | Murray | 18,080 | 33.2% |
| 47 | Winchester | 19,213 | 33.1% |
| 48 | Nicholasville | 32,197 | 32.6% |
| 48 | Wilmore | 6,057 | 32.6% |
| 50 | Ashland | 21,295 | 32.6% |
| 51 | Florence | 32,803 | 31.2% |
| 51 | Union | 7,642 | 31.2% |
| 53 | Bardstown | 13,804 | 30.9% |
| 54 | Franklin | 10,360 | 30.7% |
| 55 | Lebanon | 6,430 | 30.5% |
| 56 | Maysville | 8,737 | 29.7% |
| 57 | Mount Sterling | 7,551 | 28.3% |
| 58 | Cynthiana | 6,458 | 27.1% |
| 59 | Flatwoods | 7,269 | 26.8% |
| 60 | Harrodsburg | 9,313 | 25.8% |
| 61 | Glasgow | 15,197 | 25.6% |
| 62 | Madisonville | 19,515 | 25.3% |
| 63 | Lawrenceburg | 11,943 | 25.3% |
| 65 | Mount Washington | 18,480 | 25.1% |
| 65 | Shepherdsville | 14,533 | 25.1% |
| 65 | Hillview | 8,797 | 25.1% |
| 67 | Russellville | 7,316 | 25.1% |
| 68 | Central City | 5,707 | 24.9% |
| 69 | Campbellsville | 11,622 | 23.7% |
| 70 | Princeton | 6,241 | 22.3% |
| 71 | Hazard | 5,008 | 22.2% |
| 72 | Mayfield | 9,868 | 20.9% |
| 73 | Leitchfield | 6,819 | 20.0% |
| 74 | Pikeville | 7,490 | 19.2% |
| 75 | Monticello | 5,753 | 18.4% |
| 76 | Somerset | 12,216 | 18.0% |
| 77 | Middlesborough | 9,123 | 17.8% |
| 78 | Corbin | 8,246 | 16.6% |
| 78 | Williamsburg | 5,270 | 16.6% |
| 80 | London | 7,561 | 15.9% |
Source: county-level 2020 election results, U.S. Census ACS 2020-2024. 80 cities with more than 5,000 residents.
Summary
Summing Up The Liberal Snowflakes in Kentucky
Well, there you have it, the places in Kentucky that have the highest number of liberals per capita, with Lexington-Fayette urban county ranking as the least conservative in the entire state.
The most liberal cities in Kentucky are Lexington-Fayette urban county, Louisville/Jefferson County metro government (balance), Jeffersontown, St. Matthews, Shively, Lyndon, Middletown, Douglass Hills, Frankfort, and Versailles.
If you’re curious, here are the least liberal cities in Kentucky. Not sold on Kentucky? Take the two-minute Find Your Place quiz and see which state actually fits you.


