Most Native American places in Massachusetts research summary. We used Saturday Night Science to research the Massachusetts cities with the highest percentage of Native American residents for 2026. The data comes from the American Community Survey 2020-2024 vintage, which breaks down race by origin.
-
The city with the highest percentage of Native Americans is North Adams. 0.59% of people in North Adams are Native Americans.
-
The city with the lowest percentage of Native Americans is Medford. 0.00% of people in Medford are Native American.
-
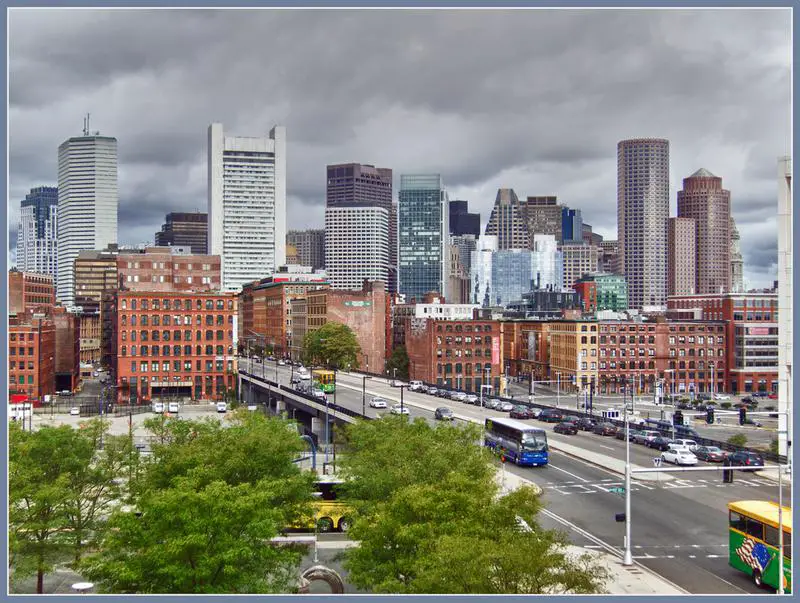
The city with the most Native Americans is Boston. 873 people in Boston are Native American.
-
The city with the fewest Native Americans is Medford. 0 people in Medford are Native American.
-
The United States has 1,698,432 Native Americans and is 0.51% Native American.
Table Of Contents: Top Ten | Methodology | Summary | Table
The 10 Cities In Massachusetts With The Largest Native American Population For 2026
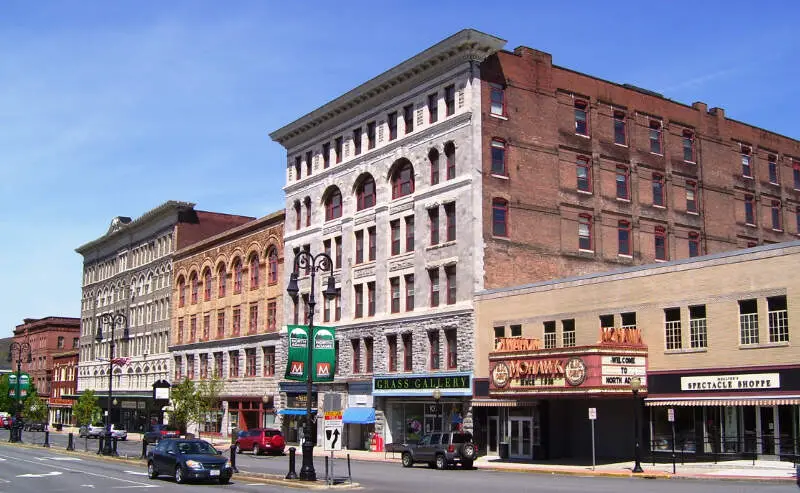
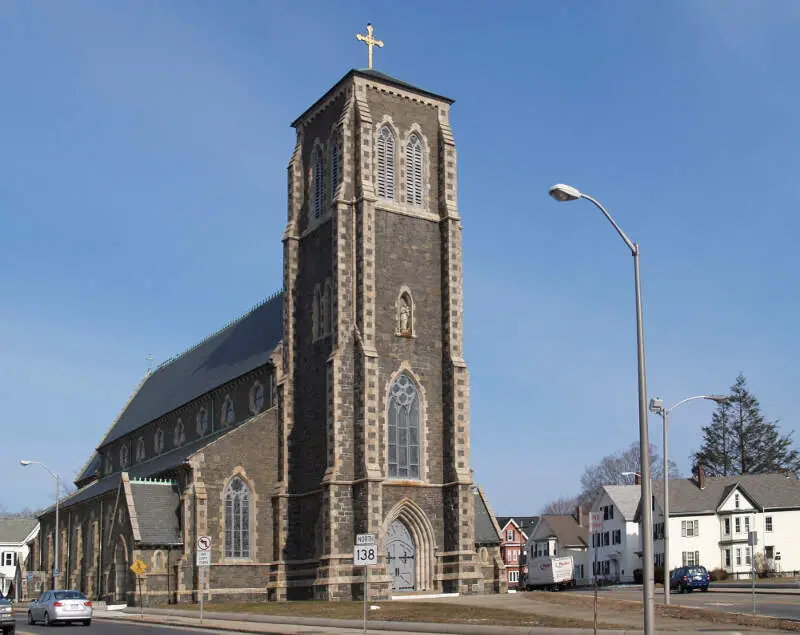
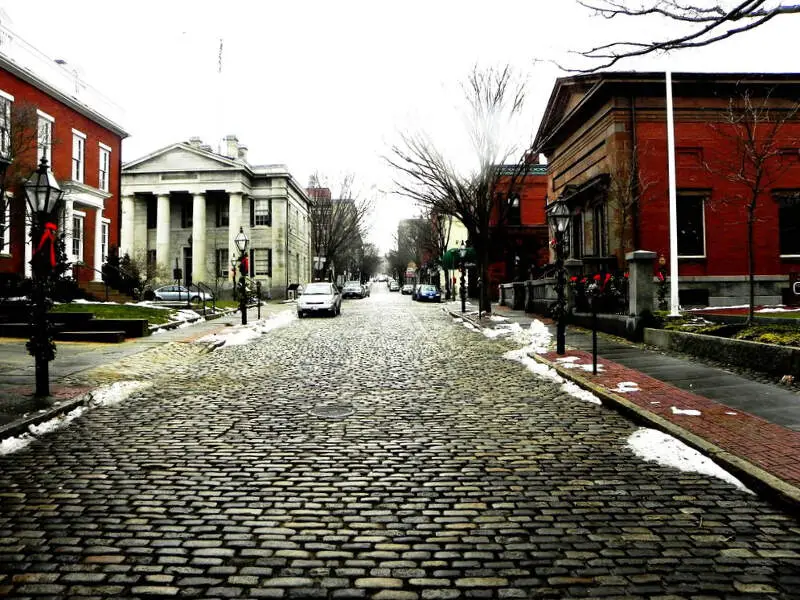
Which city in Massachusetts had the largest Native American population? The place with the largest Native American population in Massachusetts for 2026 is North Adams. 0.59 of North Adams identify as Native American.
To see where Massachusetts ranked as a state on diversity, we have a ranking of the most diverse states in America.
And if you already knew these places were Native American, check out the best places to live in Massachusetts or the most diverse places in Massachusetts.
Read below to see how we crunched the numbers and how your town ranked.
Cities In Massachusetts With The Largest Native American Population For 2026

/10
Population: 12,606
# Of Native American Residents: 75
% Native American: 0.59%
More on North Adams: Data | Crime | Cost Of Living | Movers

/10
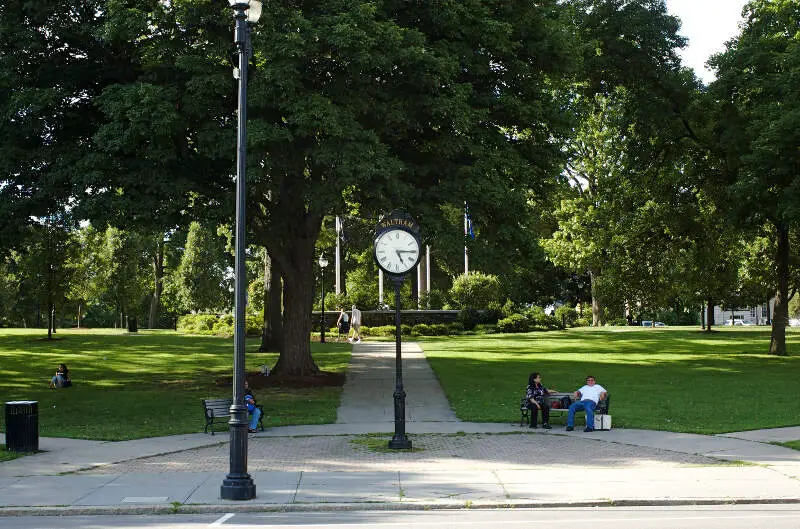
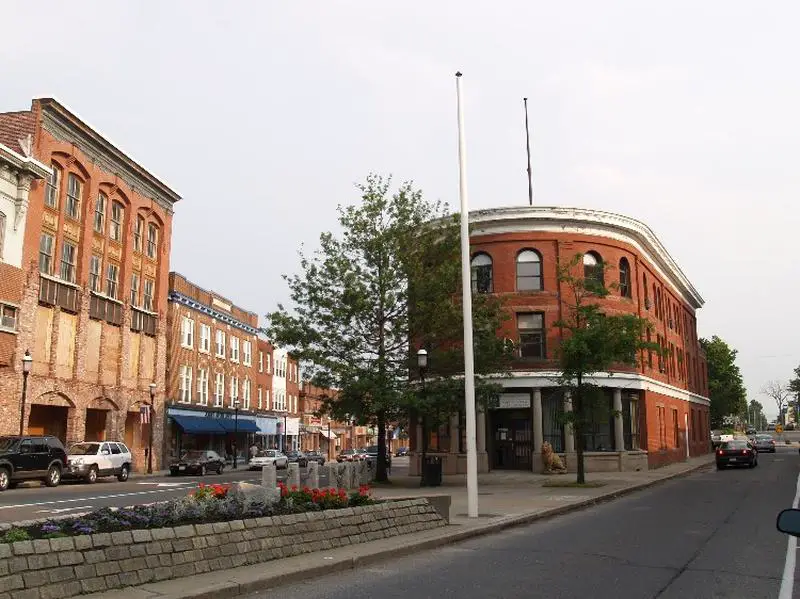
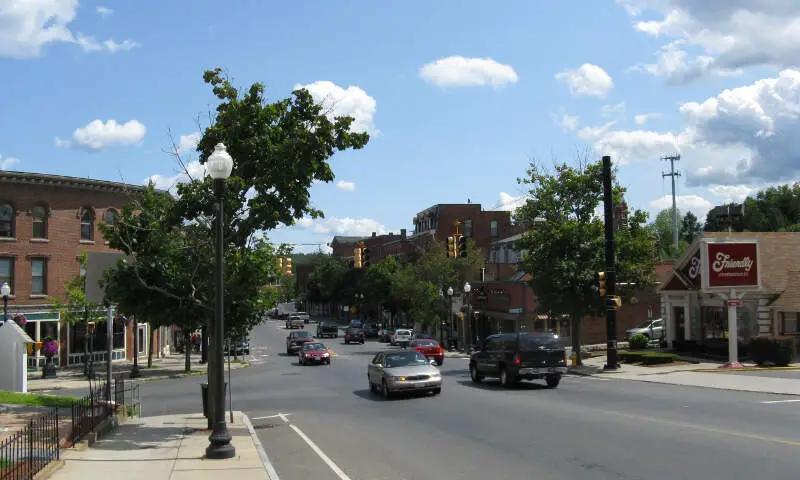
Population: 64,902
# Of Native American Residents: 169
% Native American: 0.26%
More on Waltham: Data | Crime | Cost Of Living | Movers
/10
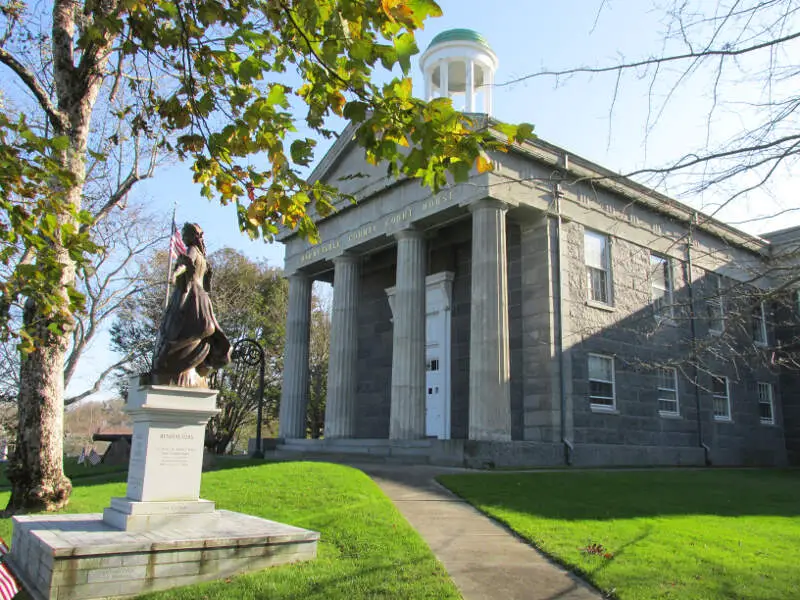
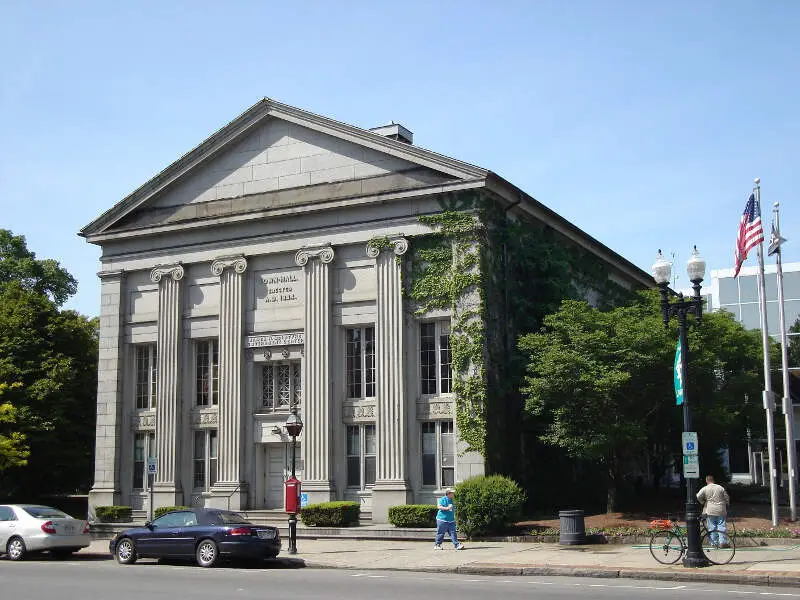
Population: 49,568
# Of Native American Residents: 112
% Native American: 0.23%
More on Barnstable Town: Data | Cost Of Living | Movers

/10
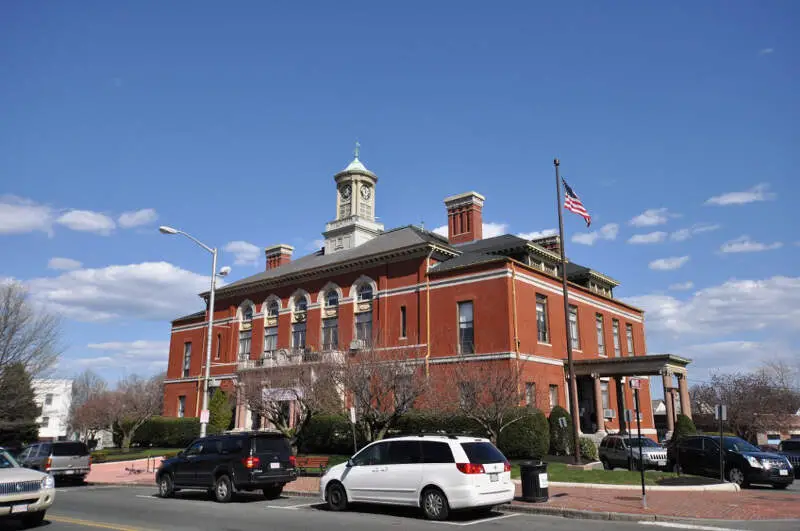
Population: 60,012
# Of Native American Residents: 88
% Native American: 0.15%
More on Revere: Data | Crime | Cost Of Living | Movers

/10
Population: 60,433
# Of Native American Residents: 81
% Native American: 0.13%
More on Taunton: Data | Crime | Cost Of Living | Movers

/10
Population: 21,148
# Of Native American Residents: 28
% Native American: 0.13%
More on Gardner: Data | Crime | Cost Of Living | Movers

/10
Population: 666,442
# Of Native American Residents: 873
% Native American: 0.13%
More on Boston: Data | Crime | Cost Of Living | Movers

/10
Population: 102,114
# Of Native American Residents: 133
% Native American: 0.13%
More on Quincy: Data | Crime | Cost Of Living | Movers

/10
Population: 100,998
# Of Native American Residents: 119
% Native American: 0.12%
More on New Bedford: Data | Crime | Cost Of Living | Movers
/10
Population: 17,928
# Of Native American Residents: 19
% Native American: 0.11%
More on Southbridge Town: Data | Cost Of Living | Movers
Methodology: How We Determined The Cities In Massachusetts With The Largest Native American Population For 2026
We still believe in the accuracy of data — especially from the Census. So that’s where we went to get the race breakdown across Massachusetts.
We used Saturday Night Science to analyze the Census’s most recently available data, the 2020-2024 American Community Survey data.
Specifically, we looked at table B03002: Hispanic OR LATINO ORIGIN BY RACE. Here are the category names as defined by the Census:
- Hispanic or Latino
- White alone*
- Black or African American alone*
- American Indian and Alaska Native alone*
- Asian alone*
- Native Hawaiian and Other Pacific Islander alone*
- Some other race alone*
- Two or more races*
Our particular column of interest here was the number of people identifying as American Indian and Alaska Native alone.
We limited our analysis to places with a population greater than 12,000 people. That left us with 48 cities.
We then calculated the percentage of residents that are American Indian and Alaska Native. The percentages ranked from 0.59 to 0.00.
Finally, we ranked each city based on the percentage of the American Indian and Alaska Native population, with a higher score being more American Indian and Alaska Native than a lower score. North Adams took the distinction of being the most American Indian and Alaska Native, while Medford was the least Native American city.
We updated this article for 2026. This article is our eleventh time ranking the cities in Massachusetts with the largest Native American population.
Summary: Native American Populations Across Massachusetts
If you’re looking for a breakdown of Native American populations across Massachusetts according to the most recent data, this is an accurate list.
The most Native American cities in Massachusetts are North Adams, Waltham, Barnstable Town, Revere, Taunton, Gardner, Boston, Quincy, New Bedford, and Southbridge Town.
If you’re curious enough, here are the least Native American places in Massachusetts:
- Medford
- Chelsea
- Franklin Town
For more Massachusetts reading, check out:
- Safest Places In Massachusetts
- Best Places To Raise A Family In Massachusetts
- Best Counties To Live In Massachusetts
Most Native American Places In Massachusetts
| Rank | City | Population | Native American Population | % Native American |
|---|---|---|---|---|
| 1 | North Adams | 12,606 | 75 | 0.59% |
| 2 | Waltham | 64,902 | 169 | 0.26% |
| 3 | Barnstable Town | 49,568 | 112 | 0.23% |
| 4 | Revere | 60,012 | 88 | 0.15% |
| 5 | Taunton | 60,433 | 81 | 0.13% |
| 6 | Gardner | 21,148 | 28 | 0.13% |
| 7 | Boston | 666,442 | 873 | 0.13% |
| 8 | Quincy | 102,114 | 133 | 0.13% |
| 9 | New Bedford | 100,998 | 119 | 0.12% |
| 10 | Southbridge Town | 17,928 | 19 | 0.11% |
| 11 | Fitchburg | 41,798 | 43 | 0.1% |
| 12 | Westfield | 40,378 | 41 | 0.1% |
| 13 | Winthrop Town | 18,759 | 18 | 0.1% |
| 14 | Fall River | 94,082 | 86 | 0.09% |
| 15 | Beverly | 42,665 | 38 | 0.09% |
| 16 | Worcester | 207,055 | 184 | 0.09% |
| 17 | Cambridge | 118,796 | 100 | 0.08% |
| 18 | Attleboro | 46,762 | 37 | 0.08% |
| 19 | Brockton | 105,386 | 83 | 0.08% |
| 20 | Malden | 65,906 | 49 | 0.07% |
| 21 | West Springfield Town | 28,772 | 20 | 0.07% |
| 22 | Springfield | 154,749 | 107 | 0.07% |
| 23 | Lynn | 101,709 | 66 | 0.06% |
| 24 | Northampton | 30,962 | 20 | 0.06% |
| 25 | Salem | 44,795 | 23 | 0.05% |
| 26 | Marlborough | 41,647 | 20 | 0.05% |
| 27 | Woburn | 41,939 | 17 | 0.04% |
| 28 | Newton | 89,044 | 34 | 0.04% |
| 29 | Everett | 50,045 | 18 | 0.04% |
| 30 | Holyoke | 37,813 | 12 | 0.03% |
| 31 | Pittsfield | 43,457 | 13 | 0.03% |
| 32 | Leominster | 43,909 | 11 | 0.03% |
| 33 | Somerville | 81,036 | 19 | 0.02% |
| 34 | Chicopee | 55,295 | 9 | 0.02% |
| 35 | Lawrence | 88,736 | 14 | 0.02% |
| 36 | Braintree Town | 38,899 | 6 | 0.02% |
| 37 | Weymouth Town | 58,505 | 7 | 0.01% |
| 38 | Lowell | 118,368 | 13 | 0.01% |
| 39 | Haverhill | 67,698 | 3 | 0.0% |
| 40 | Agawam Town | 28,539 | 0 | 0.0% |
| 41 | Peabody | 54,695 | 0 | 0.0% |
| 42 | Palmer Town | 12,381 | 0 | 0.0% |
| 43 | Newburyport | 18,652 | 0 | 0.0% |
| 44 | Melrose | 29,650 | 0 | 0.0% |
| 45 | Gloucester | 30,075 | 0 | 0.0% |
| 46 | Franklin Town | 33,154 | 0 | 0.0% |
| 47 | Chelsea | 39,908 | 0 | 0.0% |
| 48 | Medford | 59,354 | 0 | 0.0% |


