Roselle Park, NJ
Demographics And Statistics
Living In Roselle Park, New Jersey Summary
Life in Roselle Park research summary. HomeSnacks has been using Saturday Night Science to research the quality of life in Roselle Park over the past nine years using Census, FBI, Zillow, and other primary data sources. Based on the most recently available data, we found the following about life in Roselle Park:
The population in Roselle Park is 13,965.
The median home value in Roselle Park is $541,245.
The median income in Roselle Park is $104,418.
The cost of living in Roselle Park is 122 which is 1.2x higher than the national average.
The median rent in Roselle Park is $1,585.
The unemployment rate in Roselle Park is 4.8%.
The poverty rate in Roselle Park is 5.1%.
The average high in Roselle Park is 63.7° and the average low is 44.7°.
Roselle Park SnackAbility
Overall SnackAbility
Roselle Park, NJ Crime Report
Crime in Roselle Park summary. We use data from the FBI to determine the crime rates in Roselle Park. Key points include:
There were 106 total crimes in Roselle Park in the last reporting year.
The overall crime rate per 100,000 people in Roselle Park is 745.8 / 100k people.
The violent crime rate per 100,000 people in Roselle Park is 35.2 / 100k people.
The property crime rate per 100,000 people in Roselle Park is 710.7 / 100k people.
Overall, crime in Roselle Park is -64.81% below the national average.
Total Crimes
Below National Average
Crime In Roselle Park Comparison Table
| Statistic | Count Raw |
Roselle Park / 100k People |
New Jersey / 100k People |
National / 100k People |
|---|---|---|---|---|
| Total Crimes Per 100K | 106 | 745.8 | 1,645.1 | 2,119.2 |
| Violent Crime | 5 | 35.2 | 217.7 | 359.0 |
| Murder | 0 | 0.0 | 2.3 | 5.0 |
| Robbery | 1 | 7.0 | 49.3 | 61.0 |
| Aggravated Assault | 4 | 28.1 | 148.8 | 256.0 |
| Property Crime | 101 | 710.7 | 1,427.3 | 1,760.0 |
| Burglary | 8 | 56.3 | 145.3 | 229.0 |
| Larceny | 88 | 619.2 | 1,119.4 | 1,272.0 |
| Car Theft | 5 | 35.2 | 162.6 | 259.0 |
Roselle Park, NJ Cost Of Living
Cost of living in Roselle Park summary. We use data on the cost of living to determine how expensive it is to live in Roselle Park. Real estate prices drive most of the variance in cost of living around New Jersey. Key points include:
The cost of living in Roselle Park is 122 with 100 being average.
The cost of living in Roselle Park is 1.2x higher than the national average.
The median home value in Roselle Park is $541,245.
The median income in Roselle Park is $104,418.
Roselle Park's Overall Cost Of Living
Higher Than The National Average
Cost Of Living In Roselle Park Comparison Table
| Living Expense | Roselle Park | New Jersey | National Average | |
|---|---|---|---|---|
| Overall | 122 | 122 | 100 | |
| Services | 109 | 108 | 100 | |
| Groceries | 102 | 104 | 100 | |
| Health | 97 | 99 | 100 | |
| Housing | 154 | 159 | 100 | |
| Transportation | 107 | 101 | 100 | |
| Utilities | 112 | 107 | 100 | |
Roselle Park, NJ Weather
The average high in Roselle Park is 63.7° and the average low is 44.7°.
There are 80.5 days of precipitation each year.
Expect an average of 48.4 inches of precipitation each year with 25.5 inches of snow.
| Stat | Roselle Park |
|---|---|
| Average Annual High | 63.7 |
| Average Annual Low | 44.7 |
| Annual Precipitation Days | 80.5 |
| Average Annual Precipitation | 48.4 |
| Average Annual Snowfall | 25.5 |
Average High
Days of Rain
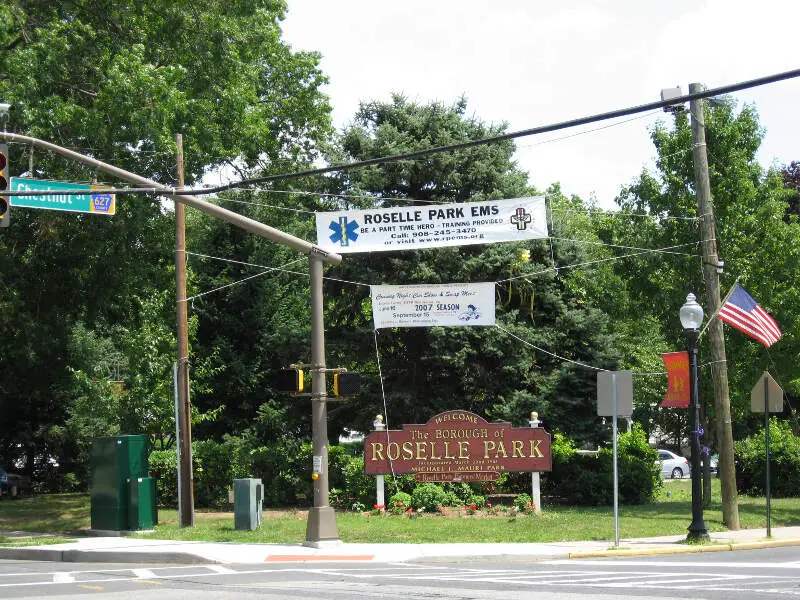
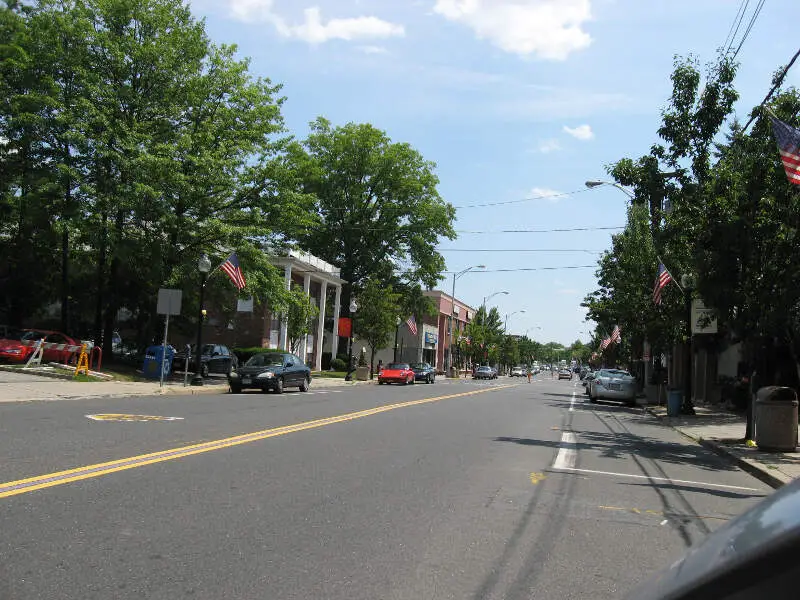
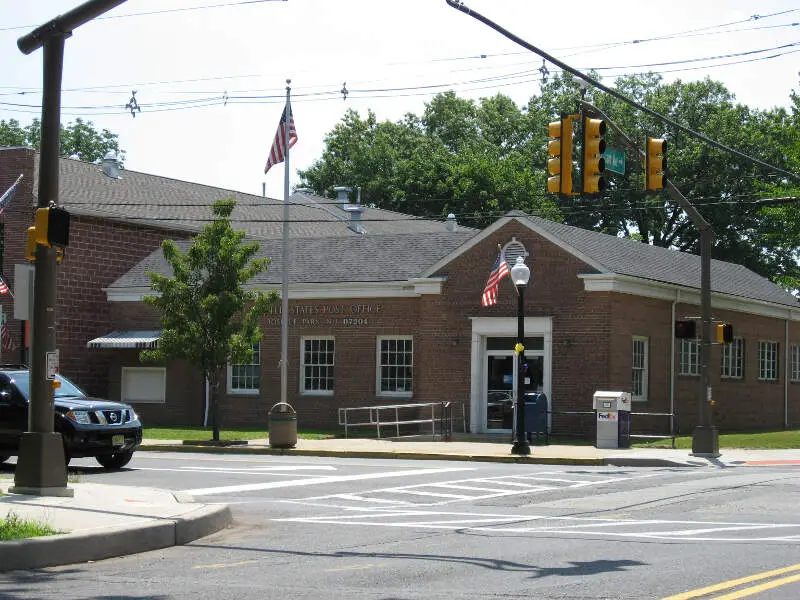
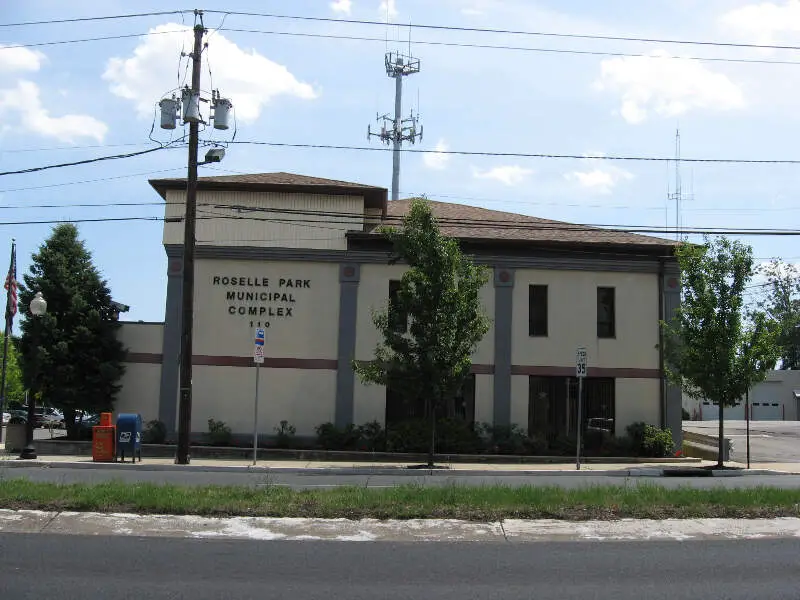
Roselle Park, NJ Photos
Rankings for Roselle Park in New Jersey


Locations Around Roselle Park
Map Of Roselle Park, NJ
Best Places Around Roselle Park
Lincoln Park, NJ
Population 10,901
Martinsville, NJ
Population 12,016
Florham Park, NJ
Population 13,134
Hasbrouck Heights, NJ
Population 12,067
Westfield, NJ
Population 30,760
Boonton, NJ
Population 8,803
Green Knoll, NJ
Population 6,664
Wood-Ridge, NJ
Population 10,094
Middlesex, NJ
Population 14,518
Leonia, NJ
Population 9,300
Roselle Park Demographics And Statistics
Population over time in Roselle Park
The current population in Roselle Park is 13,965. The population has increased 6.0% from 2010.
| Year | Population | % Change |
|---|---|---|
| 2023 | 13,965 | 0.0% |
| 2022 | 13,964 | -0.1% |
| 2021 | 13,973 | 2.9% |
| 2020 | 13,574 | -0.1% |
| 2019 | 13,581 | 0.1% |
| 2018 | 13,568 | -1.0% |
| 2017 | 13,709 | 1.1% |
| 2016 | 13,560 | 0.0% |
| 2015 | 13,555 | 0.7% |
| 2014 | 13,465 | 0.6% |
| 2013 | 13,384 | 0.6% |
| 2012 | 13,310 | 0.7% |
| 2011 | 13,214 | 0.3% |
| 2010 | 13,179 | - |
Race / Ethnicity in Roselle Park
Roselle Park is:
37.0% White with 5,170 White residents.
9.4% African American with 1,317 African American residents.
0.0% American Indian with 0 American Indian residents.
13.2% Asian with 1,850 Asian residents.
0.0% Hawaiian with 0 Hawaiian residents.
1.8% Other with 253 Other residents.
2.1% Two Or More with 288 Two Or More residents.
36.4% Hispanic with 5,087 Hispanic residents.
| Race | Roselle Park | NJ | USA |
|---|---|---|---|
| White | 37.0% | 51.9% | 58.2% |
| African American | 9.4% | 12.3% | 12.0% |
| American Indian | 0.0% | 0.1% | 0.5% |
| Asian | 13.2% | 9.8% | 5.7% |
| Hawaiian | 0.0% | 0.0% | 0.2% |
| Other | 1.8% | 0.8% | 0.5% |
| Two Or More | 2.1% | 3.2% | 3.9% |
| Hispanic | 36.4% | 21.9% | 19.0% |
Gender in Roselle Park
Roselle Park is 50.4% female with 7,037 female residents.
Roselle Park is 49.6% male with 6,927 male residents.
| Gender | Roselle Park | NJ | USA |
|---|---|---|---|
| Female | 50.4% | 50.8% | 50.5% |
| Male | 49.6% | 49.2% | 49.5% |
Highest level of educational attainment in Roselle Park for adults over 25
5.0% of adults in Roselle Park completed < 9th grade.
4.0% of adults in Roselle Park completed 9-12th grade.
27.0% of adults in Roselle Park completed high school / ged.
18.0% of adults in Roselle Park completed some college.
7.0% of adults in Roselle Park completed associate's degree.
23.0% of adults in Roselle Park completed bachelor's degree.
13.0% of adults in Roselle Park completed master's degree.
2.0% of adults in Roselle Park completed professional degree.
1.0% of adults in Roselle Park completed doctorate degree.
| Education | Roselle Park | NJ | USA |
|---|---|---|---|
| < 9th Grade | 5.0% | 3.0% | 5.0% |
| 9-12th Grade | 4.0% | 5.0% | 6.0% |
| High School / GED | 27.0% | 26.0% | 26.0% |
| Some College | 18.0% | 15.0% | 19.0% |
| Associate's Degree | 7.0% | 7.0% | 9.0% |
| Bachelor's Degree | 23.0% | 26.0% | 21.0% |
| Master's Degree | 13.0% | 13.0% | 10.0% |
| Professional Degree | 2.0% | 3.0% | 2.0% |
| Doctorate Degree | 1.0% | 2.0% | 2.0% |
Household Income For Roselle Park, New Jersey
1.1% of households in Roselle Park earn Less than $10,000.
0.8% of households in Roselle Park earn $10,000 to $14,999.
2.6% of households in Roselle Park earn $15,000 to $24,999.
3.3% of households in Roselle Park earn $25,000 to $34,999.
8.9% of households in Roselle Park earn $35,000 to $49,999.
18.4% of households in Roselle Park earn $50,000 to $74,999.
11.6% of households in Roselle Park earn $75,000 to $99,999.
19.3% of households in Roselle Park earn $100,000 to $149,999.
18.4% of households in Roselle Park earn $150,000 to $199,999.
15.5% of households in Roselle Park earn $200,000 or more.
| Income | Roselle Park | NJ | USA |
|---|---|---|---|
| Less than $10,000 | 1.1% | 4.0% | 4.9% |
| $10,000 to $14,999 | 0.8% | 2.9% | 3.6% |
| $15,000 to $24,999 | 2.6% | 5.0% | 6.6% |
| $25,000 to $34,999 | 3.3% | 5.3% | 6.8% |
| $35,000 to $49,999 | 8.9% | 8.0% | 10.4% |
| $50,000 to $74,999 | 18.4% | 12.9% | 15.7% |
| $75,000 to $99,999 | 11.6% | 11.4% | 12.7% |
| $100,000 to $149,999 | 19.3% | 18.0% | 17.4% |
| $150,000 to $199,999 | 18.4% | 11.7% | 9.3% |
| $200,000 or more | 15.5% | 20.7% | 12.6% |


