Rumson, NJ
Demographics And Statistics
Living In Rumson, New Jersey Summary
Life in Rumson research summary. HomeSnacks has been using Saturday Night Science to research the quality of life in Rumson over the past nine years using Census, FBI, Zillow, and other primary data sources. Based on the most recently available data, we found the following about life in Rumson:
The population in Rumson is 7,265.
The median home value in Rumson is $2,100,378.
The median income in Rumson is $250,001.
The cost of living in Rumson is 239 which is 2.4x higher than the national average.
The median rent in Rumson is $2,351.
The unemployment rate in Rumson is 4.8%.
The poverty rate in Rumson is 3.2%.
The average high in Rumson is 62.0° and the average low is 46.1°.
Rumson SnackAbility
Overall SnackAbility
Rumson, NJ Crime Report
Crime in Rumson summary. We use data from the FBI to determine the crime rates in Rumson. Key points include:
There were 28 total crimes in Rumson in the last reporting year.
The overall crime rate per 100,000 people in Rumson is 392.9 / 100k people.
The violent crime rate per 100,000 people in Rumson is 42.1 / 100k people.
The property crime rate per 100,000 people in Rumson is 350.8 / 100k people.
Overall, crime in Rumson is -81.46% below the national average.
Total Crimes
Below National Average
Crime In Rumson Comparison Table
| Statistic | Count Raw |
Rumson / 100k People |
New Jersey / 100k People |
National / 100k People |
|---|---|---|---|---|
| Total Crimes Per 100K | 28 | 392.9 | 1,645.1 | 2,119.2 |
| Violent Crime | 3 | 42.1 | 217.7 | 359.0 |
| Murder | 0 | 0.0 | 2.3 | 5.0 |
| Robbery | 0 | 0.0 | 49.3 | 61.0 |
| Aggravated Assault | 3 | 42.1 | 148.8 | 256.0 |
| Property Crime | 25 | 350.8 | 1,427.3 | 1,760.0 |
| Burglary | 5 | 70.2 | 145.3 | 229.0 |
| Larceny | 19 | 266.6 | 1,119.4 | 1,272.0 |
| Car Theft | 1 | 14.0 | 162.6 | 259.0 |
Rumson, NJ Cost Of Living
Cost of living in Rumson summary. We use data on the cost of living to determine how expensive it is to live in Rumson. Real estate prices drive most of the variance in cost of living around New Jersey. Key points include:
The cost of living in Rumson is 239 with 100 being average.
The cost of living in Rumson is 2.4x higher than the national average.
The median home value in Rumson is $2,100,378.
The median income in Rumson is $250,001.
Rumson's Overall Cost Of Living
Higher Than The National Average
Cost Of Living In Rumson Comparison Table
| Living Expense | Rumson | New Jersey | National Average | |
|---|---|---|---|---|
| Overall | 239 | 122 | 100 | |
| Services | 129 | 108 | 100 | |
| Groceries | 112 | 104 | 100 | |
| Health | 119 | 99 | 100 | |
| Housing | 525 | 159 | 100 | |
| Transportation | 116 | 101 | 100 | |
| Utilities | 100 | 107 | 100 | |
Rumson, NJ Weather
The average high in Rumson is 62.0° and the average low is 46.1°.
There are 77.4 days of precipitation each year.
Expect an average of 46.2 inches of precipitation each year with 24.6 inches of snow.
| Stat | Rumson |
|---|---|
| Average Annual High | 62.0 |
| Average Annual Low | 46.1 |
| Annual Precipitation Days | 77.4 |
| Average Annual Precipitation | 46.2 |
| Average Annual Snowfall | 24.6 |
Average High
Days of Rain
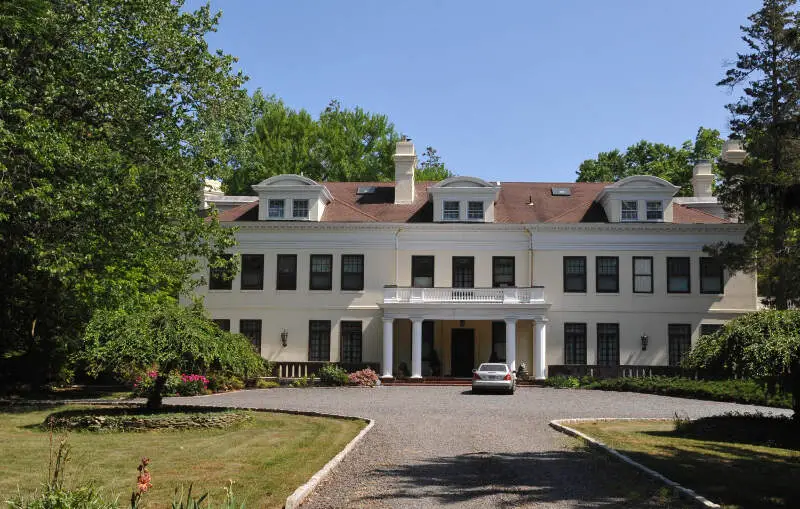
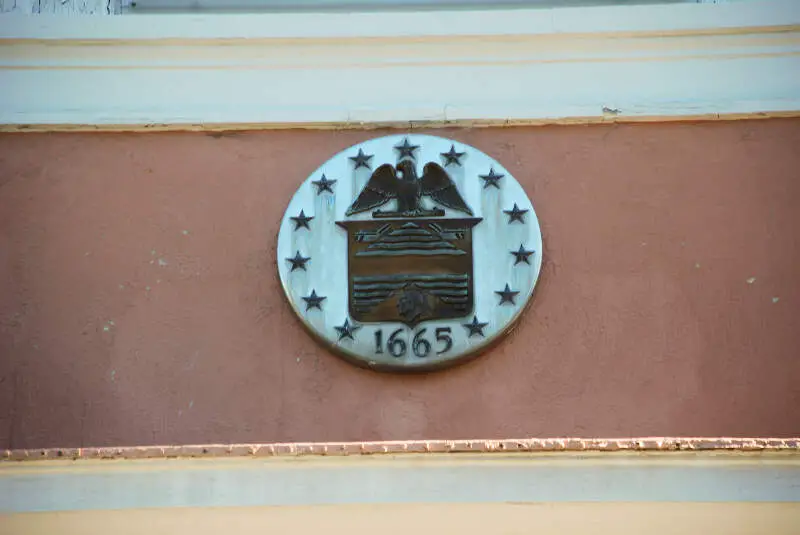
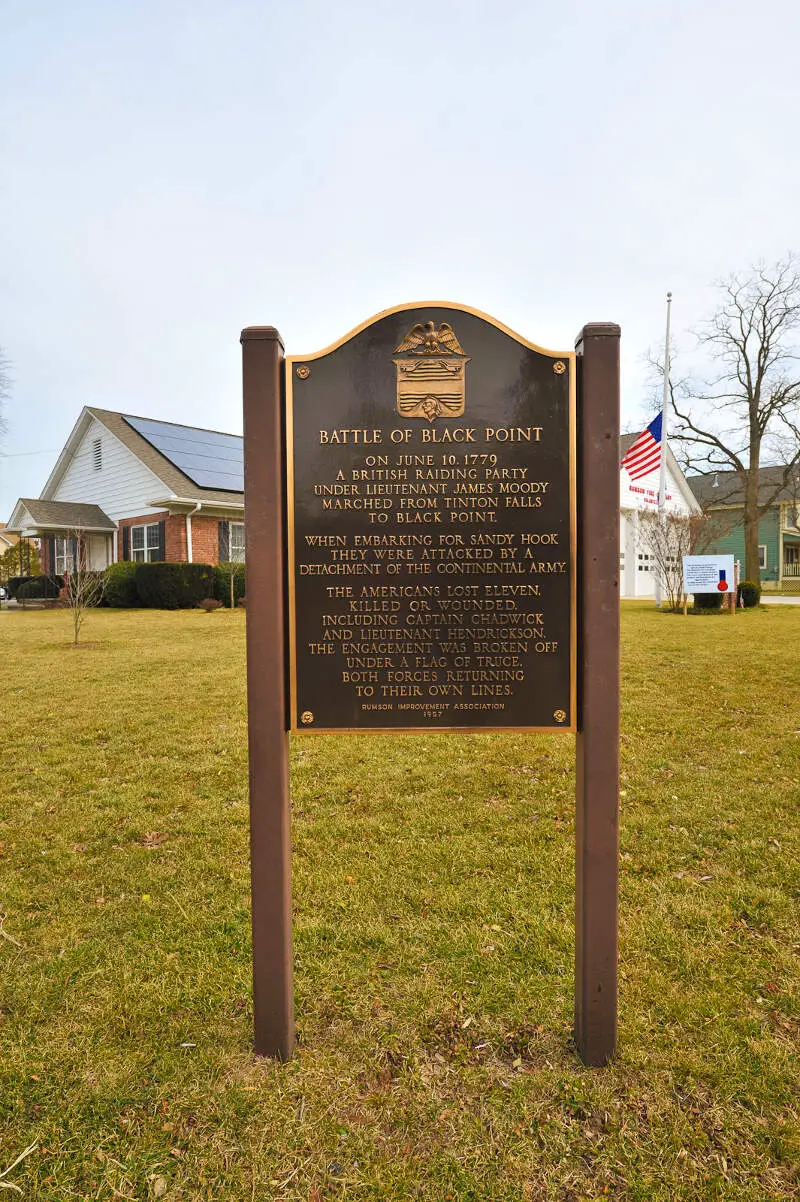
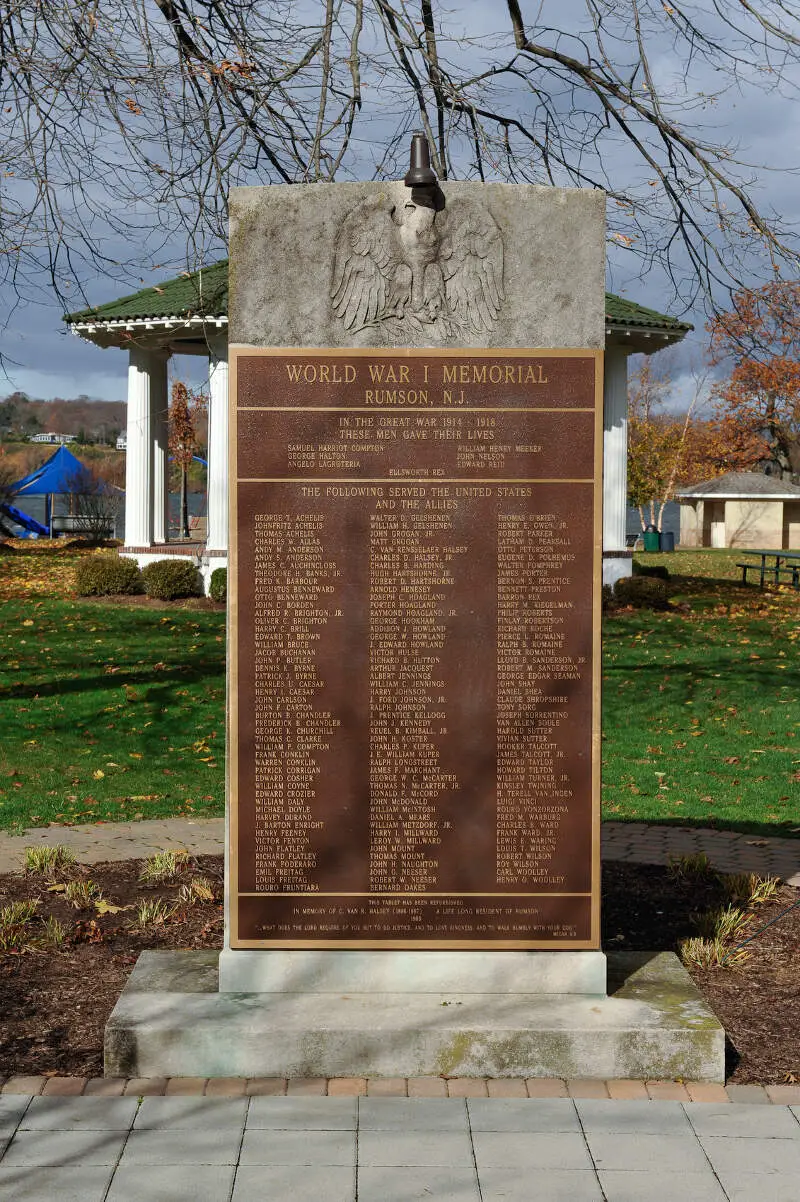
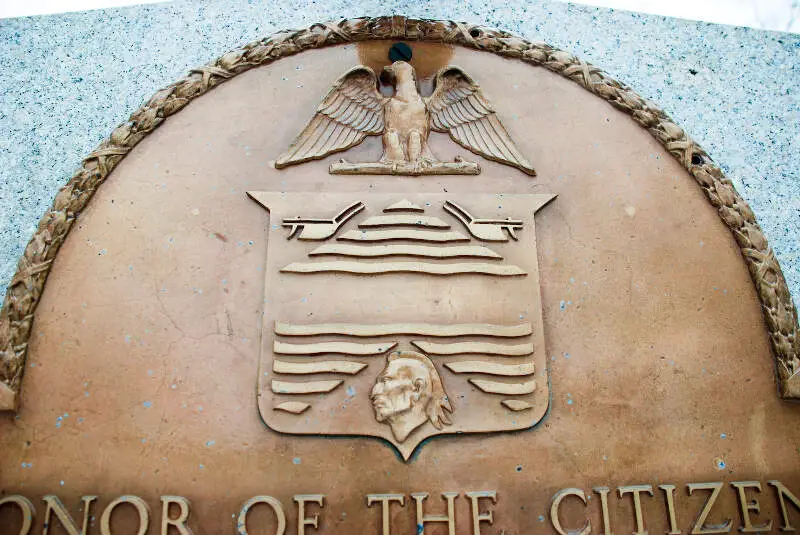
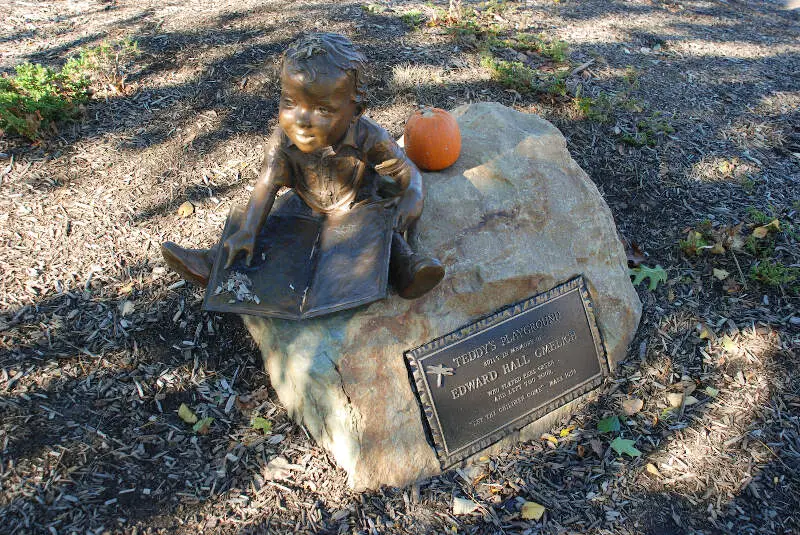
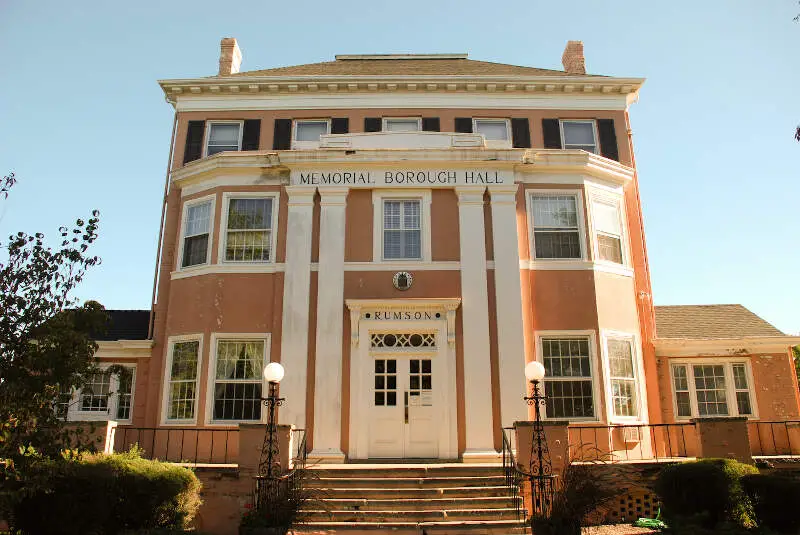
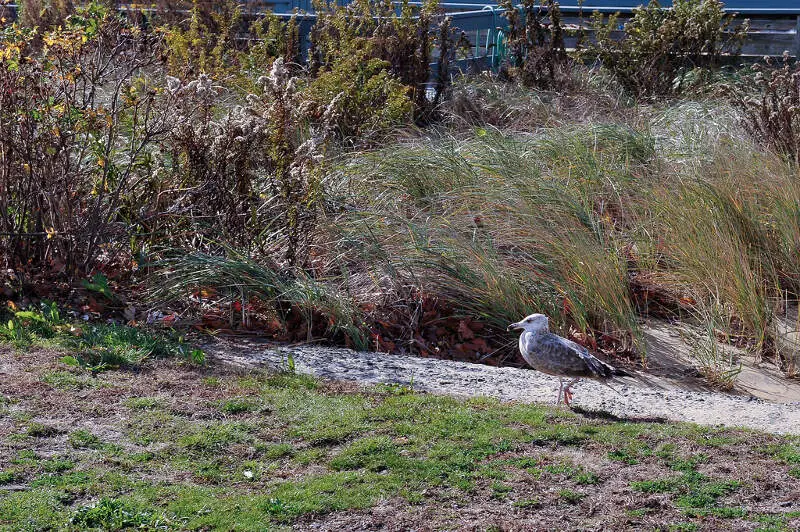
Rumson, NJ Photos
Rankings for Rumson in New Jersey


Locations Around Rumson
Map Of Rumson, NJ
Best Places Around Rumson
Ramtown, NJ
Population 6,410
Little Silver, NJ
Population 6,096
Strathmore, NJ
Population 6,593
Yorketown, NJ
Population 7,265
West Freehold, NJ
Population 14,233
Lincroft, NJ
Population 6,901
Tinton Falls, NJ
Population 19,252
Freehold, NJ
Population 12,504
East Freehold, NJ
Population 5,381
Old Bridge, NJ
Population 28,015
Rumson Demographics And Statistics
Population over time in Rumson
The current population in Rumson is 7,265. The population has increased 1.8% from 2010.
| Year | Population | % Change |
|---|---|---|
| 2023 | 7,265 | -0.3% |
| 2022 | 7,285 | -0.1% |
| 2021 | 7,292 | 7.9% |
| 2020 | 6,757 | -0.5% |
| 2019 | 6,792 | -0.2% |
| 2018 | 6,805 | -1.0% |
| 2017 | 6,874 | -0.1% |
| 2016 | 6,878 | -1.6% |
| 2015 | 6,993 | -0.7% |
| 2014 | 7,045 | -0.3% |
| 2013 | 7,065 | -0.5% |
| 2012 | 7,098 | -0.3% |
| 2011 | 7,122 | -0.3% |
| 2010 | 7,140 | - |
Race / Ethnicity in Rumson
Rumson is:
93.2% White with 6,770 White residents.
0.1% African American with 5 African American residents.
0.0% American Indian with 0 American Indian residents.
0.6% Asian with 41 Asian residents.
0.0% Hawaiian with 0 Hawaiian residents.
0.4% Other with 26 Other residents.
2.1% Two Or More with 150 Two Or More residents.
3.8% Hispanic with 273 Hispanic residents.
| Race | Rumson | NJ | USA |
|---|---|---|---|
| White | 93.2% | 51.9% | 58.2% |
| African American | 0.1% | 12.3% | 12.0% |
| American Indian | 0.0% | 0.1% | 0.5% |
| Asian | 0.6% | 9.8% | 5.7% |
| Hawaiian | 0.0% | 0.0% | 0.2% |
| Other | 0.4% | 0.8% | 0.5% |
| Two Or More | 2.1% | 3.2% | 3.9% |
| Hispanic | 3.8% | 21.9% | 19.0% |
Gender in Rumson
Rumson is 48.2% female with 3,499 female residents.
Rumson is 51.8% male with 3,765 male residents.
| Gender | Rumson | NJ | USA |
|---|---|---|---|
| Female | 48.2% | 50.8% | 50.5% |
| Male | 51.8% | 49.2% | 49.5% |
Highest level of educational attainment in Rumson for adults over 25
-1.0% of adults in Rumson completed < 9th grade.
1.0% of adults in Rumson completed 9-12th grade.
7.0% of adults in Rumson completed high school / ged.
10.0% of adults in Rumson completed some college.
4.0% of adults in Rumson completed associate's degree.
47.0% of adults in Rumson completed bachelor's degree.
22.0% of adults in Rumson completed master's degree.
7.0% of adults in Rumson completed professional degree.
3.0% of adults in Rumson completed doctorate degree.
| Education | Rumson | NJ | USA |
|---|---|---|---|
| < 9th Grade | -1.0% | 3.0% | 5.0% |
| 9-12th Grade | 1.0% | 5.0% | 6.0% |
| High School / GED | 7.0% | 26.0% | 26.0% |
| Some College | 10.0% | 15.0% | 19.0% |
| Associate's Degree | 4.0% | 7.0% | 9.0% |
| Bachelor's Degree | 47.0% | 26.0% | 21.0% |
| Master's Degree | 22.0% | 13.0% | 10.0% |
| Professional Degree | 7.0% | 3.0% | 2.0% |
| Doctorate Degree | 3.0% | 2.0% | 2.0% |
Household Income For Rumson, New Jersey
1.1% of households in Rumson earn Less than $10,000.
0.5% of households in Rumson earn $10,000 to $14,999.
2.3% of households in Rumson earn $15,000 to $24,999.
3.0% of households in Rumson earn $25,000 to $34,999.
2.0% of households in Rumson earn $35,000 to $49,999.
5.1% of households in Rumson earn $50,000 to $74,999.
5.8% of households in Rumson earn $75,000 to $99,999.
9.0% of households in Rumson earn $100,000 to $149,999.
9.8% of households in Rumson earn $150,000 to $199,999.
61.4% of households in Rumson earn $200,000 or more.
| Income | Rumson | NJ | USA |
|---|---|---|---|
| Less than $10,000 | 1.1% | 4.0% | 4.9% |
| $10,000 to $14,999 | 0.5% | 2.9% | 3.6% |
| $15,000 to $24,999 | 2.3% | 5.0% | 6.6% |
| $25,000 to $34,999 | 3.0% | 5.3% | 6.8% |
| $35,000 to $49,999 | 2.0% | 8.0% | 10.4% |
| $50,000 to $74,999 | 5.1% | 12.9% | 15.7% |
| $75,000 to $99,999 | 5.8% | 11.4% | 12.7% |
| $100,000 to $149,999 | 9.0% | 18.0% | 17.4% |
| $150,000 to $199,999 | 9.8% | 11.7% | 9.3% |
| $200,000 or more | 61.4% | 20.7% | 12.6% |


