Niagara Falls SnackAbility
Overall SnackAbility
Crime in Niagara Falls summary. We use data from the FBI to determine the crime rates in Niagara Falls. Key points include:
There were 1,565 total crimes in Niagara Falls in the last reporting year.
The overall crime rate per 100,000 people in Niagara Falls is 3,308.9 / 100k people.
The violent crime rate per 100,000 people in Niagara Falls is 501.1 / 100k people.
The property crime rate per 100,000 people in Niagara Falls is 2,807.8 / 100k people.
Overall, crime in Niagara Falls is 56.14% above the national average.
Total Crimes
Above National Average
Crime In Niagara Falls Comparison Table
| Statistic | Count Raw |
Niagara Falls / 100k People |
New York / 100k People |
National / 100k People |
|---|---|---|---|---|
| Total Crimes Per 100K | 1,565 | 3,308.9 | 2,099.7 | 2,119.2 |
| Violent Crime | 237 | 501.1 | 380.2 | 359.0 |
| Murder | 3 | 6.3 | 2.7 | 5.0 |
| Robbery | 44 | 93.0 | 96.1 | 61.0 |
| Aggravated Assault | 186 | 393.3 | 259.6 | 256.0 |
| Property Crime | 1,328 | 2,807.8 | 1,719.5 | 1,760.0 |
| Burglary | 155 | 327.7 | 136.6 | 229.0 |
| Larceny | 1,035 | 2,188.3 | 1,432.8 | 1,272.0 |
| Car Theft | 138 | 291.8 | 150.2 | 259.0 |
Source: FBI Uniform Crime Reporting (2024)
Cost of living in Niagara Falls summary. We use data on the cost of living to determine how expensive it is to live in Niagara Falls. Real estate prices drive most of the variance in cost of living around New York. Key points include:
The cost of living in Niagara Falls is 93 with 100 being average.
The cost of living in Niagara Falls is 0.9x lower than the national average.
The median home value in Niagara Falls is $166,405.
The median income in Niagara Falls is $49,101.
Niagara Falls's Overall Cost Of Living
Lower Than The National Average
Cost Of Living In Niagara Falls Comparison Table
| Living Expense | Niagara Falls | New York | National Average |
|---|---|---|---|
| Overall | 93 | 121 | 100 |
| Services | 106 | 105 | 100 |
| Groceries | 108 | 108 | 100 |
| Health | 53 | 143 | 100 |
| Housing | 112 | 112 | 100 |
| Transportation | 114 | 114 | 100 |
| Utilities | 112 | 111 | 100 |
Source: Cost of living index, normalized to US average = 100
Niagara Falls, NY Weather
The average high in Niagara Falls is 57.0° and the average low is 39.8°.
There are 85.2 days of precipitation each year.
Expect an average of 36.3 inches of precipitation each year with 80.2 inches of snow.
| Stat | Niagara Falls |
|---|---|
| Average Annual High | 57.0 |
| Average Annual Low | 39.8 |
| Annual Precipitation Days | 85.2 |
| Average Annual Precipitation | 36.3 |
| Average Annual Snowfall | 80.2 |
Average High
Days of Rain
Source: NOAA climate normals (30-year)
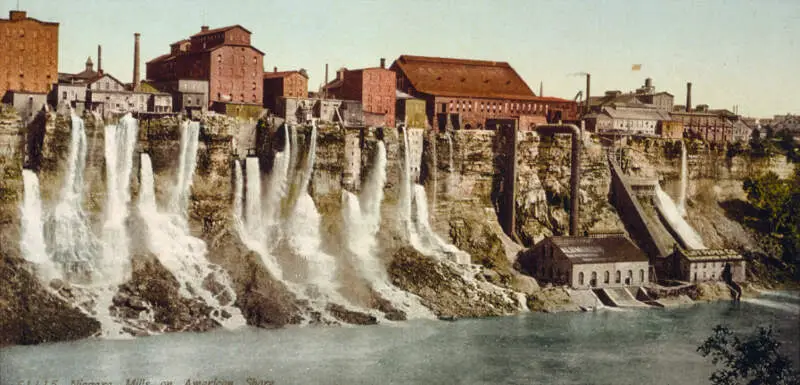
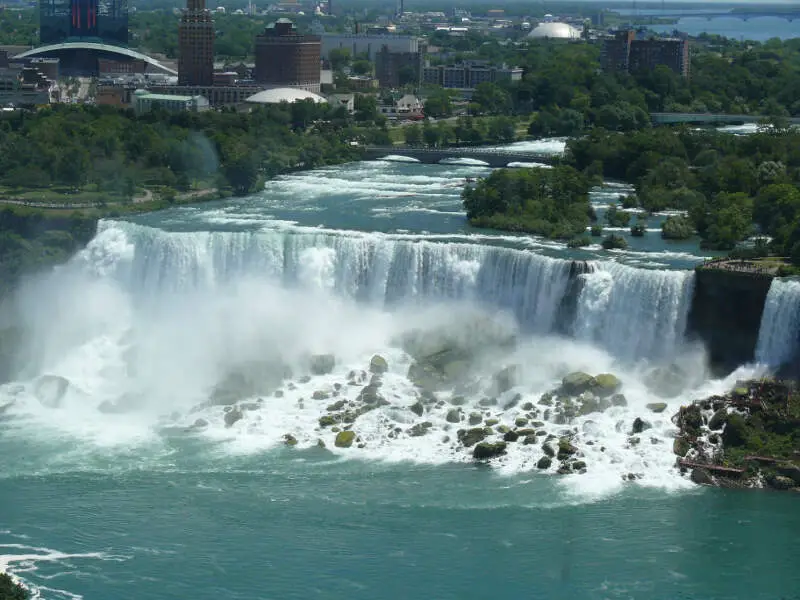
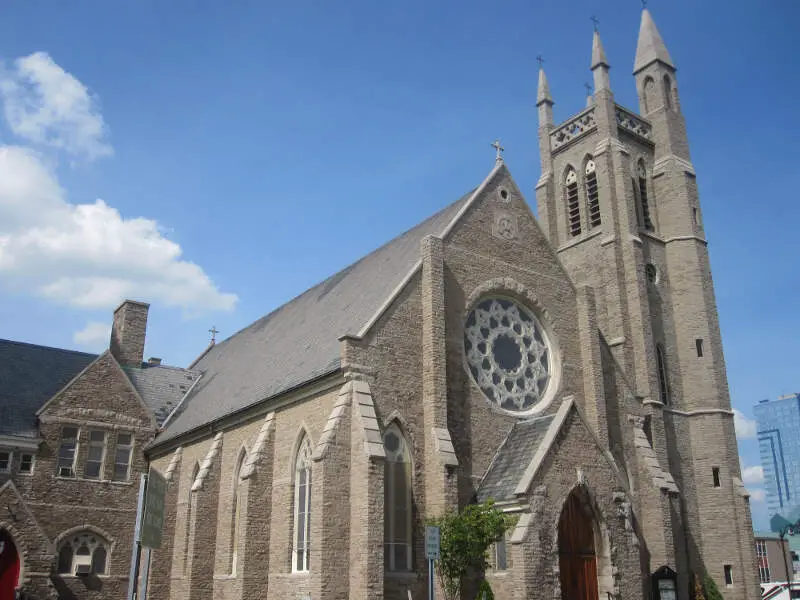
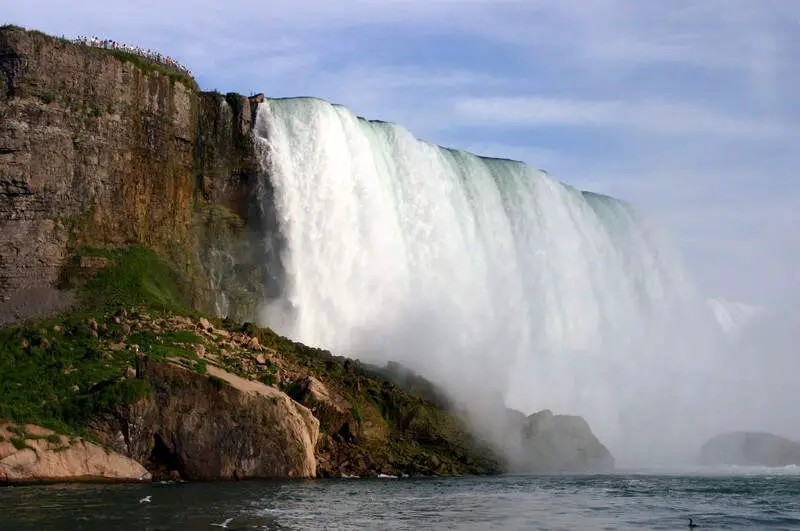
Niagara Falls, NY Photos
2 Reviews & Comments About Niagara Falls

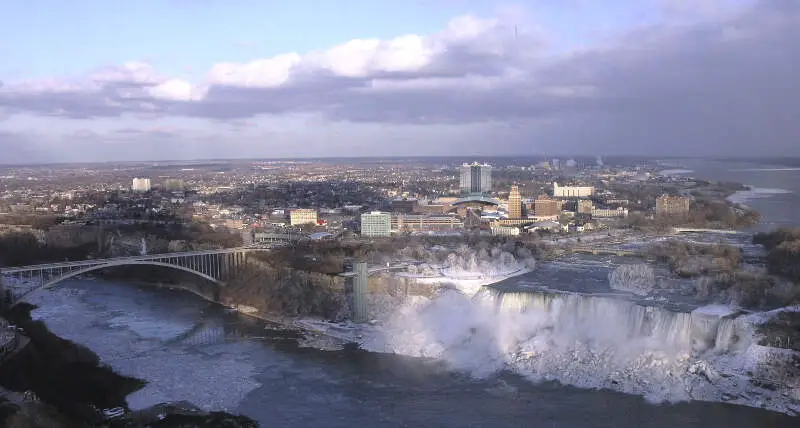
I love visiting Niagara Falls, NY. The scenes of the falls along with the Niagara River are just amazing. There is so much to do for free, and with the casino, the aquarium, hiking trails, and so much more nearby, it's a perfect getaway.
The fireworks every night are wonderful. I also loved the aquarium; it's small, but the sea lion show is really cool. Just walking along the Niagara River and on Goat Island and the Three Sisters Islands is really cool.
Unfortunately I was born and raised here and this city has gone downhill so far it is truly depressing and disheartening. There isn't anything for the youth to do but get into trouble following behind millennials, if their not doing that then their busy getting pregnant which I can't figure out which one is worse.
My favorite places was the Center on Center Ave., Rainbow Mall, the Wintergarden, Ice Skating Ring, Splash Park and the Black Experience in the Summer until ALL of them got closed down.
Rankings & Articles For Niagara Falls


Locations Around Niagara Falls
Map Of Niagara Falls, NY
Best Places Around Niagara Falls
Harris Hill, NY
Population 6,069
Eggertsville, NY
Population 14,894
Williamsville, NY
Population 5,469
Kenmore, NY
Population 15,044
Cheektowaga, NY
Population 76,056
North Tonawanda, NY
Population 30,198
Niagara Falls Demographics And Statistics
Population over time in Niagara Falls
The current population in Niagara Falls is 47,987. The population has decreased 5.7% from 2010.
| Year | Population | % Change |
|---|---|---|
| 2024 | 47,987 | -0.4% |
| 2023 | 48,198 | -0.6% |
| 2022 | 48,502 | -0.5% |
| 2021 | 48,763 | 1.6% |
| 2020 | 47,978 | -0.6% |
| 2019 | 48,252 | -0.8% |
| 2018 | 48,661 | -0.6% |
| 2017 | 48,976 | -0.4% |
| 2016 | 49,180 | -0.5% |
| 2015 | 49,435 | -0.5% |
| 2014 | 49,679 | -0.5% |
| 2013 | 49,920 | -0.6% |
| 2012 | 50,214 | -0.7% |
| 2011 | 50,570 | -0.6% |
| 2010 | 50,891 | - |
Race / Ethnicity in Niagara Falls
See the full breakdown
Niagara Falls is:
62.9% White with 30,197 White residents.
17.8% African American with 8,565 African American residents.
0.7% American Indian with 351 American Indian residents.
2.4% Asian with 1,146 Asian residents.
0.0% Hawaiian with 12 Hawaiian residents.
0.7% Other with 341 Other residents.
7.8% Two Or More with 3,738 Two Or More residents.
7.6% Hispanic with 3,637 Hispanic residents.
| Race | Niagara Falls | NY | USA |
|---|---|---|---|
| White | 62.9% | 52.8% | 57.4% |
| African American | 17.8% | 13.4% | 11.9% |
| American Indian | 0.7% | 0.2% | 0.5% |
| Asian | 2.4% | 9.0% | 5.9% |
| Hawaiian | 0.0% | 0.0% | 0.2% |
| Other | 0.7% | 1.0% | 0.6% |
| Two Or More | 7.8% | 3.8% | 4.3% |
| Hispanic | 7.6% | 19.8% | 19.3% |
Gender in Niagara Falls
See the full breakdown
Niagara Falls is 50.7% female with 24,325 female residents.
Niagara Falls is 49.3% male with 23,662 male residents.
| Gender | Niagara Falls | NY | USA |
|---|---|---|---|
| Female | 50.7% | 51.2% | 50.5% |
| Male | 49.3% | 48.8% | 49.5% |
Highest level of educational attainment in Niagara Falls for adults over 25
See the full breakdown
3.0% of adults in Niagara Falls completed < 9th grade.
8.0% of adults in Niagara Falls completed 9-12th grade.
38.0% of adults in Niagara Falls completed high school / ged.
17.0% of adults in Niagara Falls completed some college.
11.0% of adults in Niagara Falls completed associate's degree.
14.0% of adults in Niagara Falls completed bachelor's degree.
8.0% of adults in Niagara Falls completed master's degree.
1.0% of adults in Niagara Falls completed professional degree.
0.0% of adults in Niagara Falls completed doctorate degree.
| Education | Niagara Falls | NY | USA |
|---|---|---|---|
| < 9th Grade | 3.0% | 6.0% | 4.0% |
| 9-12th Grade | 8.0% | 6.0% | 6.0% |
| High School / GED | 38.0% | 24.0% | 26.0% |
| Some College | 17.0% | 15.0% | 19.0% |
| Associate's Degree | 11.0% | 9.0% | 9.0% |
| Bachelor's Degree | 14.0% | 22.0% | 22.0% |
| Master's Degree | 8.0% | 13.0% | 10.0% |
| Professional Degree | 1.0% | 3.0% | 2.0% |
| Doctorate Degree | 0.0% | 2.0% | 2.0% |
Household Income For Niagara Falls, New York
See the full breakdown
11.1% of households in Niagara Falls earn Less than $10,000.
5.6% of households in Niagara Falls earn $10,000 to $14,999.
10.7% of households in Niagara Falls earn $15,000 to $24,999.
10.4% of households in Niagara Falls earn $25,000 to $34,999.
13.4% of households in Niagara Falls earn $35,000 to $49,999.
15.9% of households in Niagara Falls earn $50,000 to $74,999.
14.9% of households in Niagara Falls earn $75,000 to $99,999.
10.3% of households in Niagara Falls earn $100,000 to $149,999.
4.3% of households in Niagara Falls earn $150,000 to $199,999.
3.5% of households in Niagara Falls earn $200,000 or more.
| Income | Niagara Falls | NY | USA |
|---|---|---|---|
| Less than $10,000 | 11.1% | 5.8% | 5.0% |
| $10,000 to $14,999 | 5.6% | 3.9% | 3.4% |
| $15,000 to $24,999 | 10.7% | 6.3% | 6.3% |
| $25,000 to $34,999 | 10.4% | 6.2% | 6.6% |
| $35,000 to $49,999 | 13.4% | 8.9% | 10.1% |
| $50,000 to $74,999 | 15.9% | 13.6% | 15.5% |
| $75,000 to $99,999 | 14.9% | 11.4% | 12.6% |
| $100,000 to $149,999 | 10.3% | 16.7% | 17.5% |
| $150,000 to $199,999 | 4.3% | 10.1% | 9.6% |
| $200,000 or more | 3.5% | 17.1% | 13.4% |
Source: U.S. Census ACS 5-year estimates (2024)


