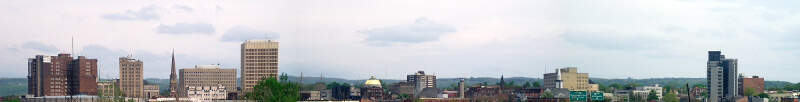
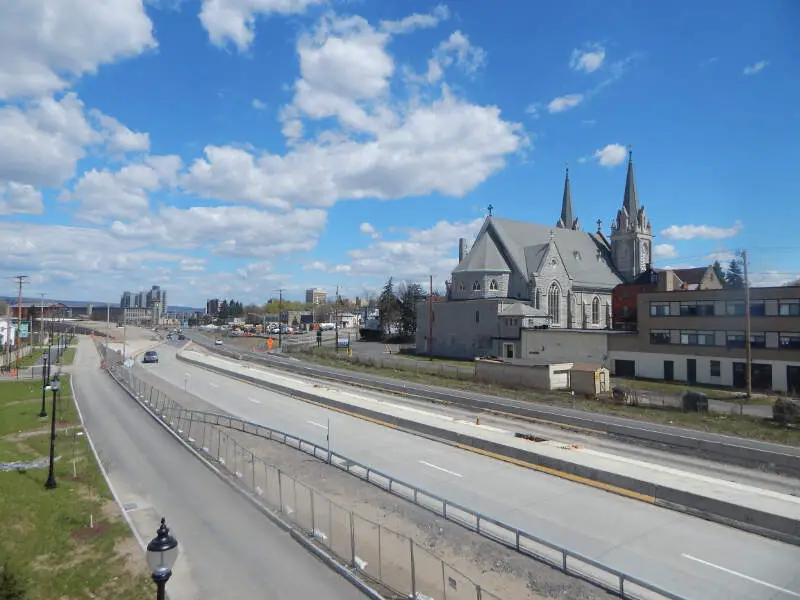
Utica, NY
Demographics And Statistics
Living In Utica, New York Summary
Life in Utica research summary. HomeSnacks has been using Saturday Night Science to research the quality of life in Utica over the past nine years using Census, FBI, Zillow, and other primary data sources. Based on the most recently available data, we found the following about life in Utica:
The population in Utica is 64,440.
The median home value in Utica is $202,181.
The median income in Utica is $51,513.
The cost of living in Utica is 97 which is 1.0x lower than the national average.
The median rent in Utica is $907.
The unemployment rate in Utica is 7.2%.
The poverty rate in Utica is 27.6%.
The average high in Utica is 57.3° and the average low is 37.4°.
Utica SnackAbility
Overall SnackAbility
Utica, NY Crime Report
Crime in Utica summary. We use data from the FBI to determine the crime rates in Utica. Key points include:
There were 2,194 total crimes in Utica in the last reporting year.
The overall crime rate per 100,000 people in Utica is 3,477.1 / 100k people.
The violent crime rate per 100,000 people in Utica is 527.8 / 100k people.
The property crime rate per 100,000 people in Utica is 2,949.4 / 100k people.
Overall, crime in Utica is 64.07% above the national average.
Total Crimes
Above National Average
Crime In Utica Comparison Table
| Statistic | Count Raw |
Utica / 100k People |
New York / 100k People |
National / 100k People |
|---|---|---|---|---|
| Total Crimes Per 100K | 2,194 | 3,477.1 | 2,099.7 | 2,119.2 |
| Violent Crime | 333 | 527.8 | 380.2 | 359.0 |
| Murder | 5 | 7.9 | 2.7 | 5.0 |
| Robbery | 60 | 95.1 | 96.1 | 61.0 |
| Aggravated Assault | 244 | 386.7 | 259.6 | 256.0 |
| Property Crime | 1,861 | 2,949.4 | 1,719.5 | 1,760.0 |
| Burglary | 186 | 294.8 | 136.6 | 229.0 |
| Larceny | 1,583 | 2,508.8 | 1,432.8 | 1,272.0 |
| Car Theft | 92 | 145.8 | 150.2 | 259.0 |
Utica, NY Cost Of Living
Cost of living in Utica summary. We use data on the cost of living to determine how expensive it is to live in Utica. Real estate prices drive most of the variance in cost of living around New York. Key points include:
The cost of living in Utica is 97 with 100 being average.
The cost of living in Utica is 1.0x lower than the national average.
The median home value in Utica is $202,181.
The median income in Utica is $51,513.
Utica's Overall Cost Of Living
Lower Than The National Average
Cost Of Living In Utica Comparison Table
| Living Expense | Utica | New York | National Average | |
|---|---|---|---|---|
| Overall | 97 | 119 | 100 | |
| Services | 117 | 110 | 100 | |
| Groceries | 97 | 103 | 100 | |
| Health | 101 | 101 | 100 | |
| Housing | 62 | 145 | 100 | |
| Transportation | 109 | 105 | 100 | |
| Utilities | 105 | 99 | 100 | |
Utica, NY Weather
The average high in Utica is 57.3° and the average low is 37.4°.
There are 97.4 days of precipitation each year.
Expect an average of 41.7 inches of precipitation each year with 90.8 inches of snow.
| Stat | Utica |
|---|---|
| Average Annual High | 57.3 |
| Average Annual Low | 37.4 |
| Annual Precipitation Days | 97.4 |
| Average Annual Precipitation | 41.7 |
| Average Annual Snowfall | 90.8 |
Average High
Days of Rain
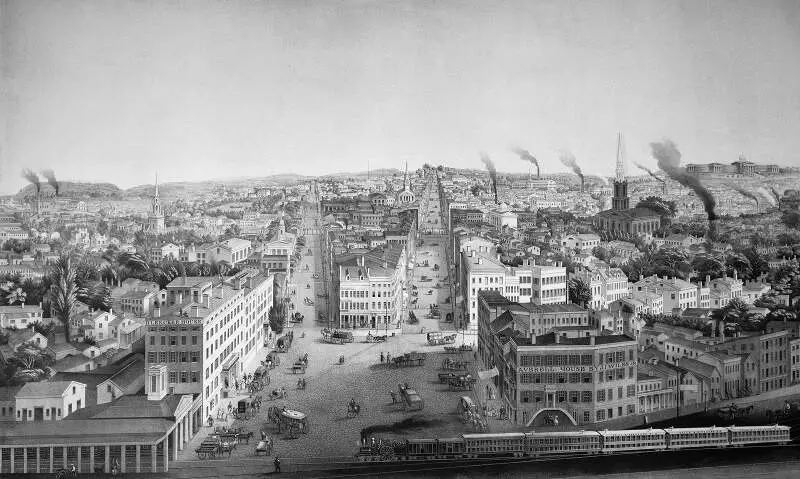
Utica, NY Photos


1 Reviews & Comments About Utica
/5

Mark Keith - None
I lived in Utica. An average s**t show of a city.
Rankings for Utica in New York


Locations Around Utica
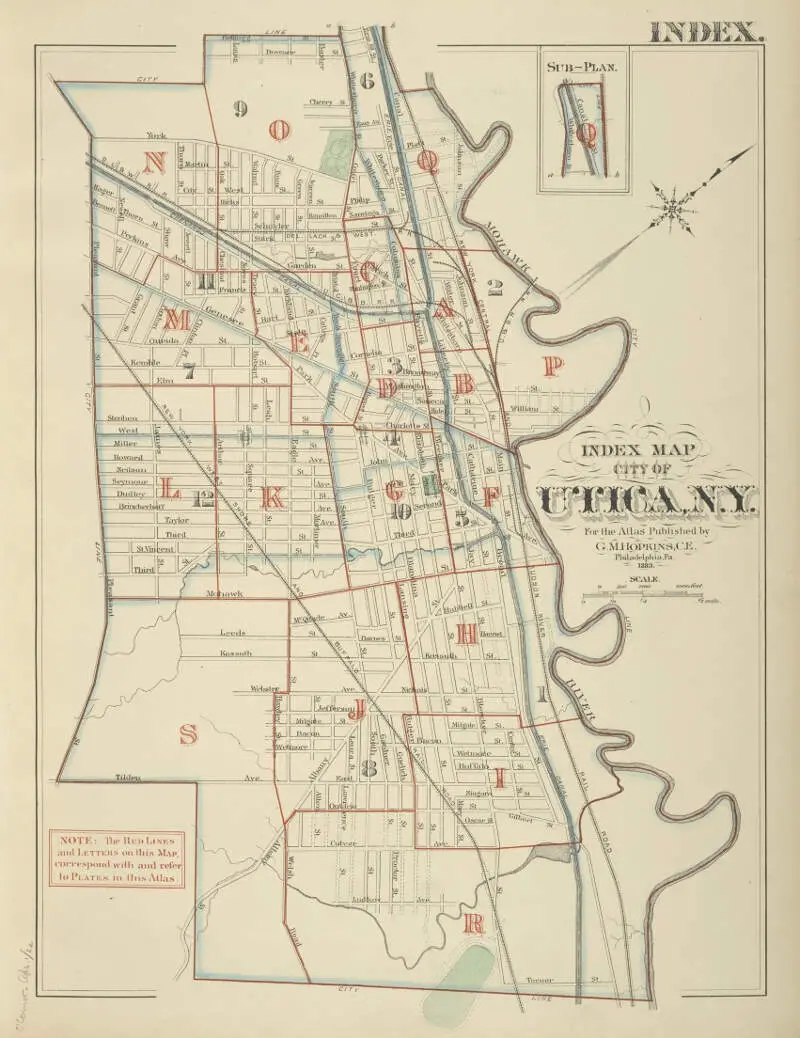
Map Of Utica, NY
Best Places Around Utica
Rome, NY
Population 31,795
Ilion, NY
Population 7,636
Herkimer, NY
Population 7,335
Utica Demographics And Statistics
Population over time in Utica
The current population in Utica is 64,440. The population has increased 4.2% from 2010.
| Year | Population | % Change |
|---|---|---|
| 2023 | 64,440 | -0.4% |
| 2022 | 64,728 | 0.0% |
| 2021 | 64,723 | 7.9% |
| 2020 | 59,984 | -0.6% |
| 2019 | 60,320 | -0.6% |
| 2018 | 60,675 | -0.7% |
| 2017 | 61,114 | -0.4% |
| 2016 | 61,337 | -0.5% |
| 2015 | 61,628 | -0.4% |
| 2014 | 61,852 | -0.2% |
| 2013 | 61,979 | 0.0% |
| 2012 | 61,962 | 0.0% |
| 2011 | 61,957 | 0.2% |
| 2010 | 61,835 | - |
Race / Ethnicity in Utica
Utica is:
54.0% White with 34,774 White residents.
13.4% African American with 8,619 African American residents.
0.2% American Indian with 130 American Indian residents.
11.0% Asian with 7,099 Asian residents.
0.0% Hawaiian with 8 Hawaiian residents.
0.5% Other with 328 Other residents.
6.4% Two Or More with 4,093 Two Or More residents.
14.6% Hispanic with 9,389 Hispanic residents.
| Race | Utica | NY | USA |
|---|---|---|---|
| White | 54.0% | 53.4% | 58.2% |
| African American | 13.4% | 13.6% | 12.0% |
| American Indian | 0.2% | 0.2% | 0.5% |
| Asian | 11.0% | 8.8% | 5.7% |
| Hawaiian | 0.0% | 0.0% | 0.2% |
| Other | 0.5% | 0.9% | 0.5% |
| Two Or More | 6.4% | 3.4% | 3.9% |
| Hispanic | 14.6% | 19.6% | 19.0% |
Gender in Utica
Utica is 51.1% female with 32,900 female residents.
Utica is 48.9% male with 31,539 male residents.
| Gender | Utica | NY | USA |
|---|---|---|---|
| Female | 51.1% | 51.2% | 50.5% |
| Male | 48.9% | 48.8% | 49.5% |
Highest level of educational attainment in Utica for adults over 25
11.0% of adults in Utica completed < 9th grade.
9.0% of adults in Utica completed 9-12th grade.
30.0% of adults in Utica completed high school / ged.
18.0% of adults in Utica completed some college.
11.0% of adults in Utica completed associate's degree.
13.0% of adults in Utica completed bachelor's degree.
6.0% of adults in Utica completed master's degree.
1.0% of adults in Utica completed professional degree.
1.0% of adults in Utica completed doctorate degree.
| Education | Utica | NY | USA |
|---|---|---|---|
| < 9th Grade | 11.0% | 5.0% | 5.0% |
| 9-12th Grade | 9.0% | 6.0% | 6.0% |
| High School / GED | 30.0% | 25.0% | 26.0% |
| Some College | 18.0% | 15.0% | 19.0% |
| Associate's Degree | 11.0% | 9.0% | 9.0% |
| Bachelor's Degree | 13.0% | 22.0% | 21.0% |
| Master's Degree | 6.0% | 13.0% | 10.0% |
| Professional Degree | 1.0% | 3.0% | 2.0% |
| Doctorate Degree | 1.0% | 2.0% | 2.0% |
Household Income For Utica, New York
7.6% of households in Utica earn Less than $10,000.
7.9% of households in Utica earn $10,000 to $14,999.
10.6% of households in Utica earn $15,000 to $24,999.
11.3% of households in Utica earn $25,000 to $34,999.
11.3% of households in Utica earn $35,000 to $49,999.
18.9% of households in Utica earn $50,000 to $74,999.
12.1% of households in Utica earn $75,000 to $99,999.
11.8% of households in Utica earn $100,000 to $149,999.
4.8% of households in Utica earn $150,000 to $199,999.
3.6% of households in Utica earn $200,000 or more.
| Income | Utica | NY | USA |
|---|---|---|---|
| Less than $10,000 | 7.6% | 5.7% | 4.9% |
| $10,000 to $14,999 | 7.9% | 4.1% | 3.6% |
| $15,000 to $24,999 | 10.6% | 6.5% | 6.6% |
| $25,000 to $34,999 | 11.3% | 6.2% | 6.8% |
| $35,000 to $49,999 | 11.3% | 9.1% | 10.4% |
| $50,000 to $74,999 | 18.9% | 13.8% | 15.7% |
| $75,000 to $99,999 | 12.1% | 11.4% | 12.7% |
| $100,000 to $149,999 | 11.8% | 16.8% | 17.4% |
| $150,000 to $199,999 | 4.8% | 10.1% | 9.3% |
| $200,000 or more | 3.6% | 16.4% | 12.6% |


