Groveport, OH
Demographics And Statistics
Living In Groveport, Ohio Summary
Life in Groveport research summary. HomeSnacks has been using Saturday Night Science to research the quality of life in Groveport over the past nine years using Census, FBI, Zillow, and other primary data sources. Based on the most recently available data, we found the following about life in Groveport:
The population in Groveport is 5,916.
The median home value in Groveport is $310,411.
The median income in Groveport is $91,545.
The cost of living in Groveport is 96 which is 1.0x lower than the national average.
The median rent in Groveport is $1,088.
The unemployment rate in Groveport is 1.5%.
The poverty rate in Groveport is 5.9%.
The average high in Groveport is 62.3° and the average low is 43.2°.
Groveport SnackAbility
Overall SnackAbility
Groveport, OH Crime Report
Crime in Groveport summary. We use data from the FBI to determine the crime rates in Groveport. Key points include:
There were 67 total crimes in Groveport in the last reporting year.
The overall crime rate per 100,000 people in Groveport is 1,166.8 / 100k people.
The violent crime rate per 100,000 people in Groveport is 139.3 / 100k people.
The property crime rate per 100,000 people in Groveport is 1,027.5 / 100k people.
Overall, crime in Groveport is -44.94% below the national average.
Total Crimes
Below National Average
Crime In Groveport Comparison Table
| Statistic | Count Raw |
Groveport / 100k People |
Ohio / 100k People |
National / 100k People |
|---|---|---|---|---|
| Total Crimes Per 100K | 67 | 1,166.8 | 1,844.9 | 2,119.2 |
| Violent Crime | 8 | 139.3 | 293.7 | 359.0 |
| Murder | 0 | 0.0 | 5.0 | 5.0 |
| Robbery | 2 | 34.8 | 45.5 | 61.0 |
| Aggravated Assault | 4 | 69.7 | 197.4 | 256.0 |
| Property Crime | 59 | 1,027.5 | 1,551.2 | 1,760.0 |
| Burglary | 3 | 52.2 | 206.0 | 229.0 |
| Larceny | 48 | 835.9 | 1,132.8 | 1,272.0 |
| Car Theft | 8 | 139.3 | 212.5 | 259.0 |
Groveport, OH Cost Of Living
Cost of living in Groveport summary. We use data on the cost of living to determine how expensive it is to live in Groveport. Real estate prices drive most of the variance in cost of living around Ohio. Key points include:
The cost of living in Groveport is 96 with 100 being average.
The cost of living in Groveport is 1.0x lower than the national average.
The median home value in Groveport is $310,411.
The median income in Groveport is $91,545.
Groveport's Overall Cost Of Living
Lower Than The National Average
Cost Of Living In Groveport Comparison Table
| Living Expense | Groveport | Ohio | National Average | |
|---|---|---|---|---|
| Overall | 96 | 93 | 100 | |
| Services | 95 | 101 | 100 | |
| Groceries | 102 | 103 | 100 | |
| Health | 87 | 97 | 100 | |
| Housing | 95 | 74 | 100 | |
| Transportation | 89 | 102 | 100 | |
| Utilities | 96 | 100 | 100 | |
Groveport, OH Weather
The average high in Groveport is 62.3° and the average low is 43.2°.
There are 78.7 days of precipitation each year.
Expect an average of 38.5 inches of precipitation each year with 22.3 inches of snow.
| Stat | Groveport |
|---|---|
| Average Annual High | 62.3 |
| Average Annual Low | 43.2 |
| Annual Precipitation Days | 78.7 |
| Average Annual Precipitation | 38.5 |
| Average Annual Snowfall | 22.3 |
Average High
Days of Rain
Groveport, OH Photos

Rankings for Groveport in Ohio


Locations Around Groveport
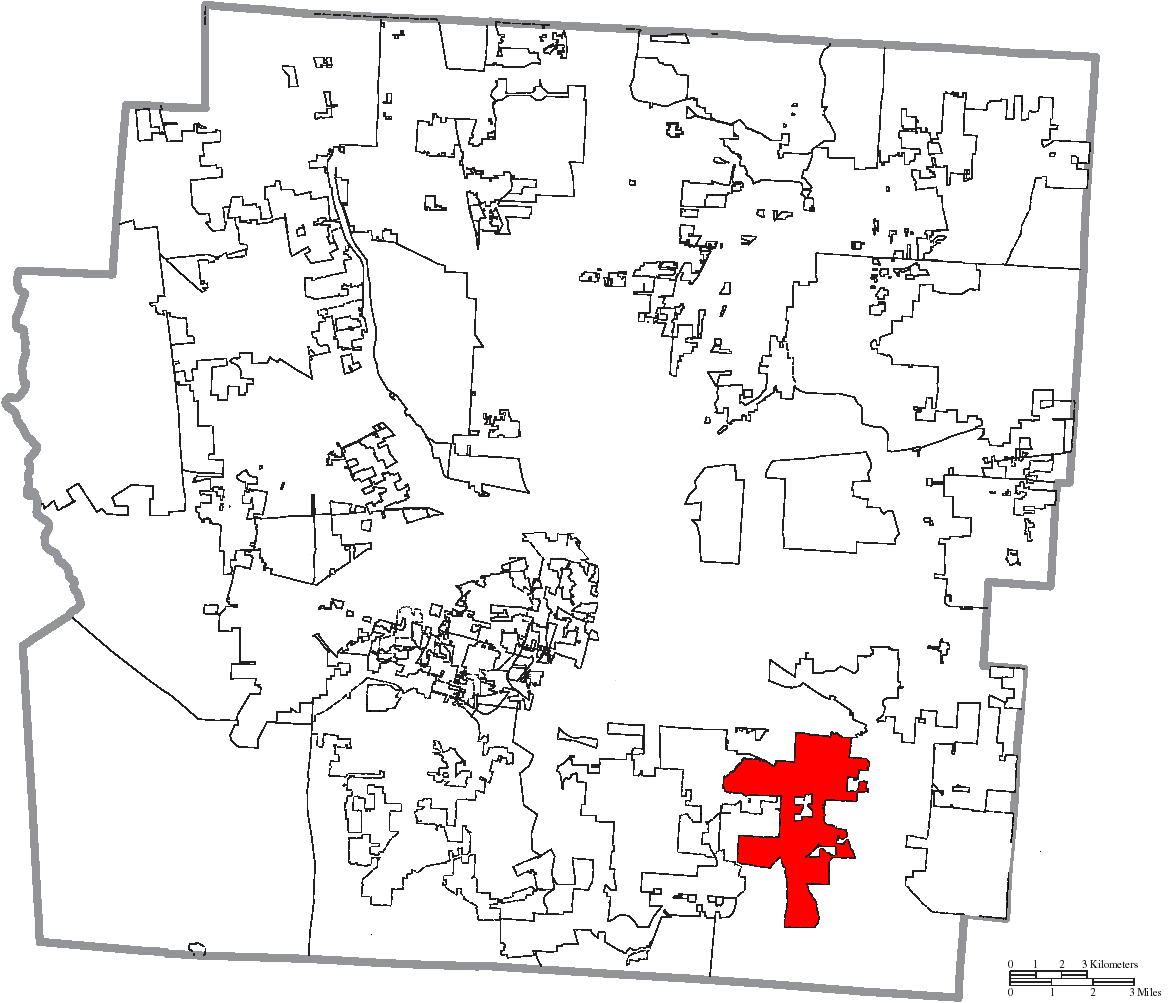
Map Of Groveport, OH
Best Places Around Groveport
Upper Arlington, OH
Population 36,319
Bexley, OH
Population 13,324
Gahanna, OH
Population 35,438
Grandview Heights, OH
Population 8,422
Hilliard, OH
Population 36,560
New Albany, OH
Population 10,524
Westerville, OH
Population 38,543
Worthington, OH
Population 14,754
Canal Winchester, OH
Population 9,659
Pickerington, OH
Population 23,828
Groveport Demographics And Statistics
Population over time in Groveport
| Year | Population | % Change |
|---|---|---|
| 2023 | 5,916 | -0.2% |
| 2022 | 5,928 | -0.2% |
| 2021 | 5,942 | 5.5% |
| 2020 | 5,630 | 0.2% |
| 2019 | 5,617 | 0.4% |
| 2018 | 5,593 | 0.5% |
| 2017 | 5,563 | 1.1% |
| 2016 | 5,500 | -1.9% |
| 2015 | 5,604 | 1.2% |
| 2014 | 5,535 | 2.0% |
| 2013 | 5,429 | 1.9% |
| 2012 | 5,330 | - |
| 2011 | 0 | - |
| 2010 | 0 | - |
Race / Ethnicity in Groveport
Groveport is:
63.3% White with 3,742 White residents.
23.2% African American with 1,372 African American residents.
0.0% American Indian with 0 American Indian residents.
1.0% Asian with 60 Asian residents.
0.0% Hawaiian with 0 Hawaiian residents.
0.8% Other with 50 Other residents.
2.9% Two Or More with 169 Two Or More residents.
8.8% Hispanic with 523 Hispanic residents.
| Race | Groveport | OH | USA |
|---|---|---|---|
| White | 63.3% | 76.5% | 58.2% |
| African American | 23.2% | 12.1% | 12.0% |
| American Indian | 0.0% | 0.1% | 0.5% |
| Asian | 1.0% | 2.4% | 5.7% |
| Hawaiian | 0.0% | 0.0% | 0.2% |
| Other | 0.8% | 0.4% | 0.5% |
| Two Or More | 2.9% | 3.9% | 3.9% |
| Hispanic | 8.8% | 4.6% | 19.0% |
Gender in Groveport
Groveport is 46.5% female with 2,748 female residents.
Groveport is 53.5% male with 3,167 male residents.
| Gender | Groveport | OH | USA |
|---|---|---|---|
| Female | 46.5% | 50.7% | 50.5% |
| Male | 53.5% | 49.3% | 49.5% |
Highest level of educational attainment in Groveport for adults over 25
0.0% of adults in Groveport completed < 9th grade.
3.0% of adults in Groveport completed 9-12th grade.
37.0% of adults in Groveport completed high school / ged.
21.0% of adults in Groveport completed some college.
9.0% of adults in Groveport completed associate's degree.
19.0% of adults in Groveport completed bachelor's degree.
11.0% of adults in Groveport completed master's degree.
0.0% of adults in Groveport completed professional degree.
0.0% of adults in Groveport completed doctorate degree.
| Education | Groveport | OH | USA |
|---|---|---|---|
| < 9th Grade | 0.0% | 3.0% | 5.0% |
| 9-12th Grade | 3.0% | 6.0% | 6.0% |
| High School / GED | 37.0% | 32.0% | 26.0% |
| Some College | 21.0% | 19.0% | 19.0% |
| Associate's Degree | 9.0% | 9.0% | 9.0% |
| Bachelor's Degree | 19.0% | 19.0% | 21.0% |
| Master's Degree | 11.0% | 9.0% | 10.0% |
| Professional Degree | 0.0% | 2.0% | 2.0% |
| Doctorate Degree | 0.0% | 1.0% | 2.0% |
Household Income For Groveport, Ohio
1.8% of households in Groveport earn Less than $10,000.
2.0% of households in Groveport earn $10,000 to $14,999.
5.6% of households in Groveport earn $15,000 to $24,999.
3.2% of households in Groveport earn $25,000 to $34,999.
6.1% of households in Groveport earn $35,000 to $49,999.
17.0% of households in Groveport earn $50,000 to $74,999.
21.3% of households in Groveport earn $75,000 to $99,999.
26.5% of households in Groveport earn $100,000 to $149,999.
11.6% of households in Groveport earn $150,000 to $199,999.
5.0% of households in Groveport earn $200,000 or more.
| Income | Groveport | OH | USA |
|---|---|---|---|
| Less than $10,000 | 1.8% | 5.2% | 4.9% |
| $10,000 to $14,999 | 2.0% | 4.1% | 3.6% |
| $15,000 to $24,999 | 5.6% | 7.4% | 6.6% |
| $25,000 to $34,999 | 3.2% | 7.7% | 6.8% |
| $35,000 to $49,999 | 6.1% | 11.9% | 10.4% |
| $50,000 to $74,999 | 17.0% | 17.1% | 15.7% |
| $75,000 to $99,999 | 21.3% | 13.2% | 12.7% |
| $100,000 to $149,999 | 26.5% | 16.9% | 17.4% |
| $150,000 to $199,999 | 11.6% | 8.0% | 9.3% |
| $200,000 or more | 5.0% | 8.5% | 12.6% |


