Kent, OH
Demographics And Statistics
Living In Kent, Ohio Summary
Life in Kent research summary. HomeSnacks has been using Saturday Night Science to research the quality of life in Kent over the past nine years using Census, FBI, Zillow, and other primary data sources. Based on the most recently available data, we found the following about life in Kent:
The population in Kent is 27,190.
The median home value in Kent is $241,647.
The median income in Kent is $42,524.
The cost of living in Kent is 93 which is 0.9x lower than the national average.
The median rent in Kent is $983.
The unemployment rate in Kent is 10.4%.
The poverty rate in Kent is 24.8%.
The average high in Kent is 59.2° and the average low is 40.8°.
Kent SnackAbility
Overall SnackAbility
Kent, OH Crime Report
Crime in Kent summary. We use data from the FBI to determine the crime rates in Kent. Key points include:
There were 385 total crimes in Kent in the last reporting year.
The overall crime rate per 100,000 people in Kent is 1,398.8 / 100k people.
The violent crime rate per 100,000 people in Kent is 127.2 / 100k people.
The property crime rate per 100,000 people in Kent is 1,271.6 / 100k people.
Overall, crime in Kent is -34.00% below the national average.
Total Crimes
Below National Average
Crime In Kent Comparison Table
| Statistic | Count Raw |
Kent / 100k People |
Ohio / 100k People |
National / 100k People |
|---|---|---|---|---|
| Total Crimes Per 100K | 385 | 1,398.8 | 1,844.9 | 2,119.2 |
| Violent Crime | 35 | 127.2 | 293.7 | 359.0 |
| Murder | 0 | 0.0 | 5.0 | 5.0 |
| Robbery | 5 | 18.2 | 45.5 | 61.0 |
| Aggravated Assault | 30 | 109.0 | 197.4 | 256.0 |
| Property Crime | 350 | 1,271.6 | 1,551.2 | 1,760.0 |
| Burglary | 38 | 138.1 | 206.0 | 229.0 |
| Larceny | 284 | 1,031.8 | 1,132.8 | 1,272.0 |
| Car Theft | 28 | 101.7 | 212.5 | 259.0 |
Kent, OH Cost Of Living
Cost of living in Kent summary. We use data on the cost of living to determine how expensive it is to live in Kent. Real estate prices drive most of the variance in cost of living around Ohio. Key points include:
The cost of living in Kent is 93 with 100 being average.
The cost of living in Kent is 0.9x lower than the national average.
The median home value in Kent is $241,647.
The median income in Kent is $42,524.
Kent's Overall Cost Of Living
Lower Than The National Average
Cost Of Living In Kent Comparison Table
| Living Expense | Kent | Ohio | National Average | |
|---|---|---|---|---|
| Overall | 93 | 93 | 100 | |
| Services | 91 | 101 | 100 | |
| Groceries | 102 | 103 | 100 | |
| Health | 96 | 97 | 100 | |
| Housing | 81 | 74 | 100 | |
| Transportation | 97 | 102 | 100 | |
| Utilities | 101 | 100 | 100 | |
Kent, OH Weather
The average high in Kent is 59.2° and the average low is 40.8°.
There are 84.5 days of precipitation each year.
Expect an average of 39.3 inches of precipitation each year with 48.8 inches of snow.
| Stat | Kent |
|---|---|
| Average Annual High | 59.2 |
| Average Annual Low | 40.8 |
| Annual Precipitation Days | 84.5 |
| Average Annual Precipitation | 39.3 |
| Average Annual Snowfall | 48.8 |
Average High
Days of Rain
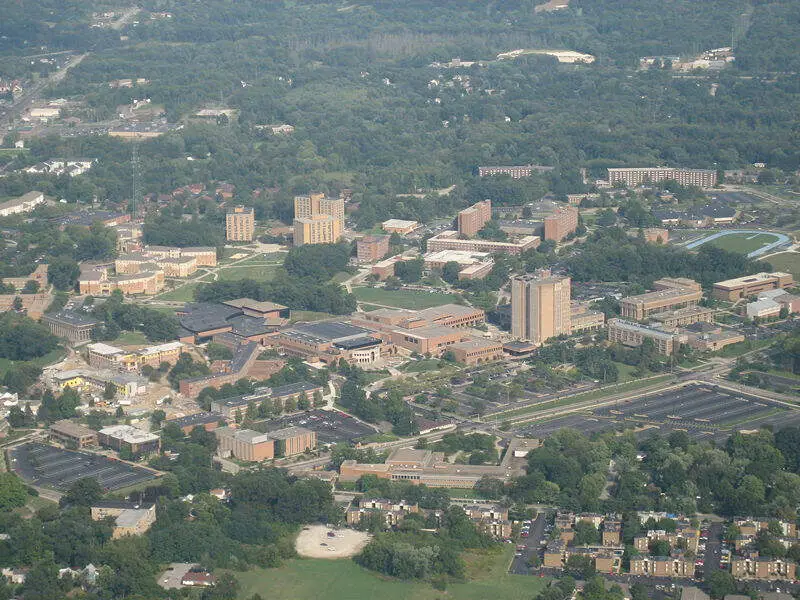
Kent, OH Photos


Rankings for Kent in Ohio


Locations Around Kent
Map Of Kent, OH
Best Places Around Kent
Hudson, OH
Population 23,007
Macedonia, OH
Population 12,142
Solon, OH
Population 23,970
Munroe Falls, OH
Population 5,019
Stow, OH
Population 34,317
Oakwood, OH
Population 9,480
Twinsburg, OH
Population 19,346
Aurora, OH
Population 17,386
Brecksville, OH
Population 13,656
New Franklin, OH
Population 13,830
Kent Demographics And Statistics
Population over time in Kent
The current population in Kent is 27,190. The population has decreased -5.7% from 2010.
| Year | Population | % Change |
|---|---|---|
| 2023 | 27,190 | -0.5% |
| 2022 | 27,336 | -2.1% |
| 2021 | 27,912 | -6.0% |
| 2020 | 29,698 | -0.4% |
| 2019 | 29,811 | -0.0% |
| 2018 | 29,824 | 0.2% |
| 2017 | 29,771 | 0.0% |
| 2016 | 29,761 | 0.7% |
| 2015 | 29,563 | 0.7% |
| 2014 | 29,367 | -6.2% |
| 2013 | 31,301 | 7.7% |
| 2012 | 29,076 | 0.6% |
| 2011 | 28,892 | 0.2% |
| 2010 | 28,845 | - |
Race / Ethnicity in Kent
Kent is:
79.9% White with 21,735 White residents.
8.3% African American with 2,252 African American residents.
0.1% American Indian with 35 American Indian residents.
3.1% Asian with 841 Asian residents.
0.0% Hawaiian with 0 Hawaiian residents.
0.0% Other with 0 Other residents.
5.6% Two Or More with 1,524 Two Or More residents.
3.0% Hispanic with 803 Hispanic residents.
| Race | Kent | OH | USA |
|---|---|---|---|
| White | 79.9% | 76.5% | 58.2% |
| African American | 8.3% | 12.1% | 12.0% |
| American Indian | 0.1% | 0.1% | 0.5% |
| Asian | 3.1% | 2.4% | 5.7% |
| Hawaiian | 0.0% | 0.0% | 0.2% |
| Other | 0.0% | 0.4% | 0.5% |
| Two Or More | 5.6% | 3.9% | 3.9% |
| Hispanic | 3.0% | 4.6% | 19.0% |
Gender in Kent
Kent is 54.9% female with 14,925 female residents.
Kent is 45.1% male with 12,264 male residents.
| Gender | Kent | OH | USA |
|---|---|---|---|
| Female | 54.9% | 50.7% | 50.5% |
| Male | 45.1% | 49.3% | 49.5% |
Highest level of educational attainment in Kent for adults over 25
3.0% of adults in Kent completed < 9th grade.
3.0% of adults in Kent completed 9-12th grade.
25.0% of adults in Kent completed high school / ged.
19.0% of adults in Kent completed some college.
4.0% of adults in Kent completed associate's degree.
23.0% of adults in Kent completed bachelor's degree.
18.0% of adults in Kent completed master's degree.
1.0% of adults in Kent completed professional degree.
4.0% of adults in Kent completed doctorate degree.
| Education | Kent | OH | USA |
|---|---|---|---|
| < 9th Grade | 3.0% | 3.0% | 5.0% |
| 9-12th Grade | 3.0% | 6.0% | 6.0% |
| High School / GED | 25.0% | 32.0% | 26.0% |
| Some College | 19.0% | 19.0% | 19.0% |
| Associate's Degree | 4.0% | 9.0% | 9.0% |
| Bachelor's Degree | 23.0% | 19.0% | 21.0% |
| Master's Degree | 18.0% | 9.0% | 10.0% |
| Professional Degree | 1.0% | 2.0% | 2.0% |
| Doctorate Degree | 4.0% | 1.0% | 2.0% |
Household Income For Kent, Ohio
11.4% of households in Kent earn Less than $10,000.
9.4% of households in Kent earn $10,000 to $14,999.
11.7% of households in Kent earn $15,000 to $24,999.
9.1% of households in Kent earn $25,000 to $34,999.
14.1% of households in Kent earn $35,000 to $49,999.
10.6% of households in Kent earn $50,000 to $74,999.
7.9% of households in Kent earn $75,000 to $99,999.
14.4% of households in Kent earn $100,000 to $149,999.
5.8% of households in Kent earn $150,000 to $199,999.
5.6% of households in Kent earn $200,000 or more.
| Income | Kent | OH | USA |
|---|---|---|---|
| Less than $10,000 | 11.4% | 5.2% | 4.9% |
| $10,000 to $14,999 | 9.4% | 4.1% | 3.6% |
| $15,000 to $24,999 | 11.7% | 7.4% | 6.6% |
| $25,000 to $34,999 | 9.1% | 7.7% | 6.8% |
| $35,000 to $49,999 | 14.1% | 11.9% | 10.4% |
| $50,000 to $74,999 | 10.6% | 17.1% | 15.7% |
| $75,000 to $99,999 | 7.9% | 13.2% | 12.7% |
| $100,000 to $149,999 | 14.4% | 16.9% | 17.4% |
| $150,000 to $199,999 | 5.8% | 8.0% | 9.3% |
| $200,000 or more | 5.6% | 8.5% | 12.6% |


