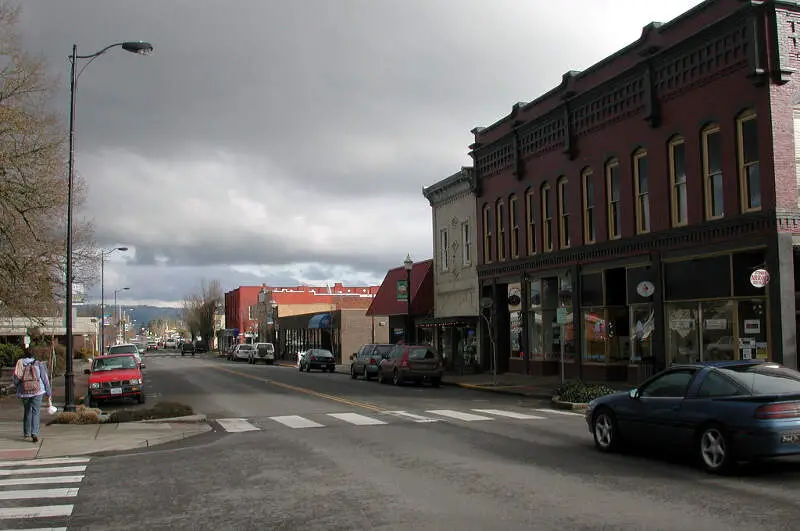
Monmouth, OR
Demographics And Statistics
Living In Monmouth, Oregon Summary
Life in Monmouth research summary. HomeSnacks has been using Saturday Night Science to research the quality of life in Monmouth over the past nine years using Census, FBI, Zillow, and other primary data sources. Based on the most recently available data, we found the following about life in Monmouth:
The population in Monmouth is 11,176.
The median home value in Monmouth is $470,981.
The median income in Monmouth is $66,858.
The cost of living in Monmouth is 113 which is 1.1x higher than the national average.
The median rent in Monmouth is $1,137.
The unemployment rate in Monmouth is 6.7%.
The poverty rate in Monmouth is 15.6%.
The average high in Monmouth is 63.2° and the average low is 42.5°.
Monmouth SnackAbility
Overall SnackAbility
Monmouth, OR Crime Report
Crime in Monmouth summary. We use data from the FBI to determine the crime rates in Monmouth. Key points include:
There were 122 total crimes in Monmouth in the last reporting year.
The overall crime rate per 100,000 people in Monmouth is 1,078.6 / 100k people.
The violent crime rate per 100,000 people in Monmouth is 132.6 / 100k people.
The property crime rate per 100,000 people in Monmouth is 946.0 / 100k people.
Overall, crime in Monmouth is -49.10% below the national average.
Total Crimes
Below National Average
Crime In Monmouth Comparison Table
| Statistic | Count Raw |
Monmouth / 100k People |
Oregon / 100k People |
National / 100k People |
|---|---|---|---|---|
| Total Crimes Per 100K | 122 | 1,078.6 | 2,719.1 | 2,119.2 |
| Violent Crime | 15 | 132.6 | 331.0 | 359.0 |
| Murder | 0 | 0.0 | 3.7 | 5.0 |
| Robbery | 4 | 35.4 | 57.0 | 61.0 |
| Aggravated Assault | 11 | 97.3 | 229.1 | 256.0 |
| Property Crime | 107 | 946.0 | 2,388.0 | 1,760.0 |
| Burglary | 10 | 88.4 | 306.5 | 229.0 |
| Larceny | 86 | 760.3 | 1,789.5 | 1,272.0 |
| Car Theft | 11 | 97.3 | 292.1 | 259.0 |
Monmouth, OR Cost Of Living
Cost of living in Monmouth summary. We use data on the cost of living to determine how expensive it is to live in Monmouth. Real estate prices drive most of the variance in cost of living around Oregon. Key points include:
The cost of living in Monmouth is 113 with 100 being average.
The cost of living in Monmouth is 1.1x higher than the national average.
The median home value in Monmouth is $470,981.
The median income in Monmouth is $66,858.
Monmouth's Overall Cost Of Living
Higher Than The National Average
Cost Of Living In Monmouth Comparison Table
| Living Expense | Monmouth | Oregon | National Average | |
|---|---|---|---|---|
| Overall | 113 | 112 | 100 | |
| Services | 104 | 107 | 100 | |
| Groceries | 109 | 107 | 100 | |
| Health | 100 | 104 | 100 | |
| Housing | 134 | 124 | 100 | |
| Transportation | 106 | 116 | 100 | |
| Utilities | 97 | 97 | 100 | |
Monmouth, OR Weather
The average high in Monmouth is 63.2° and the average low is 42.5°.
There are 110.4 days of precipitation each year.
Expect an average of 41.5 inches of precipitation each year with 4.8 inches of snow.
| Stat | Monmouth |
|---|---|
| Average Annual High | 63.2 |
| Average Annual Low | 42.5 |
| Annual Precipitation Days | 110.4 |
| Average Annual Precipitation | 41.5 |
| Average Annual Snowfall | 4.8 |
Average High
Days of Rain
Monmouth, OR Photos

1 Reviews & Comments About Monmouth
/5

HomeSnacks User - None
Monmouth is a beautiful town with a lot to offer..but it is in fact a college town. The numbers are going to be drastically lower in the categories your looking for because of that. I've lived in Monmouth\ independence my entire life and you will not find a better town in Oregon.
The people are friendly, the crime rate is much lower than the other towns listed, it's a cute little town and is townies are happy as clams with it.
Rankings for Monmouth in Oregon


Locations Around Monmouth
Map Of Monmouth, OR
Best Places Around Monmouth
Keizer, OR
Population 39,013
Corvallis, OR
Population 60,424
Salem, OR
Population 176,666
Dallas, OR
Population 17,214
Four Corners, OR
Population 16,168
Albany, OR
Population 56,773
Hayesville, OR
Population 22,309
Independence, OR
Population 10,088
Sheridan, OR
Population 6,462
Monmouth Demographics And Statistics
Population over time in Monmouth
The current population in Monmouth is 11,176. The population has increased 20.4% from 2010.
| Year | Population | % Change |
|---|---|---|
| 2023 | 11,176 | 1.1% |
| 2022 | 11,054 | 3.0% |
| 2021 | 10,735 | 3.1% |
| 2020 | 10,411 | 1.3% |
| 2019 | 10,282 | 1.5% |
| 2018 | 10,131 | 1.5% |
| 2017 | 9,983 | 0.6% |
| 2016 | 9,919 | 0.5% |
| 2015 | 9,869 | 1.0% |
| 2014 | 9,769 | 0.8% |
| 2013 | 9,687 | 1.4% |
| 2012 | 9,549 | 1.3% |
| 2011 | 9,430 | 1.6% |
| 2010 | 9,283 | - |
Race / Ethnicity in Monmouth
Monmouth is:
74.3% White with 8,303 White residents.
0.8% African American with 90 African American residents.
1.2% American Indian with 129 American Indian residents.
1.7% Asian with 188 Asian residents.
0.5% Hawaiian with 60 Hawaiian residents.
0.0% Other with 0 Other residents.
5.1% Two Or More with 569 Two Or More residents.
16.4% Hispanic with 1,837 Hispanic residents.
| Race | Monmouth | OR | USA |
|---|---|---|---|
| White | 74.3% | 72.3% | 58.2% |
| African American | 0.8% | 1.8% | 12.0% |
| American Indian | 1.2% | 0.7% | 0.5% |
| Asian | 1.7% | 4.4% | 5.7% |
| Hawaiian | 0.5% | 0.4% | 0.2% |
| Other | 0.0% | 0.5% | 0.5% |
| Two Or More | 5.1% | 5.6% | 3.9% |
| Hispanic | 16.4% | 14.3% | 19.0% |
Gender in Monmouth
Monmouth is 51.3% female with 5,738 female residents.
Monmouth is 48.7% male with 5,438 male residents.
| Gender | Monmouth | OR | USA |
|---|---|---|---|
| Female | 51.3% | 50.1% | 50.5% |
| Male | 48.7% | 49.9% | 49.5% |
Highest level of educational attainment in Monmouth for adults over 25
2.0% of adults in Monmouth completed < 9th grade.
4.0% of adults in Monmouth completed 9-12th grade.
25.0% of adults in Monmouth completed high school / ged.
27.0% of adults in Monmouth completed some college.
14.0% of adults in Monmouth completed associate's degree.
17.0% of adults in Monmouth completed bachelor's degree.
8.0% of adults in Monmouth completed master's degree.
1.0% of adults in Monmouth completed professional degree.
2.0% of adults in Monmouth completed doctorate degree.
| Education | Monmouth | OR | USA |
|---|---|---|---|
| < 9th Grade | 2.0% | 4.0% | 5.0% |
| 9-12th Grade | 4.0% | 5.0% | 6.0% |
| High School / GED | 25.0% | 22.0% | 26.0% |
| Some College | 27.0% | 24.0% | 19.0% |
| Associate's Degree | 14.0% | 9.0% | 9.0% |
| Bachelor's Degree | 17.0% | 22.0% | 21.0% |
| Master's Degree | 8.0% | 10.0% | 10.0% |
| Professional Degree | 1.0% | 2.0% | 2.0% |
| Doctorate Degree | 2.0% | 2.0% | 2.0% |
Household Income For Monmouth, Oregon
5.0% of households in Monmouth earn Less than $10,000.
8.0% of households in Monmouth earn $10,000 to $14,999.
6.9% of households in Monmouth earn $15,000 to $24,999.
8.7% of households in Monmouth earn $25,000 to $34,999.
8.8% of households in Monmouth earn $35,000 to $49,999.
15.0% of households in Monmouth earn $50,000 to $74,999.
17.9% of households in Monmouth earn $75,000 to $99,999.
17.8% of households in Monmouth earn $100,000 to $149,999.
5.5% of households in Monmouth earn $150,000 to $199,999.
6.5% of households in Monmouth earn $200,000 or more.
| Income | Monmouth | OR | USA |
|---|---|---|---|
| Less than $10,000 | 5.0% | 4.4% | 4.9% |
| $10,000 to $14,999 | 8.0% | 3.4% | 3.6% |
| $15,000 to $24,999 | 6.9% | 6.3% | 6.6% |
| $25,000 to $34,999 | 8.7% | 6.4% | 6.8% |
| $35,000 to $49,999 | 8.8% | 10.5% | 10.4% |
| $50,000 to $74,999 | 15.0% | 15.9% | 15.7% |
| $75,000 to $99,999 | 17.9% | 13.3% | 12.7% |
| $100,000 to $149,999 | 17.8% | 18.5% | 17.4% |
| $150,000 to $199,999 | 5.5% | 9.6% | 9.3% |
| $200,000 or more | 6.5% | 11.8% | 12.6% |


