We used Saturday Night Science to analyze Oregon’s most recent Census data to determine the divorce rate for each city in Oregon based on the percentage of currently divorced residents.
The city with the highest divorce rate in Oregon is Tillamook, with 11.0% of people over 15 years of age being divorced, per the most recent census data. The city with the lowest divorce rate in Oregon is Talent.
Oregon is 4.0% divorced overall. There are some 136,137 people living in Oregon over fifteen years of age who are divorced. You can compare that to the 28,339,199 Americans who are currently divorced.
Isn’t the divorce rate in America close to 50%? Yes indeed. But we’re measuring something else; we are looking at counts and percentages of people over 15 years old who are currently divorced. That 50% statistic is for the percentage of people who have ever been divorced.
So now that we have you biting your nails, rethinking your worldview, and pulling out your hair, let’s look at the places in Oregon with the highest rates of divorcees.

11.0% divorced · #1 highest divorce rate in Oregon
The city of Tillamook is the county seat of Tillamook County, Oregon, United States. The city is located on the southeast end of Tillamook Bay on the Pacific Ocean. The population was 4,935 at the 2010 census.
Data | Crime | Cost of living | Movers
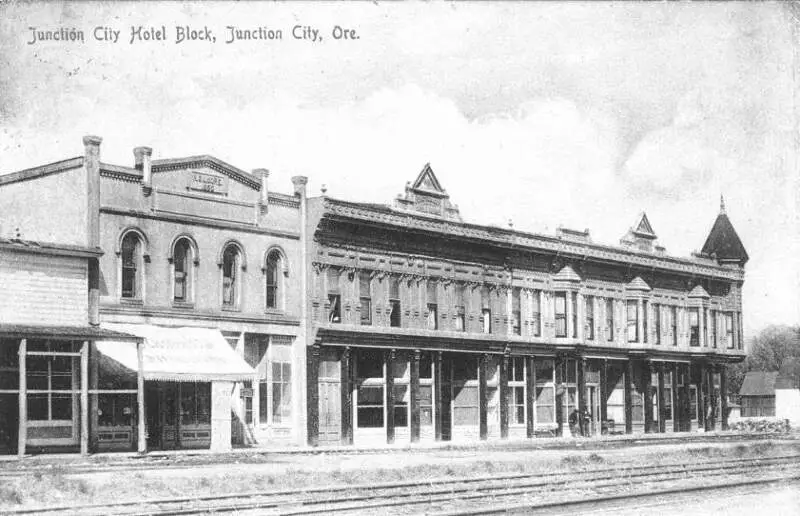
9.0% divorced · #3 highest divorce rate in Oregon
Junction City is a city in Lane County, Oregon, United States. Its population was 5,392 at the 2010 census.
Data | Crime | Cost of living | Movers
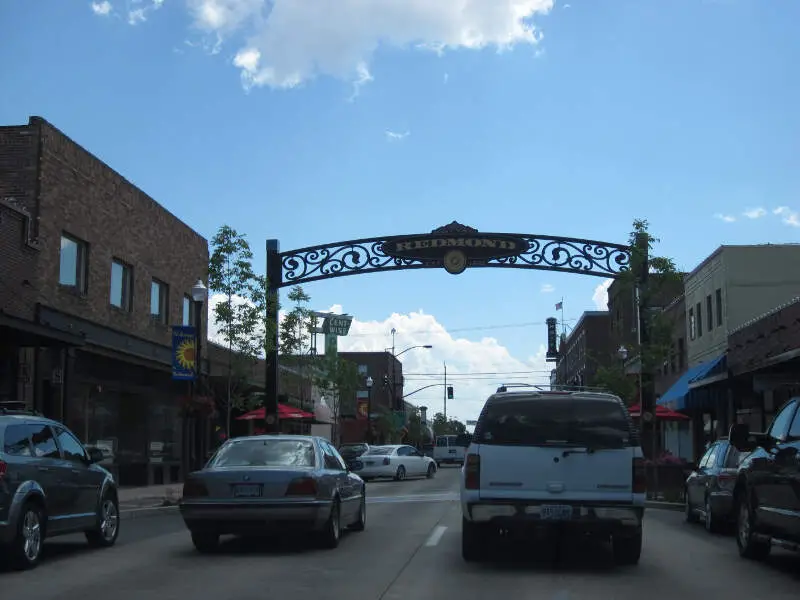
9.0% divorced · #3 highest divorce rate in Oregon
Redmond is a city in Deschutes County, Oregon, United States. Incorporated on July 6, 1910, the city is on the eastern side of Oregon’s Cascade Range, in the High Desert in Central Oregon. From Redmond there is access to recreational opportunities, including mountain biking, fishing, hiking, camping, rock climbing, white-water rafting, skiing, and golf. Redmond is a full-service municipality and one of the fastest-growing industrial and residential communities in Oregon. Redmond had a population of 26,215 in 2010, and the population continues to grow at a rate of about 8percent each year.
Data | Crime | Cost of living | Movers

9.0% divorced · #3 highest divorce rate in Oregon
Prineville is a city in and the county seat of Crook County, Oregon, United States. It was named for the first merchant located in the present location, Barney Prine. The population was 9,253 at the 2010 census.
Data | Crime | Cost of living | Movers
8.0% divorced · #7 highest divorce rate in Oregon
Data | Crime | Cost of living | Movers
8.0% divorced · #7 highest divorce rate in Oregon
Coos Bay is a city located in Coos County, Oregon, United States, where the Coos River enters Coos Bay on the Pacific Ocean. The city borders the city of North Bend, and together they are often referred to as one entity called either Coos Bay-North Bend or the Bay Area. Coos Bay’s population as of the 2010 census was 15,967 residents, making it the largest city on the Oregon Coast.
Data | Crime | Cost of living | Movers

8.0% divorced · #7 highest divorce rate in Oregon
Sheridan is a city in Yamhill County, Oregon, United States. Platted in the 1860s when it received a post office, the city was incorporated in 1880. A major fire burned much of the city in 1913, and a flood covered much of the city in 1964. The population of the city as of the 2010 Census was 6,127, an increase from 3,570 at the 2000 census. However, the 2000 Census count failed to include those incarcerated at the federal prison in the city, while the newer count did include those inmates.
Data | Crime | Cost of living | Movers
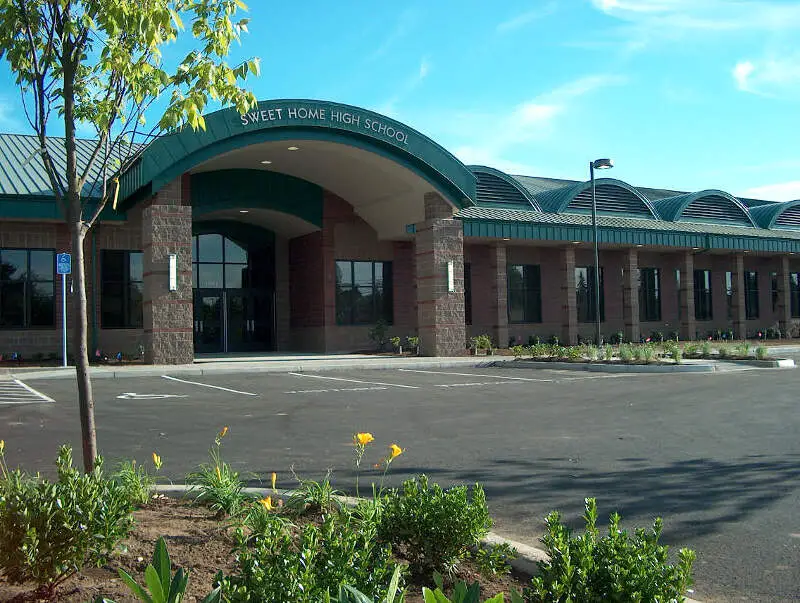
8.0% divorced · #7 highest divorce rate in Oregon
Sweet Home is a city in Linn County, Oregon, United States. The population was 8,925 at the 2010 census. According to the city, “Sweet Home is sometimes referred to as the ‘Gateway to the Santiam Playground’ due to its proximity to nearby lakes, rivers and the Cascade Mountains.”
Data | Crime | Cost of living | Movers
8.0% divorced · #7 highest divorce rate in Oregon
Data | Crime | Cost of living | Movers

7.0% divorced · #16 highest divorce rate in Oregon
Data | Crime | Cost of living | Movers
The receipts
Compare the top ten
Pick a metric. The bars rescale. The red line is Oregon’s statewide median.
Oregon statewide median: $83,011
On the map
Where Oregon’s highest divorce rates are
Saturday Night Science
How We Determined The Places In Oregon That Get Un-Hitched The Most
We used Saturday Night Science to look at the U.S. Census Bureau on divorce rates. Because who likes tracking misery more than the U.S. government?
Specifically, we looked at the 2020-2024 American Community Survey table S1201 — Marital Status. Pretty straightforward on that front — we just had to extract the following column of data:
Today, the analysis focuses on the 80 places in Oregon with a population of over 5,000.
- Population 15 Years and Over -> Divorced
We ranked each place by the percentage of divorcees over 15 years of age from highest to lowest. We crowned the divorce capital of Oregon the place with the highest incidence of divorcees, Tillamook.
And if you’re trying to avoid divorce, check out Talent, the city with the lowest divorce rate in Oregon. We updated this article for 2026 and this list is our eleventh time ranking the cities in Oregon with the highest divorce rates.
The full plate
Cities With The Highest Divorce Rates In Oregon
Click any column to sort. Search by city name.
| Rank | City | Population | Divorcees | Divorce Rate |
|---|---|---|---|---|
| 1 | Tillamook | 5,218 | 459 | 11.0% |
| 3 | Junction City | 6,947 | 500 | 9.0% |
| 3 | Redmond | 36,092 | 2,599 | 9.0% |
| 3 | Prineville | 11,470 | 826 | 9.0% |
| 7 | Lebanon | 19,344 | 1,238 | 8.0% |
| 7 | Coos Bay | 15,925 | 1,019 | 8.0% |
| 7 | Sheridan | 6,339 | 406 | 8.0% |
| 7 | Sweet Home | 10,078 | 645 | 8.0% |
| 7 | Veneta | 5,200 | 333 | 8.0% |
| 15 | Sutherlin | 8,599 | 482 | 7.0% |
| 15 | Florence | 9,482 | 531 | 7.0% |
| 15 | Silverton | 10,456 | 586 | 7.0% |
| 15 | St. Helens | 14,258 | 798 | 7.0% |
| 15 | Springfield | 61,499 | 3,444 | 7.0% |
| 15 | Eagle Point | 9,839 | 551 | 7.0% |
| 15 | Madras | 7,676 | 430 | 7.0% |
| 15 | Pendleton | 16,950 | 949 | 7.0% |
| 15 | Seaside | 7,192 | 403 | 7.0% |
| 15 | The Dalles | 15,917 | 891 | 7.0% |
| 15 | Scappoose | 8,179 | 458 | 7.0% |
| 15 | Warrenton | 6,327 | 354 | 7.0% |
| 28 | Troutdale | 15,923 | 764 | 6.0% |
| 28 | Lincoln City | 9,968 | 478 | 6.0% |
| 28 | Brookings | 6,703 | 322 | 6.0% |
| 28 | Baker City | 10,210 | 490 | 6.0% |
| 28 | Ontario | 11,842 | 568 | 6.0% |
| 28 | Klamath Falls | 22,115 | 1,062 | 6.0% |
| 28 | Milwaukie | 21,392 | 1,027 | 6.0% |
| 28 | McMinnville | 34,596 | 1,661 | 6.0% |
| 28 | Gladstone | 11,977 | 575 | 6.0% |
| 28 | Dallas | 17,531 | 841 | 6.0% |
| 28 | Keizer | 39,082 | 1,876 | 6.0% |
| 28 | Albany | 56,839 | 2,728 | 6.0% |
| 28 | Umatilla | 7,508 | 360 | 6.0% |
| 28 | Roseburg | 23,778 | 1,141 | 6.0% |
| 40 | Sandy | 12,854 | 514 | 5.0% |
| 40 | Canby | 18,134 | 725 | 5.0% |
| 40 | King City | 5,073 | 203 | 5.0% |
| 40 | Salem | 178,865 | 7,155 | 5.0% |
| 40 | La Grande | 13,058 | 522 | 5.0% |
| 40 | Creswell | 5,621 | 225 | 5.0% |
| 40 | Oregon City | 37,755 | 1,510 | 5.0% |
| 40 | Central Point | 19,216 | 769 | 5.0% |
| 40 | Astoria | 10,109 | 404 | 5.0% |
| 52 | Estacada | 5,152 | 165 | 4.0% |
| 52 | Medford | 86,315 | 2,762 | 4.0% |
| 52 | Milton-Freewater | 7,036 | 225 | 4.0% |
| 52 | Newport | 10,583 | 339 | 4.0% |
| 52 | Grants Pass | 39,311 | 1,258 | 4.0% |
| 52 | Forest Grove | 26,529 | 849 | 4.0% |
| 52 | Eugene | 179,591 | 5,747 | 4.0% |
| 52 | Fairview | 10,735 | 344 | 4.0% |
| 52 | Stayton | 8,292 | 265 | 4.0% |
| 52 | Wilsonville | 26,974 | 863 | 4.0% |
| 52 | Cottage Grove | 10,698 | 342 | 4.0% |
| 52 | Portland | 641,165 | 20,517 | 4.0% |
| 52 | Newberg | 26,066 | 834 | 4.0% |
| 52 | Gresham | 112,378 | 3,596 | 4.0% |
| 52 | Happy Valley | 26,738 | 856 | 4.0% |
| 68 | Hillsboro | 108,231 | 2,598 | 3.0% |
| 68 | Woodburn | 27,875 | 669 | 3.0% |
| 68 | Bend | 103,390 | 2,481 | 3.0% |
| 68 | Hermiston | 19,546 | 469 | 3.0% |
| 68 | North Bend | 10,171 | 244 | 3.0% |
| 68 | Winston | 5,690 | 137 | 3.0% |
| 68 | West Linn | 26,935 | 646 | 3.0% |
| 68 | Monmouth | 11,428 | 274 | 3.0% |
| 68 | Molalla | 10,186 | 244 | 3.0% |
| 68 | Sherwood | 20,307 | 487 | 3.0% |
| 68 | Beaverton | 97,812 | 2,347 | 3.0% |
| 68 | Ashland | 21,259 | 510 | 3.0% |
| 68 | Tualatin | 27,763 | 666 | 3.0% |
| 68 | Philomath | 5,642 | 135 | 3.0% |
| 68 | Cornelius | 14,255 | 342 | 3.0% |
| 68 | Tigard | 56,011 | 1,344 | 3.0% |
| 68 | Lake Oswego | 40,381 | 969 | 3.0% |
| 78 | Hood River | 8,361 | 134 | 2.0% |
| 78 | Independence | 10,199 | 163 | 2.0% |
| 78 | Corvallis | 59,960 | 959 | 2.0% |
| 80 | Talent | 6,254 | 50 | 1.0% |
Source: U.S. Census ACS 2020-2024. 80 cities with more than 5,000 residents.
Summary
Getting Some Closure In Oregon After Untying The Knot
We now have a sense of what places in the Beaver State don’t pay much attention to the whole “’til death do we part” phrase.
The cities with the highest divorce rate in Oregon are Tillamook, Junction City, Redmond, Prineville, Lebanon, Coos Bay, Sheridan, Sweet Home, Veneta, and Sutherlin.
Try to keep in mind that the reason cities rank where they do in Oregon could be because of the age, education, and income distribution, as all of those things impact the rate of divorce.