Lititz, PA
Demographics And Statistics
Living In Lititz, Pennsylvania Summary
Life in Lititz research summary. HomeSnacks has been using Saturday Night Science to research the quality of life in Lititz over the past nine years using Census, FBI, Zillow, and other primary data sources. Based on the most recently available data, we found the following about life in Lititz:
The population in Lititz is 9,599.
The median home value in Lititz is $445,557.
The median income in Lititz is $82,861.
The cost of living in Lititz is 104 which is 1.0x higher than the national average.
The median rent in Lititz is $1,207.
The unemployment rate in Lititz is 1.7%.
The poverty rate in Lititz is 2.6%.
The average high in Lititz is 62.8° and the average low is 42.9°.
Table Of Contents
Lititz SnackAbility
Overall SnackAbility
Lititz, PA Cost Of Living
Cost of living in Lititz summary. We use data on the cost of living to determine how expensive it is to live in Lititz. Real estate prices drive most of the variance in cost of living around Pennsylvania. Key points include:
The cost of living in Lititz is 104 with 100 being average.
The cost of living in Lititz is 1.0x higher than the national average.
The median home value in Lititz is $445,557.
The median income in Lititz is $82,861.
Lititz's Overall Cost Of Living
Higher Than The National Average
Cost Of Living In Lititz Comparison Table
| Living Expense | Lititz | Pennsylvania | National Average | |
|---|---|---|---|---|
| Overall | 104 | 100 | 100 | |
| Services | 105 | 101 | 100 | |
| Groceries | 100 | 101 | 100 | |
| Health | 109 | 95 | 100 | |
| Housing | 110 | 93 | 100 | |
| Transportation | 107 | 108 | 100 | |
| Utilities | 95 | 108 | 100 | |
Lititz, PA Weather
The average high in Lititz is 62.8° and the average low is 42.9°.
There are 76.7 days of precipitation each year.
Expect an average of 43.7 inches of precipitation each year with 23.2 inches of snow.
| Stat | Lititz |
|---|---|
| Average Annual High | 62.8 |
| Average Annual Low | 42.9 |
| Annual Precipitation Days | 76.7 |
| Average Annual Precipitation | 43.7 |
| Average Annual Snowfall | 23.2 |
Average High
Days of Rain
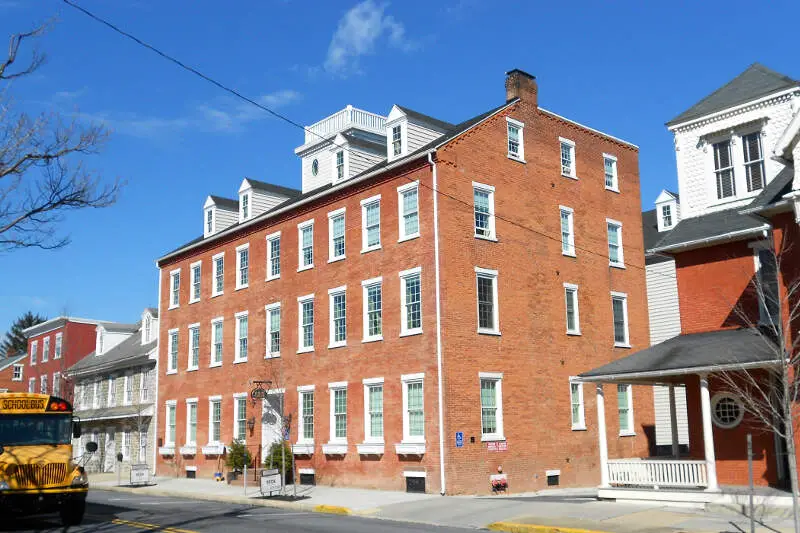
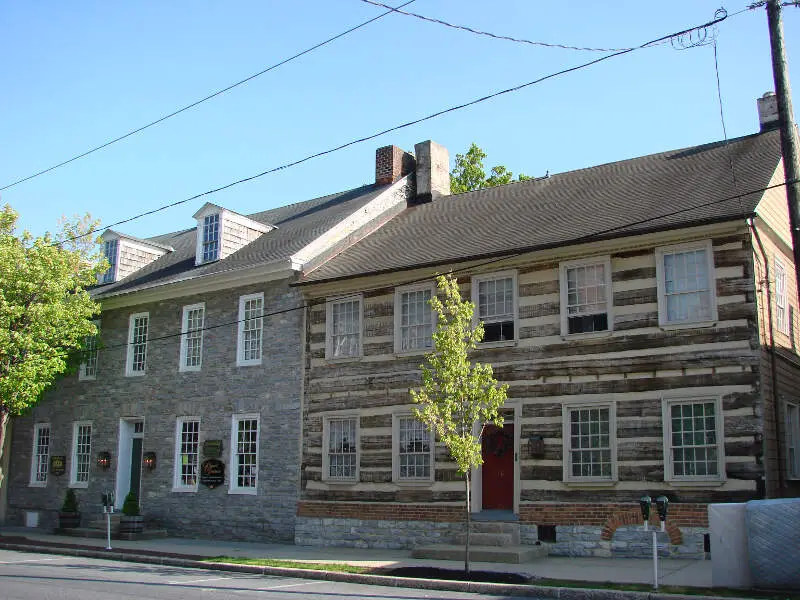
Lititz, PA Photos
Rankings for Lititz in Pennsylvania


Locations Around Lititz
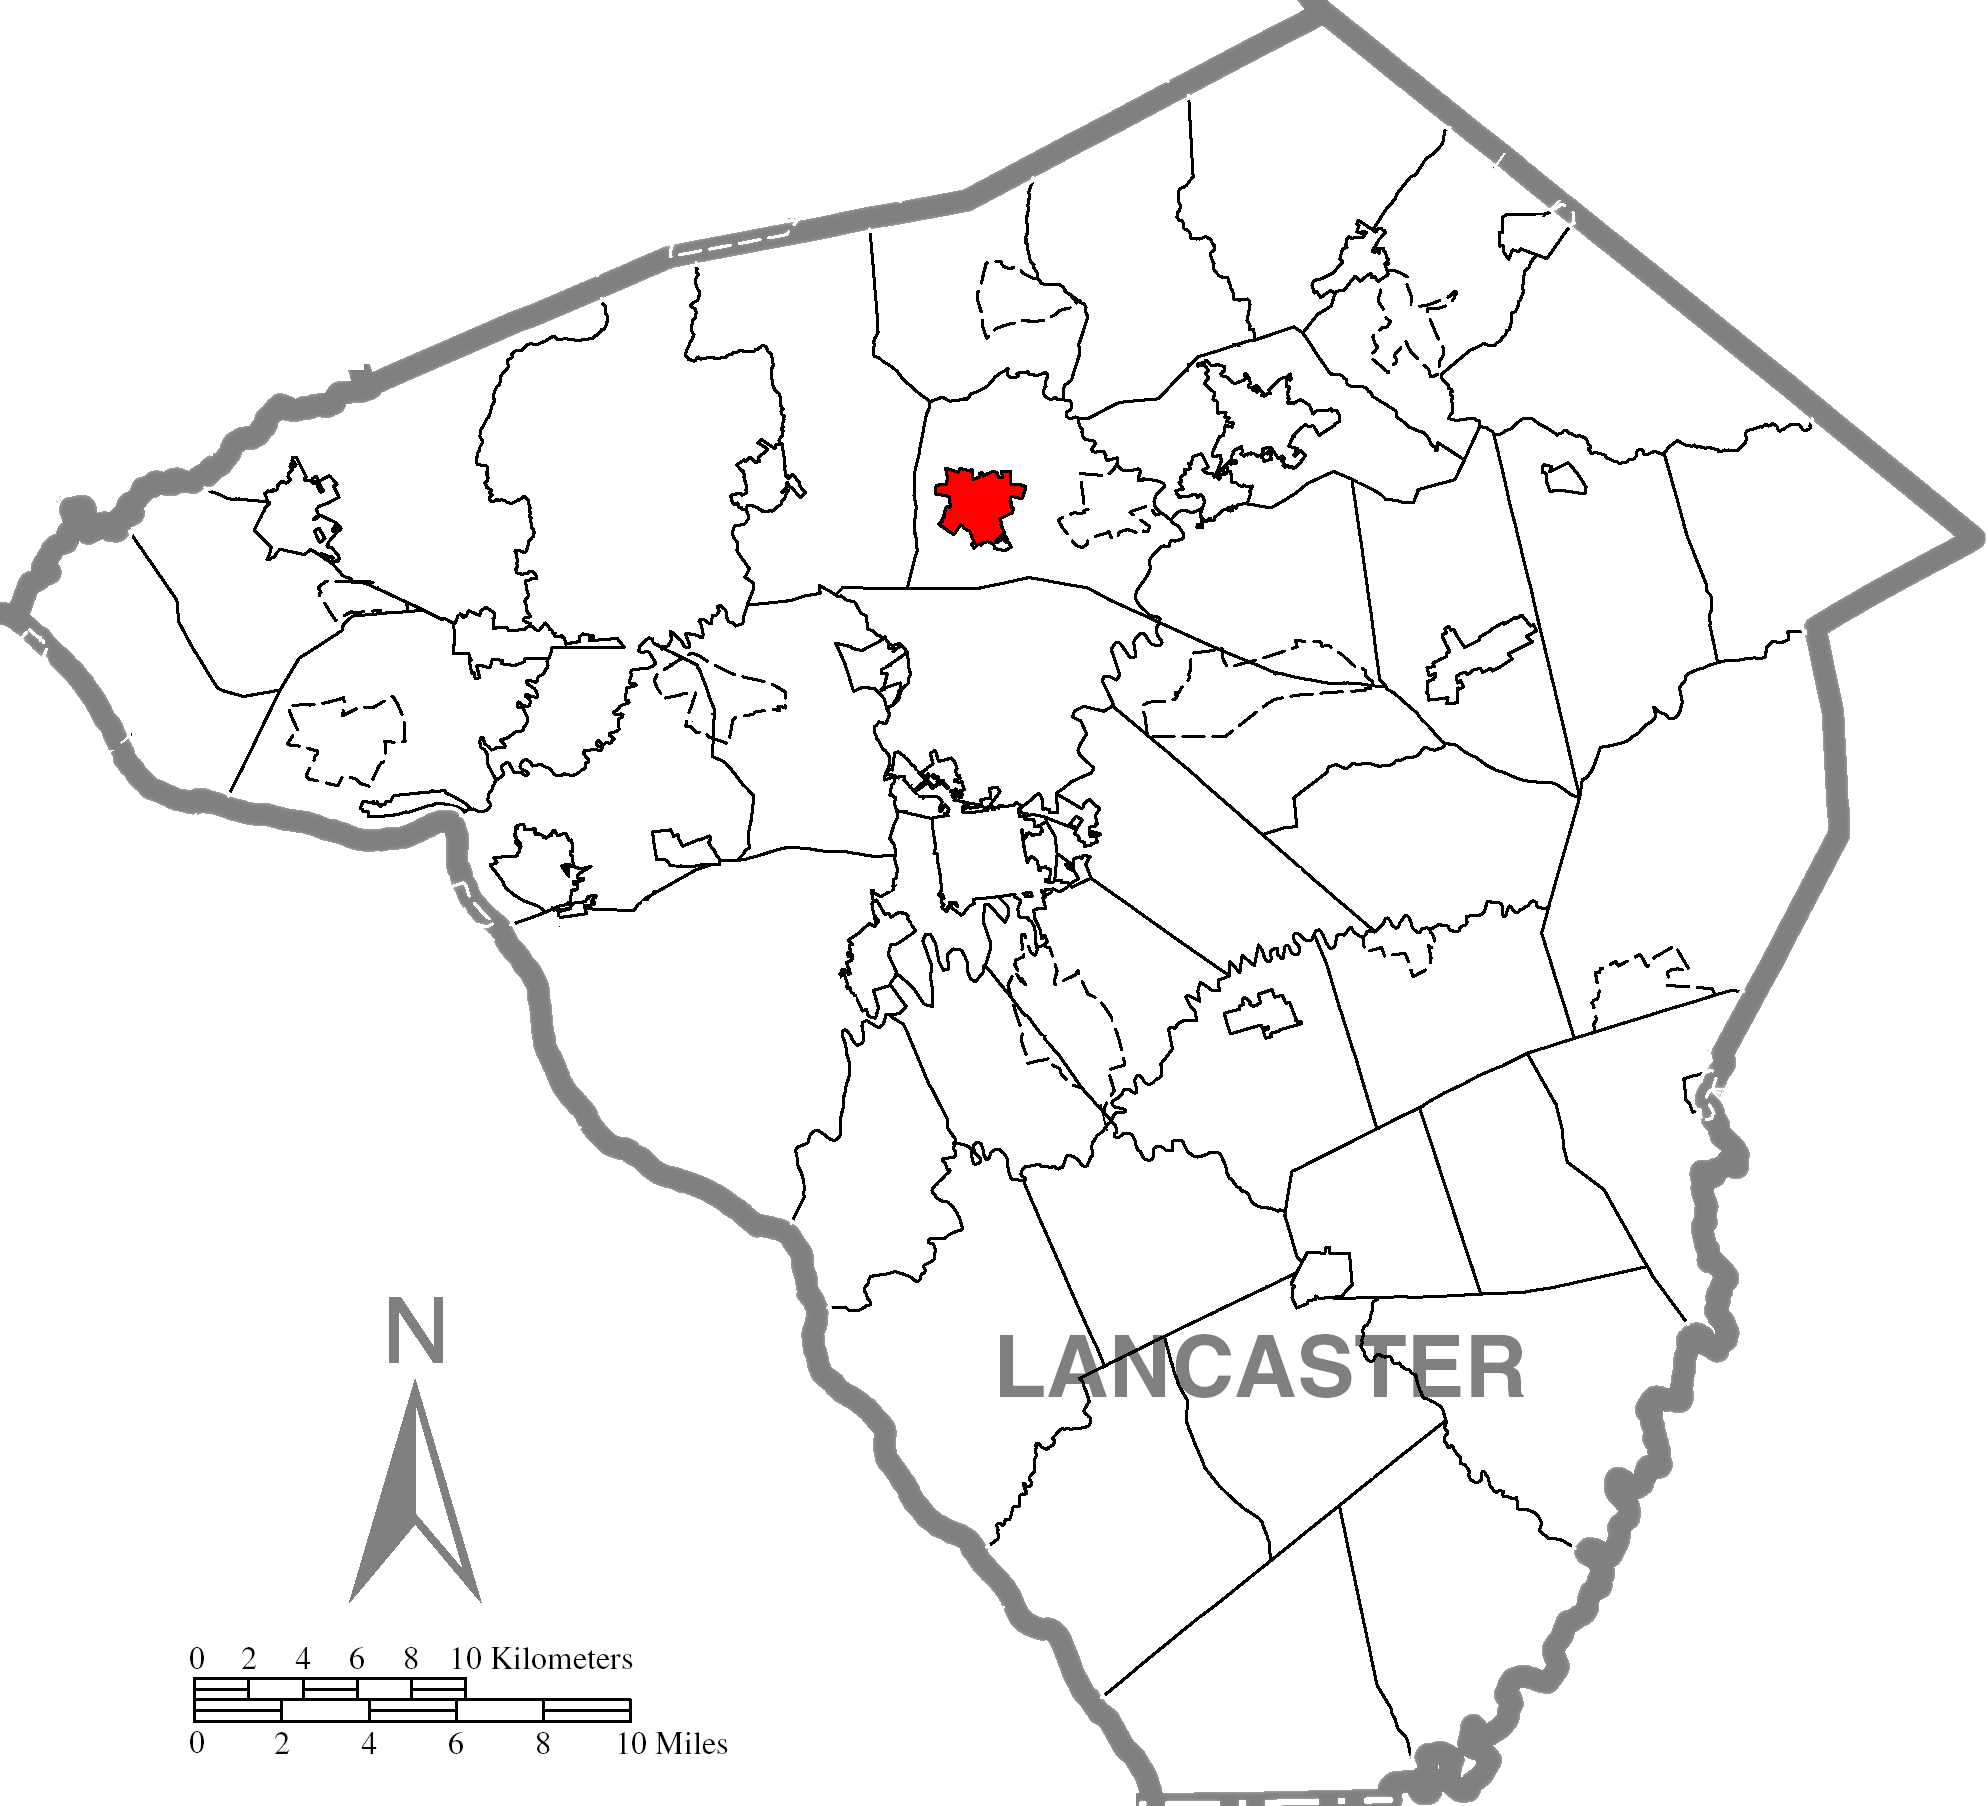
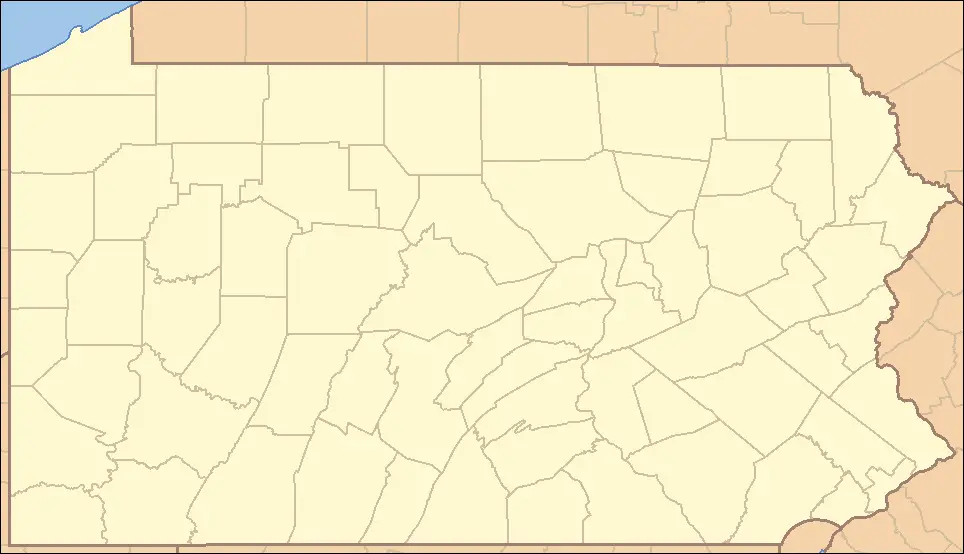
Map Of Lititz, PA
Best Places Around Lititz
Millersville, PA
Population 8,711
Palmyra, PA
Population 7,769
Ephrata, PA
Population 13,729
New Holland, PA
Population 5,743
Willow Street, PA
Population 10,010
Leola, PA
Population 8,107
Mount Joy, PA
Population 8,310
Columbia, PA
Population 10,217
Hershey, PA
Population 14,334
Lancaster, PA
Population 57,683
Lititz Demographics And Statistics
Population over time in Lititz
The current population in Lititz is 9,599. The population has increased 3.2% from 2010.
| Year | Population | % Change |
|---|---|---|
| 2023 | 9,599 | 0.4% |
| 2022 | 9,559 | 0.8% |
| 2021 | 9,485 | -0.2% |
| 2020 | 9,503 | 1.8% |
| 2019 | 9,335 | 0.5% |
| 2018 | 9,288 | 0.2% |
| 2017 | 9,269 | 0.7% |
| 2016 | 9,209 | 0.0% |
| 2015 | 9,208 | -1.9% |
| 2014 | 9,386 | 0.1% |
| 2013 | 9,376 | 0.1% |
| 2012 | 9,366 | 0.2% |
| 2011 | 9,350 | 0.6% |
| 2010 | 9,298 | - |
Race / Ethnicity in Lititz
Lititz is:
89.8% White with 8,618 White residents.
1.1% African American with 106 African American residents.
0.0% American Indian with 0 American Indian residents.
2.2% Asian with 211 Asian residents.
0.0% Hawaiian with 0 Hawaiian residents.
0.0% Other with 0 Other residents.
1.1% Two Or More with 104 Two Or More residents.
5.8% Hispanic with 560 Hispanic residents.
| Race | Lititz | PA | USA |
|---|---|---|---|
| White | 89.8% | 73.8% | 58.2% |
| African American | 1.1% | 10.3% | 12.0% |
| American Indian | 0.0% | 0.1% | 0.5% |
| Asian | 2.2% | 3.7% | 5.7% |
| Hawaiian | 0.0% | 0.0% | 0.2% |
| Other | 0.0% | 0.4% | 0.5% |
| Two Or More | 1.1% | 3.3% | 3.9% |
| Hispanic | 5.8% | 8.4% | 19.0% |
Gender in Lititz
Lititz is 50.3% female with 4,827 female residents.
Lititz is 49.7% male with 4,772 male residents.
| Gender | Lititz | PA | USA |
|---|---|---|---|
| Female | 50.3% | 50.7% | 50.5% |
| Male | 49.7% | 49.3% | 49.5% |
Highest level of educational attainment in Lititz for adults over 25
1.0% of adults in Lititz completed < 9th grade.
2.0% of adults in Lititz completed 9-12th grade.
31.0% of adults in Lititz completed high school / ged.
19.0% of adults in Lititz completed some college.
8.0% of adults in Lititz completed associate's degree.
23.0% of adults in Lititz completed bachelor's degree.
11.0% of adults in Lititz completed master's degree.
3.0% of adults in Lititz completed professional degree.
2.0% of adults in Lititz completed doctorate degree.
| Education | Lititz | PA | USA |
|---|---|---|---|
| < 9th Grade | 1.0% | 3.0% | 5.0% |
| 9-12th Grade | 2.0% | 5.0% | 6.0% |
| High School / GED | 31.0% | 33.0% | 26.0% |
| Some College | 19.0% | 15.0% | 19.0% |
| Associate's Degree | 8.0% | 9.0% | 9.0% |
| Bachelor's Degree | 23.0% | 21.0% | 21.0% |
| Master's Degree | 11.0% | 10.0% | 10.0% |
| Professional Degree | 3.0% | 2.0% | 2.0% |
| Doctorate Degree | 2.0% | 2.0% | 2.0% |
Household Income For Lititz, Pennsylvania
1.2% of households in Lititz earn Less than $10,000.
2.4% of households in Lititz earn $10,000 to $14,999.
4.1% of households in Lititz earn $15,000 to $24,999.
7.1% of households in Lititz earn $25,000 to $34,999.
15.7% of households in Lititz earn $35,000 to $49,999.
13.5% of households in Lititz earn $50,000 to $74,999.
14.4% of households in Lititz earn $75,000 to $99,999.
20.4% of households in Lititz earn $100,000 to $149,999.
13.0% of households in Lititz earn $150,000 to $199,999.
8.2% of households in Lititz earn $200,000 or more.
| Income | Lititz | PA | USA |
|---|---|---|---|
| Less than $10,000 | 1.2% | 4.8% | 4.9% |
| $10,000 to $14,999 | 2.4% | 3.7% | 3.6% |
| $15,000 to $24,999 | 4.1% | 7.0% | 6.6% |
| $25,000 to $34,999 | 7.1% | 7.1% | 6.8% |
| $35,000 to $49,999 | 15.7% | 10.7% | 10.4% |
| $50,000 to $74,999 | 13.5% | 16.1% | 15.7% |
| $75,000 to $99,999 | 14.4% | 12.9% | 12.7% |
| $100,000 to $149,999 | 20.4% | 17.6% | 17.4% |
| $150,000 to $199,999 | 13.0% | 9.0% | 9.3% |
| $200,000 or more | 8.2% | 11.1% | 12.6% |


