New Freedom, PA
Demographics And Statistics
Living In New Freedom, Pennsylvania Summary
Life in New Freedom research summary. HomeSnacks has been using Saturday Night Science to research the quality of life in New Freedom over the past nine years using Census, FBI, Zillow, and other primary data sources. Based on the most recently available data, we found the following about life in New Freedom:
The population in New Freedom is 5,003.
The median home value in New Freedom is $413,403.
The median income in New Freedom is $109,894.
The median rent in New Freedom is $1,519.
The unemployment rate in New Freedom is 1.4%.
The poverty rate in New Freedom is 2.7%.
The average high in New Freedom is 62.7° and the average low is 42.8°.
Table Of Contents
New Freedom SnackAbility
Overall SnackAbility
New Freedom, PA Weather
The average high in New Freedom is 62.7° and the average low is 42.8°.
There are 75.0 days of precipitation each year.
Expect an average of 46.0 inches of precipitation each year with 29.0 inches of snow.
| Stat | New Freedom |
|---|---|
| Average Annual High | 62.7 |
| Average Annual Low | 42.8 |
| Annual Precipitation Days | 75.0 |
| Average Annual Precipitation | 46.0 |
| Average Annual Snowfall | 29.0 |
Average High
Days of Rain
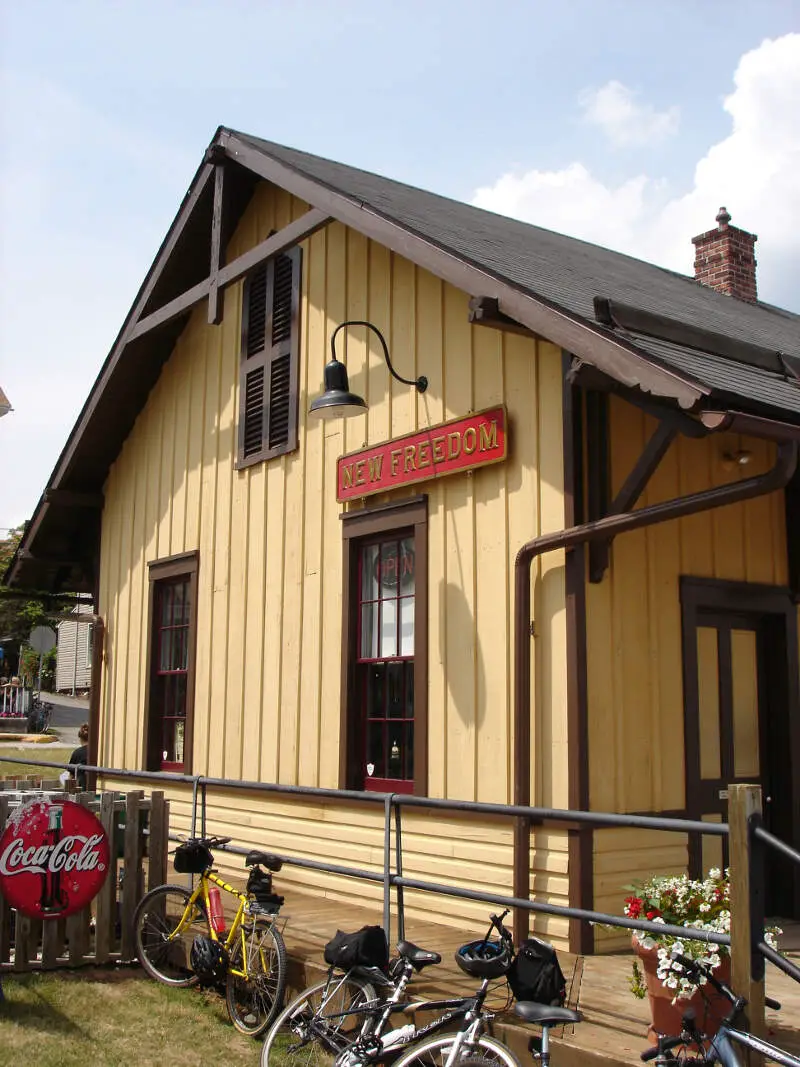
New Freedom, PA Photos
Rankings for New Freedom in Pennsylvania


Locations Around New Freedom
Map Of New Freedom, PA
Best Places Around New Freedom
East York, PA
Population 8,868
Shiloh, PA
Population 11,022
Weigelstown, PA
Population 15,401
Fallston, MD
Population 9,954
Parkville, PA
Population 8,354
Hanover, PA
Population 16,483
Red Lion, PA
Population 6,494
Hampstead, MD
Population 6,311
Westminster, MD
Population 20,257
York, PA
Population 44,830
New Freedom Demographics And Statistics
Population over time in New Freedom
The current population in New Freedom is 5,003. The population has increased 15.9% from 2010.
| Year | Population | % Change |
|---|---|---|
| 2023 | 5,003 | 0.8% |
| 2022 | 4,962 | 1.5% |
| 2021 | 4,889 | 4.2% |
| 2020 | 4,691 | 1.2% |
| 2019 | 4,637 | 0.4% |
| 2018 | 4,618 | 0.7% |
| 2017 | 4,586 | 0.4% |
| 2016 | 4,569 | 0.6% |
| 2015 | 4,542 | 0.3% |
| 2014 | 4,528 | 1.0% |
| 2013 | 4,483 | 0.8% |
| 2012 | 4,446 | 1.4% |
| 2011 | 4,384 | 1.6% |
| 2010 | 4,316 | - |
Race / Ethnicity in New Freedom
New Freedom is:
94.0% White with 4,704 White residents.
0.0% African American with 0 African American residents.
0.0% American Indian with 0 American Indian residents.
0.5% Asian with 24 Asian residents.
0.0% Hawaiian with 0 Hawaiian residents.
0.0% Other with 0 Other residents.
2.2% Two Or More with 109 Two Or More residents.
3.3% Hispanic with 166 Hispanic residents.
| Race | New Freedom | PA | USA |
|---|---|---|---|
| White | 94.0% | 73.8% | 58.2% |
| African American | 0.0% | 10.3% | 12.0% |
| American Indian | 0.0% | 0.1% | 0.5% |
| Asian | 0.5% | 3.7% | 5.7% |
| Hawaiian | 0.0% | 0.0% | 0.2% |
| Other | 0.0% | 0.4% | 0.5% |
| Two Or More | 2.2% | 3.3% | 3.9% |
| Hispanic | 3.3% | 8.4% | 19.0% |
Gender in New Freedom
New Freedom is 51.5% female with 2,578 female residents.
New Freedom is 48.5% male with 2,425 male residents.
| Gender | New Freedom | PA | USA |
|---|---|---|---|
| Female | 51.5% | 50.7% | 50.5% |
| Male | 48.5% | 49.3% | 49.5% |
Highest level of educational attainment in New Freedom for adults over 25
3.0% of adults in New Freedom completed < 9th grade.
4.0% of adults in New Freedom completed 9-12th grade.
23.0% of adults in New Freedom completed high school / ged.
18.0% of adults in New Freedom completed some college.
10.0% of adults in New Freedom completed associate's degree.
28.0% of adults in New Freedom completed bachelor's degree.
11.0% of adults in New Freedom completed master's degree.
1.0% of adults in New Freedom completed professional degree.
2.0% of adults in New Freedom completed doctorate degree.
| Education | New Freedom | PA | USA |
|---|---|---|---|
| < 9th Grade | 3.0% | 3.0% | 5.0% |
| 9-12th Grade | 4.0% | 5.0% | 6.0% |
| High School / GED | 23.0% | 33.0% | 26.0% |
| Some College | 18.0% | 15.0% | 19.0% |
| Associate's Degree | 10.0% | 9.0% | 9.0% |
| Bachelor's Degree | 28.0% | 21.0% | 21.0% |
| Master's Degree | 11.0% | 10.0% | 10.0% |
| Professional Degree | 1.0% | 2.0% | 2.0% |
| Doctorate Degree | 2.0% | 2.0% | 2.0% |
Household Income For New Freedom, Pennsylvania
1.7% of households in New Freedom earn Less than $10,000.
0.0% of households in New Freedom earn $10,000 to $14,999.
4.3% of households in New Freedom earn $15,000 to $24,999.
5.7% of households in New Freedom earn $25,000 to $34,999.
6.9% of households in New Freedom earn $35,000 to $49,999.
13.2% of households in New Freedom earn $50,000 to $74,999.
8.3% of households in New Freedom earn $75,000 to $99,999.
29.4% of households in New Freedom earn $100,000 to $149,999.
16.9% of households in New Freedom earn $150,000 to $199,999.
13.5% of households in New Freedom earn $200,000 or more.
| Income | New Freedom | PA | USA |
|---|---|---|---|
| Less than $10,000 | 1.7% | 4.8% | 4.9% |
| $10,000 to $14,999 | 0.0% | 3.7% | 3.6% |
| $15,000 to $24,999 | 4.3% | 7.0% | 6.6% |
| $25,000 to $34,999 | 5.7% | 7.1% | 6.8% |
| $35,000 to $49,999 | 6.9% | 10.7% | 10.4% |
| $50,000 to $74,999 | 13.2% | 16.1% | 15.7% |
| $75,000 to $99,999 | 8.3% | 12.9% | 12.7% |
| $100,000 to $149,999 | 29.4% | 17.6% | 17.4% |
| $150,000 to $199,999 | 16.9% | 9.0% | 9.3% |
| $200,000 or more | 13.5% | 11.1% | 12.6% |


