Oxford, PA
Demographics And Statistics
Living In Oxford, Pennsylvania Summary
Life in Oxford research summary. HomeSnacks has been using Saturday Night Science to research the quality of life in Oxford over the past nine years using Census, FBI, Zillow, and other primary data sources. Based on the most recently available data, we found the following about life in Oxford:
The population in Oxford is 5,763.
The median home value in Oxford is $455,434.
The median income in Oxford is $61,470.
The cost of living in Oxford is 109 which is 1.1x higher than the national average.
The median rent in Oxford is $1,208.
The unemployment rate in Oxford is 4.4%.
The poverty rate in Oxford is 23.8%.
The average high in Oxford is 62.7° and the average low is 42.6°.
Table Of Contents
Oxford SnackAbility
Overall SnackAbility
Oxford, PA Cost Of Living
Cost of living in Oxford summary. We use data on the cost of living to determine how expensive it is to live in Oxford. Real estate prices drive most of the variance in cost of living around Pennsylvania. Key points include:
The cost of living in Oxford is 109 with 100 being average.
The cost of living in Oxford is 1.1x higher than the national average.
The median home value in Oxford is $455,434.
The median income in Oxford is $61,470.
Oxford's Overall Cost Of Living
Higher Than The National Average
Cost Of Living In Oxford Comparison Table
| Living Expense | Oxford | Pennsylvania | National Average | |
|---|---|---|---|---|
| Overall | 109 | 100 | 100 | |
| Services | 107 | 101 | 100 | |
| Groceries | 107 | 101 | 100 | |
| Health | 105 | 95 | 100 | |
| Housing | 119 | 93 | 100 | |
| Transportation | 106 | 108 | 100 | |
| Utilities | 91 | 108 | 100 | |
Oxford, PA Weather
The average high in Oxford is 62.7° and the average low is 42.6°.
There are 77.0 days of precipitation each year.
Expect an average of 47.0 inches of precipitation each year with 23.2 inches of snow.
| Stat | Oxford |
|---|---|
| Average Annual High | 62.7 |
| Average Annual Low | 42.6 |
| Annual Precipitation Days | 77.0 |
| Average Annual Precipitation | 47.0 |
| Average Annual Snowfall | 23.2 |
Average High
Days of Rain
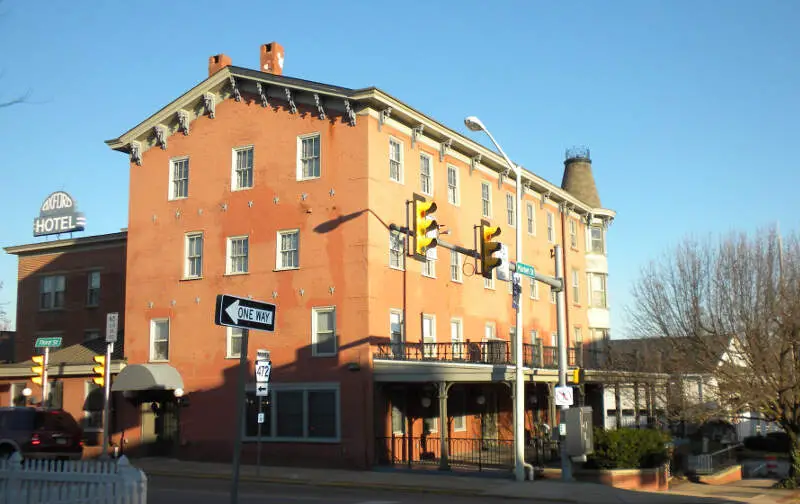
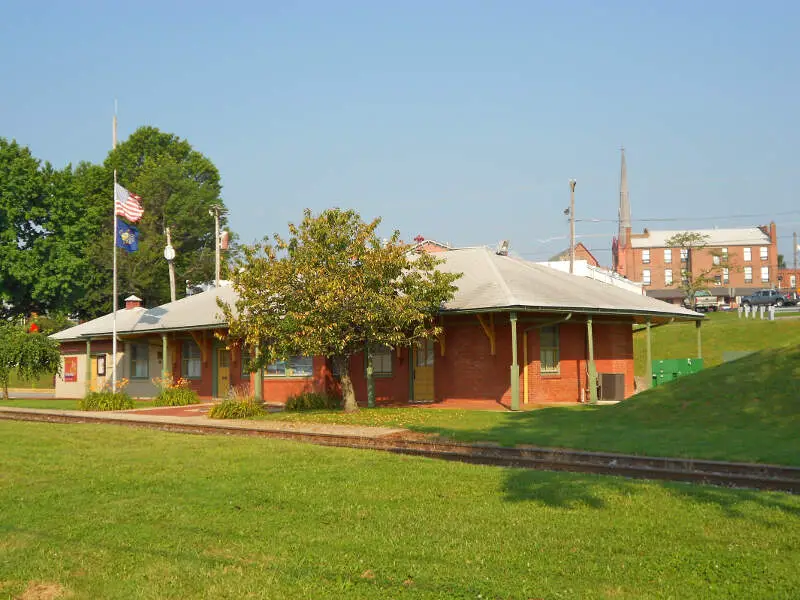
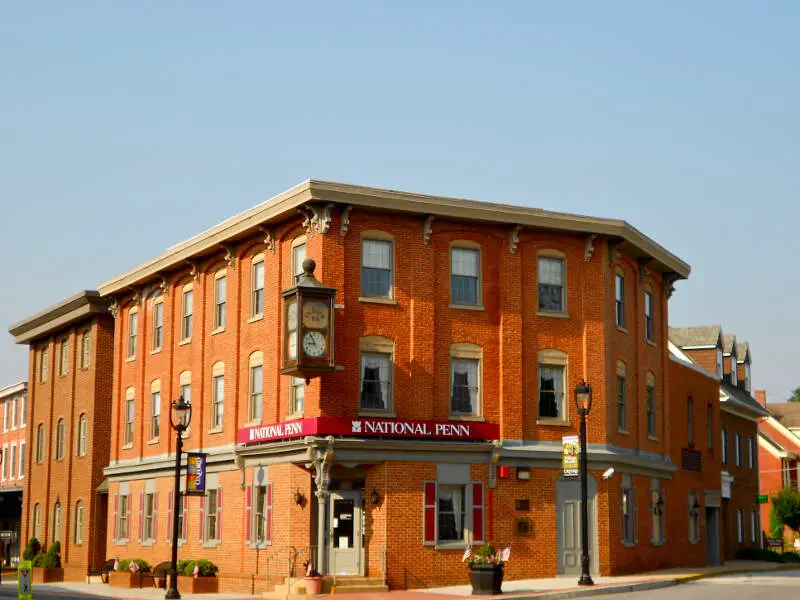
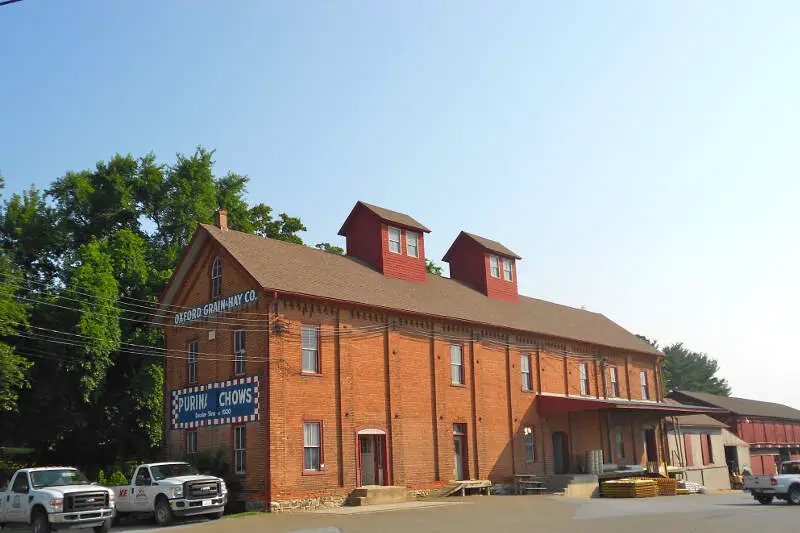
Oxford, PA Photos
Rankings for Oxford in Pennsylvania


Locations Around Oxford
Map Of Oxford, PA
Best Places Around Oxford
Kennett Square, PA
Population 6,096
Coatesville, PA
Population 13,323
Havre de Grace, MD
Population 14,857
Pike Creek, DE
Population 7,185
Hockessin, DE
Population 13,608
North Star, DE
Population 8,178
Glasgow, DE
Population 16,095
Pike Creek Valley, DE
Population 11,992
Bear, DE
Population 22,604
Oxford Demographics And Statistics
Population over time in Oxford
The current population in Oxford is 5,763. The population has increased 15.9% from 2010.
| Year | Population | % Change |
|---|---|---|
| 2023 | 5,763 | 0.7% |
| 2022 | 5,724 | 0.9% |
| 2021 | 5,671 | 2.0% |
| 2020 | 5,560 | 0.8% |
| 2019 | 5,515 | 1.8% |
| 2018 | 5,420 | 1.7% |
| 2017 | 5,327 | 2.0% |
| 2016 | 5,221 | 1.1% |
| 2015 | 5,163 | 1.2% |
| 2014 | 5,100 | 0.2% |
| 2013 | 5,091 | 0.4% |
| 2012 | 5,069 | 0.6% |
| 2011 | 5,038 | 1.3% |
| 2010 | 4,971 | - |
Race / Ethnicity in Oxford
Oxford is:
49.6% White with 2,856 White residents.
7.7% African American with 445 African American residents.
0.0% American Indian with 0 American Indian residents.
0.7% Asian with 42 Asian residents.
0.0% Hawaiian with 0 Hawaiian residents.
0.0% Other with 0 Other residents.
3.3% Two Or More with 193 Two Or More residents.
38.6% Hispanic with 2,227 Hispanic residents.
| Race | Oxford | PA | USA |
|---|---|---|---|
| White | 49.6% | 73.8% | 58.2% |
| African American | 7.7% | 10.3% | 12.0% |
| American Indian | 0.0% | 0.1% | 0.5% |
| Asian | 0.7% | 3.7% | 5.7% |
| Hawaiian | 0.0% | 0.0% | 0.2% |
| Other | 0.0% | 0.4% | 0.5% |
| Two Or More | 3.3% | 3.3% | 3.9% |
| Hispanic | 38.6% | 8.4% | 19.0% |
Gender in Oxford
Oxford is 44.9% female with 2,586 female residents.
Oxford is 55.1% male with 3,177 male residents.
| Gender | Oxford | PA | USA |
|---|---|---|---|
| Female | 44.9% | 50.7% | 50.5% |
| Male | 55.1% | 49.3% | 49.5% |
Highest level of educational attainment in Oxford for adults over 25
7.0% of adults in Oxford completed < 9th grade.
11.0% of adults in Oxford completed 9-12th grade.
30.0% of adults in Oxford completed high school / ged.
13.0% of adults in Oxford completed some college.
7.0% of adults in Oxford completed associate's degree.
15.0% of adults in Oxford completed bachelor's degree.
13.0% of adults in Oxford completed master's degree.
1.0% of adults in Oxford completed professional degree.
3.0% of adults in Oxford completed doctorate degree.
| Education | Oxford | PA | USA |
|---|---|---|---|
| < 9th Grade | 7.0% | 3.0% | 5.0% |
| 9-12th Grade | 11.0% | 5.0% | 6.0% |
| High School / GED | 30.0% | 33.0% | 26.0% |
| Some College | 13.0% | 15.0% | 19.0% |
| Associate's Degree | 7.0% | 9.0% | 9.0% |
| Bachelor's Degree | 15.0% | 21.0% | 21.0% |
| Master's Degree | 13.0% | 10.0% | 10.0% |
| Professional Degree | 1.0% | 2.0% | 2.0% |
| Doctorate Degree | 3.0% | 2.0% | 2.0% |
Household Income For Oxford, Pennsylvania
2.7% of households in Oxford earn Less than $10,000.
4.0% of households in Oxford earn $10,000 to $14,999.
11.6% of households in Oxford earn $15,000 to $24,999.
5.4% of households in Oxford earn $25,000 to $34,999.
20.5% of households in Oxford earn $35,000 to $49,999.
14.2% of households in Oxford earn $50,000 to $74,999.
8.5% of households in Oxford earn $75,000 to $99,999.
16.3% of households in Oxford earn $100,000 to $149,999.
6.3% of households in Oxford earn $150,000 to $199,999.
10.5% of households in Oxford earn $200,000 or more.
| Income | Oxford | PA | USA |
|---|---|---|---|
| Less than $10,000 | 2.7% | 4.8% | 4.9% |
| $10,000 to $14,999 | 4.0% | 3.7% | 3.6% |
| $15,000 to $24,999 | 11.6% | 7.0% | 6.6% |
| $25,000 to $34,999 | 5.4% | 7.1% | 6.8% |
| $35,000 to $49,999 | 20.5% | 10.7% | 10.4% |
| $50,000 to $74,999 | 14.2% | 16.1% | 15.7% |
| $75,000 to $99,999 | 8.5% | 12.9% | 12.7% |
| $100,000 to $149,999 | 16.3% | 17.6% | 17.4% |
| $150,000 to $199,999 | 6.3% | 9.0% | 9.3% |
| $200,000 or more | 10.5% | 11.1% | 12.6% |


