Want to know where Connecticut’s 17 billionaires and 122,000 millionaires live? Look here.
That’s right, the Gold Coast didn’t get its name because prospectors found gold on Connecticut’s beaches. It’s because there are a bunch of well-to-do people who call this New England state home. There’s a reason The Nutmeg State is one of the richest in the country.
The richest places in Connecticut are a lot like expensive diamonds. Everyone with means tries to get their hands on one. The competition for the top ten richest places in The Constitution State was quite fierce, so to narrow down our list, we looked at the 75 Connecticut cities with at least 3,000 residents. We measured home prices from Zillow and incomes from the Census for each city.
If you want to live in one of Connecticut’s wealthiest places, you’ll need to make upwards of $132,326/year.
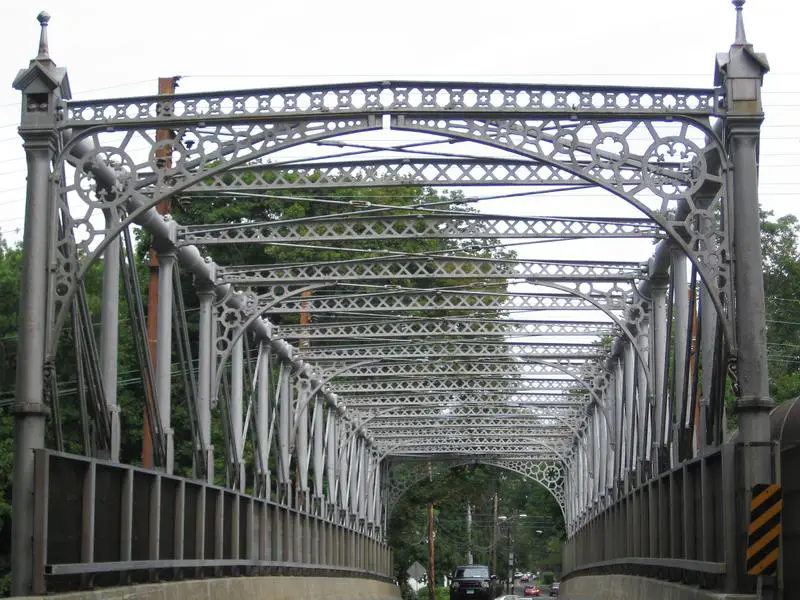
$250,001 median income · 3.3% poverty · #2 income in Connecticut
 Located in
Fairfield County, Connecticut
Located in
Fairfield County, Connecticut
Data | Crime | Cost of living | Movers
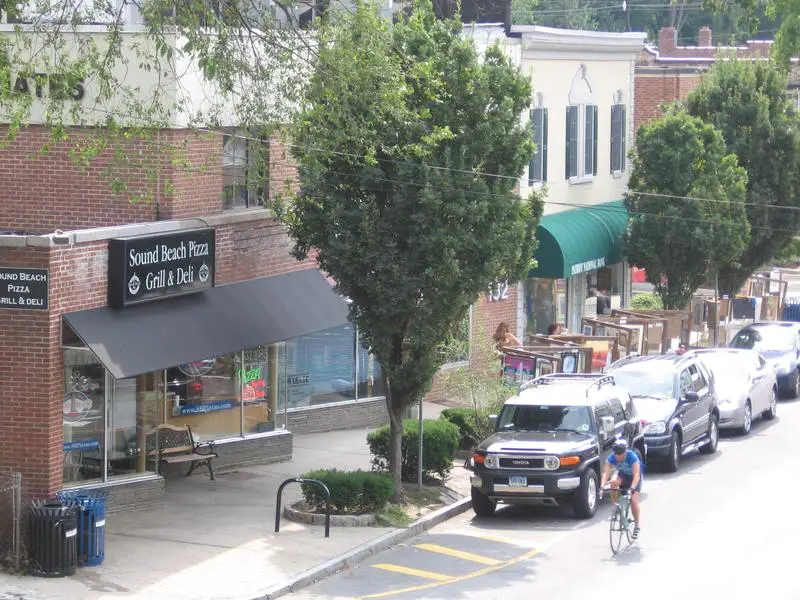
$250,001 median income · 3.6% poverty · #2 income in Connecticut
 Located in
Fairfield County, Connecticut
Located in
Fairfield County, Connecticut
Data | Crime | Cost of living | Movers
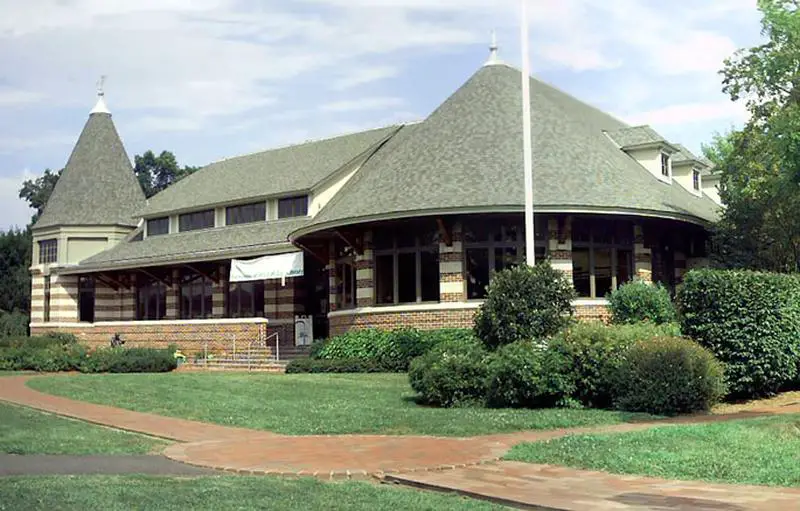
$190,481 median income · 5.6% poverty · #3 income in Connecticut
 Located in
Fairfield County, Connecticut
Located in
Fairfield County, Connecticut
Cos Cob is a neighborhood and census-designated place in the town of Greenwich, Connecticut. It is located at 41.033 north, 73.6 west, on the Connecticut shoreline in southern Fairfield County. It had a population of 6,770 at the 2010 census.
Data | Crime | Cost of living | Movers
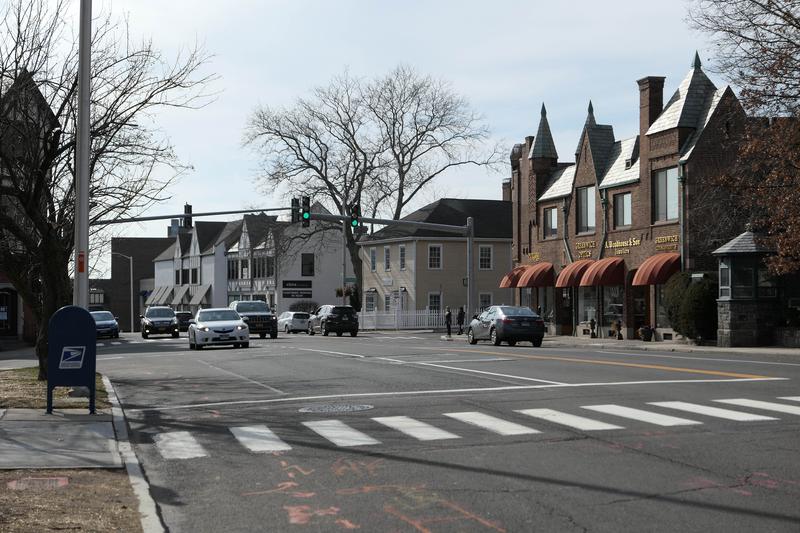
$134,914 median income · 11.2% poverty · #9 income in Connecticut
 Located in
Fairfield County, Connecticut
Located in
Fairfield County, Connecticut
Greenwich is a town in Fairfield County, Connecticut, United States. As of the 2010 census, the town had a total population of 61,171. The largest town on Connecticut’s Gold Coast, it is home to many hedge funds and other financial service companies. Greenwich is the southernmost and westernmost municipality in Connecticut as well as the six-state region of New England. It takes roughly 40-50 minutes by train from Grand Central Terminal in Manhattan. CNN/Money and Money magazine ranked Greenwich 12th on its list of the “100 Best Places to Live in the United States” in 2005. The town is named after Greenwich, a borough of London in the United Kingdom.
Data | Crime | Cost of living | Movers
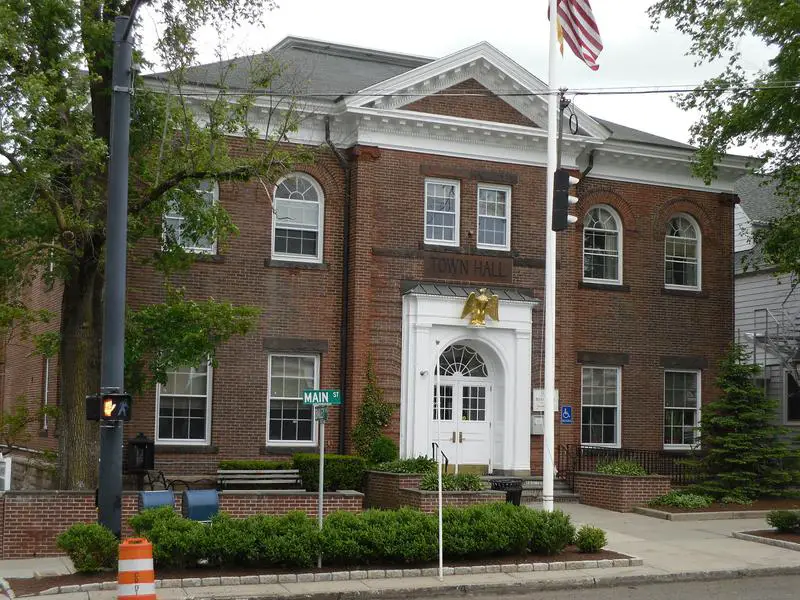
$148,279 median income · 2.5% poverty · #6 income in Connecticut
 Located in
Fairfield County, Connecticut
Located in
Fairfield County, Connecticut
Ridgefield is a town in Fairfield County, Connecticut, United States. Situated in the foothills of the Berkshire Mountains, the 300-year-old community had a population of 24,638 at the 2010 census. The town center, which was formerly a borough, is defined by the U.S. Census Bureau as a census-designated place.
Data | Crime | Cost of living | Movers
$152,559 median income · 2.1% poverty · #4 income in Connecticut
Data | Movers
$132,326 median income · 8.4% poverty · #11 income in Connecticut
Data | Movers
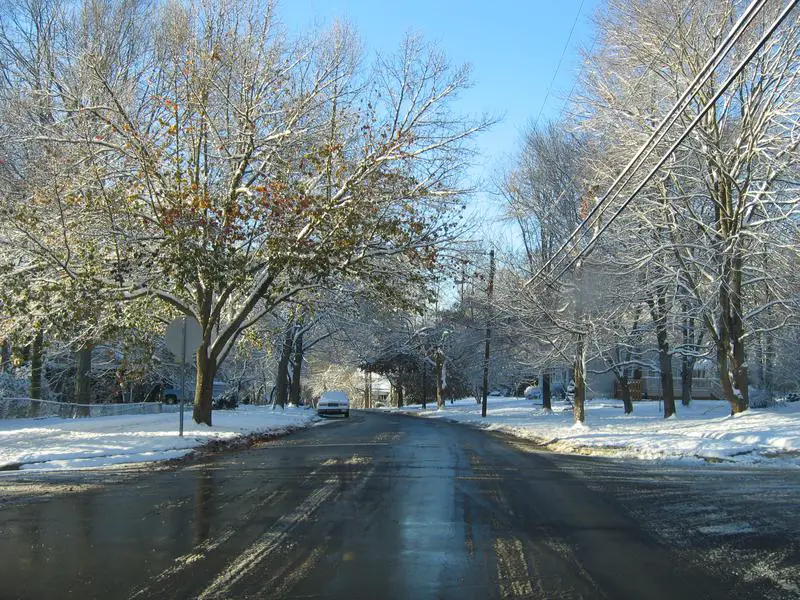
$142,325 median income · 3.9% poverty · #7 income in Connecticut
 Located in
New Haven County, Connecticut
Located in
New Haven County, Connecticut
Orange is a town in New Haven County, Connecticut, United States. The population was 13,956 at the 2010 census. The town is governed by a Board of Selectmen.
Data | Crime | Cost of living | Movers
$152,396 median income · 6.1% poverty · #5 income in Connecticut
Data | Movers
$138,242 median income · 3.9% poverty · #8 income in Connecticut
 Located in
Hartford County, Connecticut
Located in
Hartford County, Connecticut
Data | Crime | Cost of living | Movers
The receipts
Compare the top ten
Pick a metric. The bars rescale. The red line is Connecticut’s statewide median.
Connecticut statewide median: $95,781
Connecticut statewide median: $436,407
Connecticut statewide median: 10.0%
Connecticut statewide median: 5.6%
On the map
Where the money lives in Connecticut
Saturday Night Science
How we determined the richest places in Connecticut for 2026
The first thing most people reach for is personal income. After all, rich people have really high salaries. But one statistic doesn’t capture what it means to be one of the “richest places,” so we applied Saturday Night Science to two measures from the 2020-2024 American Community Survey:
- Median household income
- Median home value
Median household income is the most digestible way to understand how rich a place is, and home values are a measure of accumulated wealth. The two combine to define a “Rich City.”
After collecting the data for all 75 places in Connecticut with more than 3,000 people, we ranked each place from 1 to 75 on both criteria, then averaged the two ranks into a “Rich Score.” The place with the lowest Rich Score, Riverside, is crowned the richest city in Connecticut for 2026. The median Connecticut home is 59 years old — old enough that it pays to compare home warranty plans before something expensive breaks.
The full plate
All 75 richest cities in Connecticut, ranked
Click any column to sort. Search by city name.
| Rank | City | Rich Score | Population | Median income | Median home value | Poverty | Unemployment |
|---|---|---|---|---|---|---|---|
| 1 | Riverside | 1.75 | 8,954 | $250,001 | $2,260,301 | 3.3% | 5.5% |
| 2 | Old Greenwich | 2.25 | 6,936 | $250,001 | $2,194,168 | 3.6% | 4.6% |
| 3 | Cos Cob | 3.50 | 7,546 | $190,481 | $1,439,703 | 5.6% | 6.7% |
| 4 | Greenwich | 5.00 | 14,792 | $134,914 | $2,265,962 | 11.2% | 8.1% |
| 5 | Ridgefield | 6.50 | 6,970 | $148,279 | $977,266 | 2.5% | 4.7% |
| 6 | Mystic | 7.00 | 4,483 | $152,559 | $640,872 | 2.1% | 2.9% |
| 7 | Pemberwick | 8.00 | 3,665 | $132,326 | $1,118,315 | 8.4% | 2.1% |
| 8 | Orange | 9.00 | 14,315 | $142,325 | $619,525 | 3.9% | 3.3% |
| 9 | Durham | 10.50 | 3,347 | $152,396 | $494,741 | 6.1% | 5.5% |
| 10 | Simsbury Center | 13.00 | 6,198 | $138,242 | $491,003 | 3.9% | 5.7% |
| 11 | Stamford | 13.00 | 137,144 | $111,586 | $704,417 | 10.1% | 4.9% |
| 12 | Cheshire Village | 15.50 | 6,172 | $117,218 | $504,443 | 7.3% | 3.4% |
| 13 | West Hartford | 16.00 | 63,620 | $129,890 | $487,818 | 6.3% | 4.1% |
| 14 | Norwalk | 16.50 | 92,187 | $107,616 | $653,113 | 9.1% | 5.2% |
| 15 | North Haven | 16.50 | 24,336 | $132,689 | $460,566 | 4.1% | 2.0% |
| 16 | Byram | 17.50 | 4,633 | $99,734 | $997,230 | 3.2% | 11.4% |
| 17 | Shelton | 18.00 | 41,889 | $108,185 | $549,374 | 6.6% | 4.9% |
| 18 | Milford | 18.00 | 51,023 | $111,201 | $493,542 | 5.2% | 4.4% |
| 19 | Wethersfield | 21.50 | 27,250 | $126,806 | $424,098 | 6.9% | 3.4% |
| 20 | Old Mystic | 22.00 | 3,340 | $130,903 | $407,385 | 5.3% | 3.2% |
| 21 | East Hampton | 22.50 | 3,347 | $123,929 | $419,506 | 3.8% | 1.5% |
| 22 | Bethel | 23.50 | 11,404 | $90,848 | $554,248 | 5.8% | 3.6% |
| 23 | Glastonbury Center | 25.00 | 7,266 | $107,357 | $444,019 | 7.9% | 2.2% |
| 24 | Clinton | 26.00 | 3,465 | $102,750 | $452,128 | 10.2% | 7.8% |
| 25 | Collinsville | 27.00 | 3,963 | $94,815 | $470,425 | 7.7% | 4.8% |
| 26 | Northwest Harwinton | 28.50 | 3,088 | $109,458 | $393,111 | 5.8% | 4.1% |
| 27 | Lake Pocotopaug | 29.50 | 4,875 | $118,150 | $369,085 | 4.2% | 3.1% |
| 28 | Kensington | 29.50 | 9,962 | $109,447 | $392,992 | 3.2% | 2.3% |
| 29 | Niantic | 29.50 | 3,123 | $81,250 | $503,381 | 3.6% | 3.4% |
| 30 | Danbury | 30.50 | 87,263 | $83,393 | $478,979 | 11.7% | 6.5% |
| 31 | Broad Brook | 31.50 | 3,609 | $97,625 | $403,595 | 9.9% | 6.0% |
| 32 | New Milford | 32.00 | 8,188 | $83,235 | $460,616 | 8.4% | 4.9% |
| 33 | Colchester | 32.50 | 4,692 | $86,760 | $430,179 | 5.7% | 3.0% |
| 34 | Watertown | 32.50 | 3,897 | $103,200 | $381,343 | 13.2% | 2.3% |
| 35 | Newington | 34.50 | 30,896 | $102,884 | $369,180 | 6.4% | 3.6% |
| 36 | Portland | 36.00 | 5,944 | $89,401 | $402,704 | 4.7% | 3.1% |
| 37 | Pawcatuck | 36.50 | 5,577 | $80,114 | $428,914 | 14.4% | 4.9% |
| 38 | Groton | 37.50 | 9,490 | $79,577 | $425,384 | 18.6% | 6.0% |
| 39 | Southwood Acres | 38.50 | 8,115 | $110,286 | $318,652 | 3.3% | 1.9% |
| 40 | Wallingford Center | 38.50 | 18,208 | $89,959 | $379,671 | 7.1% | 4.6% |
| 41 | Naugatuck | 39.50 | 31,800 | $96,324 | $346,062 | 6.3% | 5.1% |
| 42 | Ansonia | 40.50 | 19,033 | $85,877 | $374,885 | 9.4% | 9.1% |
| 43 | East Haven | 40.50 | 27,806 | $94,628 | $353,436 | 7.2% | 4.9% |
| 44 | Oakville | 42.50 | 9,276 | $95,515 | $333,639 | 2.4% | 2.2% |
| 45 | Waterford | 42.50 | 3,304 | $73,156 | $417,642 | 7.0% | 6.2% |
| 46 | Branford Center | 44.00 | 6,305 | $74,150 | $393,230 | 12.7% | 4.4% |
| 47 | Middletown | 47.00 | 47,958 | $79,438 | $354,795 | 12.0% | 4.7% |
| 48 | Sherwood Manor | 48.00 | 5,706 | $90,821 | $303,665 | 5.0% | 5.0% |
| 49 | West Haven | 48.50 | 55,351 | $74,382 | $354,725 | 14.1% | 7.3% |
| 50 | Windsor Locks | 49.50 | 12,579 | $81,205 | $327,845 | 10.9% | 5.8% |
| 51 | Derby | 49.50 | 12,487 | $79,500 | $336,765 | 10.8% | 5.6% |
| 52 | Bristol | 50.00 | 61,462 | $79,076 | $339,024 | 10.7% | 7.3% |
| 53 | Manchester | 54.00 | 36,759 | $74,267 | $323,532 | 12.5% | 5.5% |
| 54 | Putnam | 54.50 | 7,120 | $65,511 | $343,176 | 11.7% | 4.1% |
| 55 | Hazardville | 55.00 | 6,022 | $81,893 | $288,916 | 5.8% | 5.9% |
| 56 | Bridgeport | 55.50 | 149,153 | $58,685 | $355,127 | 21.0% | 9.0% |
| 57 | Storrs | 56.50 | 15,207 | $37,839 | $386,688 | 44.7% | 13.5% |
| 58 | Meriden | 57.50 | 60,545 | $71,253 | $315,833 | 13.2% | 8.0% |
| 59 | Stafford Springs | 59.00 | 4,649 | $59,028 | $334,109 | 12.4% | 4.8% |
| 60 | Terryville | 60.00 | 5,461 | $72,813 | $289,986 | 12.7% | 5.4% |
| 61 | East Hartford | 60.00 | 50,918 | $70,778 | $300,292 | 13.2% | 5.4% |
| 62 | Torrington | 60.50 | 35,547 | $70,856 | $295,024 | 13.7% | 6.8% |
| 63 | New Haven | 62.00 | 134,349 | $56,851 | $326,440 | 23.9% | 8.4% |
| 64 | New London | 62.00 | 27,625 | $59,098 | $312,695 | 21.6% | 6.5% |
| 65 | Thompsonville | 62.00 | 7,927 | $71,805 | $287,370 | 18.7% | 6.2% |
| 66 | Norwich | 62.50 | 39,973 | $65,024 | $293,052 | 16.7% | 8.2% |
| 67 | New Britain | 65.00 | 74,223 | $58,613 | $298,511 | 18.1% | 7.9% |
| 68 | Heritage Village | 65.00 | 4,968 | $62,059 | $289,154 | 5.6% | 4.5% |
| 69 | Winsted | 66.00 | 6,977 | $64,871 | $272,293 | 15.9% | 3.9% |
| 70 | Danielson | 67.00 | 4,209 | $64,050 | $267,149 | 21.1% | 17.1% |
| 71 | Waterbury | 70.00 | 114,869 | $51,886 | $276,344 | 24.7% | 9.3% |
| 72 | Jewett City | 72.00 | 3,429 | $55,530 | $234,202 | 13.9% | 5.3% |
| 73 | Rockville | 72.50 | 7,072 | $51,232 | $260,131 | 30.6% | 7.0% |
| 74 | Willimantic | 73.00 | 18,096 | $45,962 | $266,600 | 23.4% | 6.5% |
| 75 | Hartford | 74.00 | 121,127 | $46,411 | $198,965 | 26.3% | 10.7% |
Source: U.S. Census ACS 2020-2024, Zillow research. 75 cities with more than 3,000 residents.
Riverside is the richest place in Connecticut for 2026
When we set out to identify the richest places in Connecticut, we weren’t sure what we’d find, but it ended up being some of the best places to live in the state. The richest cities in Connecticut are Riverside, Old Greenwich, and Cos Cob, and when you look at the data they sit at the very top of the income ladder for everyone who lives there.
Breaking into the top ten takes a median household income of at least $132,326. If you’re curious about the other end of the ledger, the poorest places are listed to the right. Not sold on Connecticut? Take the two-minute Find Your Place quiz and see which state actually fits you.
Questions and answers
Richest Cities In Connecticut FAQs
What is the richest city in Connecticut?
Riverside is the richest city in Connecticut for 2026. The median household income in Riverside is $250,001, the median home value is $2,260,301, and the poverty rate sits at 3.3%. Old Greenwich and Cos Cob round out the top three.
Where do the richest people live in Connecticut?
The richest people in Connecticut live in Riverside, Old Greenwich, and Cos Cob, based on income and home value data from the American Community Survey. Every place in the top ten posts a median household income of at least $132,326.
How much money do you need to be considered rich in Connecticut?
You need a household income around $132,326 to keep up in the ten richest places in Connecticut. That is the lowest median income in the top ten; the highest is $250,001. The statewide median is $95,781.
How expensive are homes in the richest cities in Connecticut?
The median home value across the ten richest cities in Connecticut is $1,047,790, compared to $436,407 statewide. In Riverside, the typical home runs $2,260,301.
What is the poorest city in Connecticut?
Hartford is the poorest city in Connecticut. It ranks last of the 75 places we analyzed on income and home value.