Cheraw, SC
Demographics And Statistics
Living In Cheraw, South Carolina Summary
Life in Cheraw research summary. HomeSnacks has been using Saturday Night Science to research the quality of life in Cheraw over the past nine years using Census, FBI, Zillow, and other primary data sources. Based on the most recently available data, we found the following about life in Cheraw:
The population in Cheraw is 5,024.
The median home value in Cheraw is $151,837.
The median income in Cheraw is $27,275.
The cost of living in Cheraw is 90 which is 0.9x lower than the national average.
The median rent in Cheraw is $806.
The unemployment rate in Cheraw is 14.9%.
The poverty rate in Cheraw is 35.4%.
The average high in Cheraw is 73.8° and the average low is 50.0°.
Cheraw SnackAbility
Overall SnackAbility
Cheraw, SC Crime Report
Crime in Cheraw summary. We use data from the FBI to determine the crime rates in Cheraw. Key points include:
There were 421 total crimes in Cheraw in the last reporting year.
The overall crime rate per 100,000 people in Cheraw is 8,447.0 / 100k people.
The violent crime rate per 100,000 people in Cheraw is 1,163.7 / 100k people.
The property crime rate per 100,000 people in Cheraw is 7,283.3 / 100k people.
Overall, crime in Cheraw is 298.59% above the national average.
Total Crimes
Above National Average
Crime In Cheraw Comparison Table
| Statistic | Count Raw |
Cheraw / 100k People |
South Carolina / 100k People |
National / 100k People |
|---|---|---|---|---|
| Total Crimes Per 100K | 421 | 8,447.0 | 2,402.5 | 2,119.2 |
| Violent Crime | 58 | 1,163.7 | 436.7 | 359.0 |
| Murder | 5 | 100.3 | 7.5 | 5.0 |
| Robbery | 5 | 100.3 | 35.1 | 61.0 |
| Aggravated Assault | 43 | 862.8 | 357.1 | 256.0 |
| Property Crime | 363 | 7,283.3 | 1,965.8 | 1,760.0 |
| Burglary | 48 | 963.1 | 282.4 | 229.0 |
| Larceny | 288 | 5,778.5 | 1,468.2 | 1,272.0 |
| Car Theft | 27 | 541.7 | 215.1 | 259.0 |
Cheraw, SC Cost Of Living
Cost of living in Cheraw summary. We use data on the cost of living to determine how expensive it is to live in Cheraw. Real estate prices drive most of the variance in cost of living around South Carolina. Key points include:
The cost of living in Cheraw is 90 with 100 being average.
The cost of living in Cheraw is 0.9x lower than the national average.
The median home value in Cheraw is $151,837.
The median income in Cheraw is $27,275.
Cheraw's Overall Cost Of Living
Lower Than The National Average
Cost Of Living In Cheraw Comparison Table
| Living Expense | Cheraw | South Carolina | National Average | |
|---|---|---|---|---|
| Overall | 90 | 93 | 100 | |
| Services | 104 | 102 | 100 | |
| Groceries | 101 | 97 | 100 | |
| Health | 112 | 92 | 100 | |
| Housing | 67 | 81 | 100 | |
| Transportation | 96 | 92 | 100 | |
| Utilities | 89 | 109 | 100 | |
Cheraw, SC Weather
The average high in Cheraw is 73.8° and the average low is 50.0°.
There are 64.4 days of precipitation each year.
Expect an average of 44.9 inches of precipitation each year with 0.9 inches of snow.
| Stat | Cheraw |
|---|---|
| Average Annual High | 73.8 |
| Average Annual Low | 50.0 |
| Annual Precipitation Days | 64.4 |
| Average Annual Precipitation | 44.9 |
| Average Annual Snowfall | 0.9 |
Average High
Days of Rain
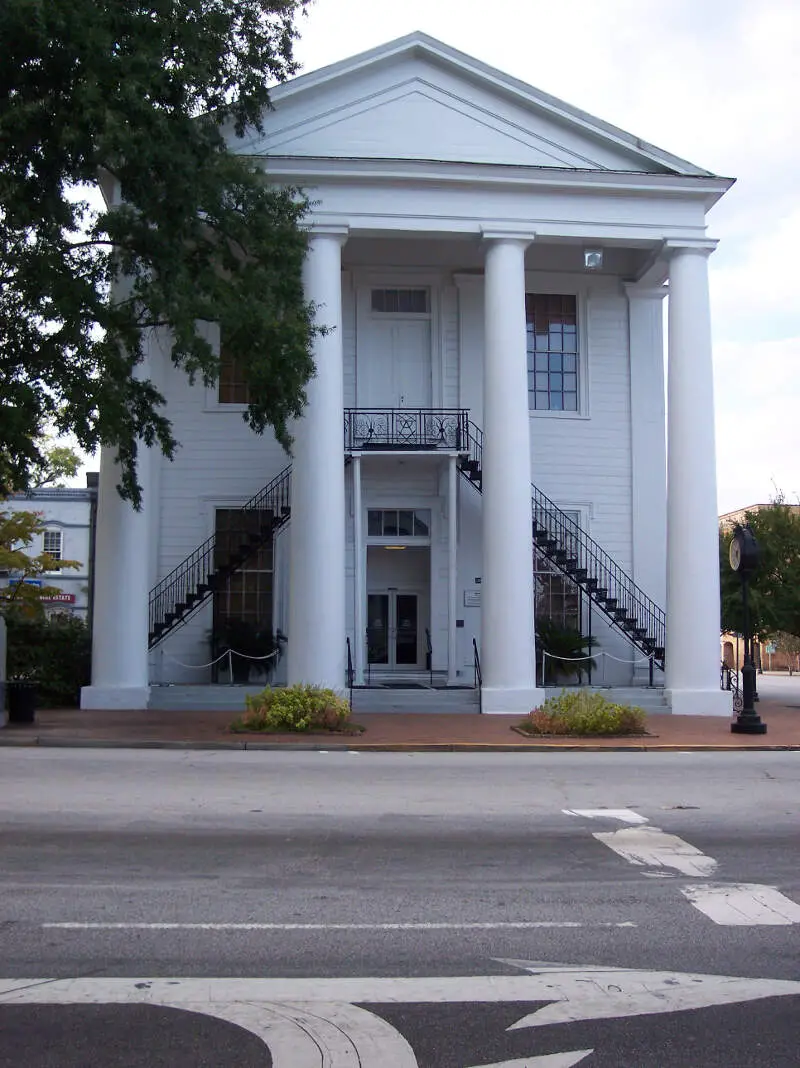
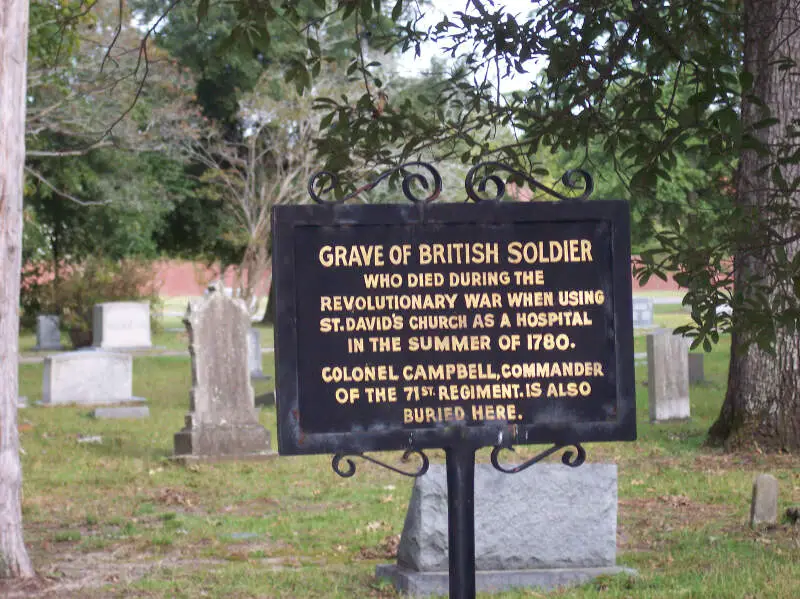
Cheraw, SC Photos
1 Reviews & Comments About Cheraw
/5

HomeSnacks User - None
I am from Chesterfied and to say Cheraw is one of the worst places in the state to live is outrageous. The towns of Chesterfield and Cheraw may be rivals in sports but that's where it stops with me. The historic downtown part is beautiful. It has many great people and great businesses! I have many friends and family members that live in Cheraw that will certainly agree with me.
Rankings for Cheraw in South Carolina


Locations Around Cheraw
Map Of Cheraw, SC
Best Places Around Cheraw
Indian Trail, NC
Population 41,146
Wesley Chapel, NC
Population 8,923
Pinehurst, NC
Population 17,992
Unionville, NC
Population 6,826
Monroe, NC
Population 35,596
Southern Pines, NC
Population 16,052
Albemarle, NC
Population 16,527
Florence, SC
Population 40,205
Aberdeen, NC
Population 8,969
Cheraw Demographics And Statistics
Population over time in Cheraw
The current population in Cheraw is 5,024. The population has decreased -13.8% from 2010.
| Year | Population | % Change |
|---|---|---|
| 2023 | 5,024 | -0.6% |
| 2022 | 5,056 | -0.7% |
| 2021 | 5,090 | -9.0% |
| 2020 | 5,596 | -1.1% |
| 2019 | 5,657 | -0.8% |
| 2018 | 5,701 | -0.0% |
| 2017 | 5,702 | -1.6% |
| 2016 | 5,793 | -0.1% |
| 2015 | 5,800 | -0.2% |
| 2014 | 5,809 | -0.4% |
| 2013 | 5,835 | 0.0% |
| 2012 | 5,835 | -0.1% |
| 2011 | 5,838 | 0.2% |
| 2010 | 5,828 | - |
Race / Ethnicity in Cheraw
Cheraw is:
36.3% White with 1,826 White residents.
53.4% African American with 2,682 African American residents.
0.2% American Indian with 10 American Indian residents.
1.4% Asian with 68 Asian residents.
0.0% Hawaiian with 0 Hawaiian residents.
0.0% Other with 0 Other residents.
2.2% Two Or More with 111 Two Or More residents.
6.5% Hispanic with 327 Hispanic residents.
| Race | Cheraw | SC | USA |
|---|---|---|---|
| White | 36.3% | 62.2% | 58.2% |
| African American | 53.4% | 25.1% | 12.0% |
| American Indian | 0.2% | 0.2% | 0.5% |
| Asian | 1.4% | 1.7% | 5.7% |
| Hawaiian | 0.0% | 0.1% | 0.2% |
| Other | 0.0% | 0.4% | 0.5% |
| Two Or More | 2.2% | 3.2% | 3.9% |
| Hispanic | 6.5% | 7.1% | 19.0% |
Gender in Cheraw
Cheraw is 49.0% female with 2,460 female residents.
Cheraw is 51.0% male with 2,564 male residents.
| Gender | Cheraw | SC | USA |
|---|---|---|---|
| Female | 49.0% | 51.3% | 50.5% |
| Male | 51.0% | 48.7% | 49.5% |
Highest level of educational attainment in Cheraw for adults over 25
5.0% of adults in Cheraw completed < 9th grade.
12.0% of adults in Cheraw completed 9-12th grade.
35.0% of adults in Cheraw completed high school / ged.
17.0% of adults in Cheraw completed some college.
10.0% of adults in Cheraw completed associate's degree.
15.0% of adults in Cheraw completed bachelor's degree.
5.0% of adults in Cheraw completed master's degree.
1.0% of adults in Cheraw completed professional degree.
0.0% of adults in Cheraw completed doctorate degree.
| Education | Cheraw | SC | USA |
|---|---|---|---|
| < 9th Grade | 5.0% | 4.0% | 5.0% |
| 9-12th Grade | 12.0% | 7.0% | 6.0% |
| High School / GED | 35.0% | 28.0% | 26.0% |
| Some College | 17.0% | 20.0% | 19.0% |
| Associate's Degree | 10.0% | 10.0% | 9.0% |
| Bachelor's Degree | 15.0% | 19.0% | 21.0% |
| Master's Degree | 5.0% | 9.0% | 10.0% |
| Professional Degree | 1.0% | 2.0% | 2.0% |
| Doctorate Degree | 0.0% | 1.0% | 2.0% |
Household Income For Cheraw, South Carolina
15.5% of households in Cheraw earn Less than $10,000.
8.0% of households in Cheraw earn $10,000 to $14,999.
18.0% of households in Cheraw earn $15,000 to $24,999.
15.0% of households in Cheraw earn $25,000 to $34,999.
13.9% of households in Cheraw earn $35,000 to $49,999.
7.6% of households in Cheraw earn $50,000 to $74,999.
6.5% of households in Cheraw earn $75,000 to $99,999.
7.2% of households in Cheraw earn $100,000 to $149,999.
5.9% of households in Cheraw earn $150,000 to $199,999.
2.3% of households in Cheraw earn $200,000 or more.
| Income | Cheraw | SC | USA |
|---|---|---|---|
| Less than $10,000 | 15.5% | 5.9% | 4.9% |
| $10,000 to $14,999 | 8.0% | 4.0% | 3.6% |
| $15,000 to $24,999 | 18.0% | 7.8% | 6.6% |
| $25,000 to $34,999 | 15.0% | 8.0% | 6.8% |
| $35,000 to $49,999 | 13.9% | 12.3% | 10.4% |
| $50,000 to $74,999 | 7.6% | 17.2% | 15.7% |
| $75,000 to $99,999 | 6.5% | 12.9% | 12.7% |
| $100,000 to $149,999 | 7.2% | 16.1% | 17.4% |
| $150,000 to $199,999 | 5.9% | 7.5% | 9.3% |
| $200,000 or more | 2.3% | 8.3% | 12.6% |


