Marion, SC
Demographics And Statistics
Living In Marion, South Carolina Summary
Life in Marion research summary. HomeSnacks has been using Saturday Night Science to research the quality of life in Marion over the past nine years using Census, FBI, Zillow, and other primary data sources. Based on the most recently available data, we found the following about life in Marion:
The population in Marion is 6,338.
The median home value in Marion is $122,574.
The median income in Marion is $27,767.
The cost of living in Marion is 90 which is 0.9x lower than the national average.
The median rent in Marion is $624.
The unemployment rate in Marion is 3.9%.
The poverty rate in Marion is 27.5%.
The average high in Marion is 74.9° and the average low is 51.6°.
Marion SnackAbility
Overall SnackAbility
Marion, SC Crime Report
Crime in Marion summary. We use data from the FBI to determine the crime rates in Marion. Key points include:
There were 379 total crimes in Marion in the last reporting year.
The overall crime rate per 100,000 people in Marion is 6,189.8 / 100k people.
The violent crime rate per 100,000 people in Marion is 881.9 / 100k people.
The property crime rate per 100,000 people in Marion is 5,307.9 / 100k people.
Overall, crime in Marion is 192.08% above the national average.
Total Crimes
Above National Average
Crime In Marion Comparison Table
| Statistic | Count Raw |
Marion / 100k People |
South Carolina / 100k People |
National / 100k People |
|---|---|---|---|---|
| Total Crimes Per 100K | 379 | 6,189.8 | 2,402.5 | 2,119.2 |
| Violent Crime | 54 | 881.9 | 436.7 | 359.0 |
| Murder | 4 | 65.3 | 7.5 | 5.0 |
| Robbery | 8 | 130.7 | 35.1 | 61.0 |
| Aggravated Assault | 39 | 636.9 | 357.1 | 256.0 |
| Property Crime | 325 | 5,307.9 | 1,965.8 | 1,760.0 |
| Burglary | 46 | 751.3 | 282.4 | 229.0 |
| Larceny | 265 | 4,327.9 | 1,468.2 | 1,272.0 |
| Car Theft | 14 | 228.6 | 215.1 | 259.0 |
Marion, SC Cost Of Living
Cost of living in Marion summary. We use data on the cost of living to determine how expensive it is to live in Marion. Real estate prices drive most of the variance in cost of living around South Carolina. Key points include:
The cost of living in Marion is 90 with 100 being average.
The cost of living in Marion is 0.9x lower than the national average.
The median home value in Marion is $122,574.
The median income in Marion is $27,767.
Marion's Overall Cost Of Living
Lower Than The National Average
Cost Of Living In Marion Comparison Table
| Living Expense | Marion | South Carolina | National Average | |
|---|---|---|---|---|
| Overall | 90 | 93 | 100 | |
| Services | 98 | 102 | 100 | |
| Groceries | 100 | 97 | 100 | |
| Health | 88 | 92 | 100 | |
| Housing | 60 | 81 | 100 | |
| Transportation | 82 | 92 | 100 | |
| Utilities | 129 | 109 | 100 | |
Marion, SC Weather
The average high in Marion is 74.9° and the average low is 51.6°.
There are 74.4 days of precipitation each year.
Expect an average of 46.9 inches of precipitation each year with 1.0 inches of snow.
| Stat | Marion |
|---|---|
| Average Annual High | 74.9 |
| Average Annual Low | 51.6 |
| Annual Precipitation Days | 74.4 |
| Average Annual Precipitation | 46.9 |
| Average Annual Snowfall | 1.0 |
Average High
Days of Rain
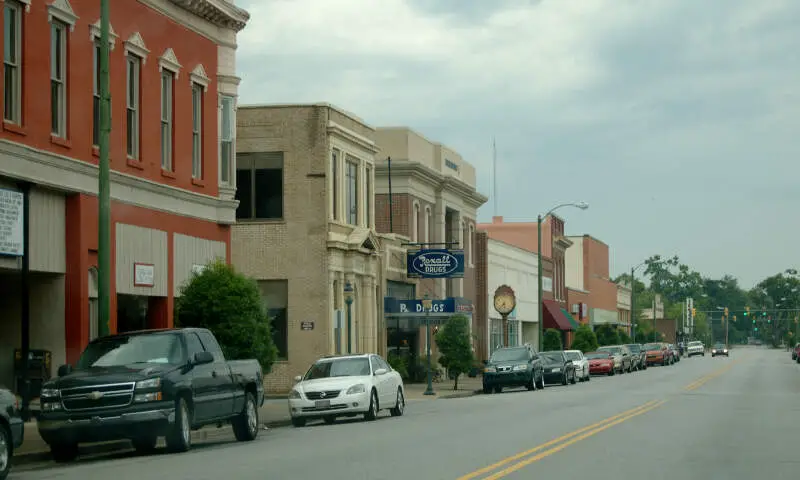
Marion, SC Photos
Rankings for Marion in South Carolina


Locations Around Marion
Map Of Marion, SC
Best Places Around Marion
Murrells Inlet, SC
Population 10,087
Red Hill, SC
Population 16,480
Little River, SC
Population 10,457
Socastee, SC
Population 24,629
Florence, SC
Population 40,205
North Myrtle Beach, SC
Population 19,343
Laurinburg, NC
Population 15,079
Hartsville, SC
Population 7,422
Conway, SC
Population 26,082
Myrtle Beach, SC
Population 37,214
Marion Demographics And Statistics
Population over time in Marion
The current population in Marion is 6,338. The population has decreased -9.1% from 2010.
| Year | Population | % Change |
|---|---|---|
| 2023 | 6,338 | -1.0% |
| 2022 | 6,402 | -1.1% |
| 2021 | 6,472 | -1.9% |
| 2020 | 6,598 | 2.0% |
| 2019 | 6,466 | -1.3% |
| 2018 | 6,548 | -0.6% |
| 2017 | 6,590 | -2.5% |
| 2016 | 6,756 | -0.5% |
| 2015 | 6,793 | -0.6% |
| 2014 | 6,833 | -0.6% |
| 2013 | 6,877 | -0.7% |
| 2012 | 6,924 | -0.4% |
| 2011 | 6,953 | -0.2% |
| 2010 | 6,970 | - |
Race / Ethnicity in Marion
Marion is:
27.8% White with 1,764 White residents.
69.2% African American with 4,386 African American residents.
1.2% American Indian with 73 American Indian residents.
0.7% Asian with 42 Asian residents.
0.0% Hawaiian with 0 Hawaiian residents.
0.0% Other with 0 Other residents.
0.7% Two Or More with 42 Two Or More residents.
0.5% Hispanic with 31 Hispanic residents.
| Race | Marion | SC | USA |
|---|---|---|---|
| White | 27.8% | 62.2% | 58.2% |
| African American | 69.2% | 25.1% | 12.0% |
| American Indian | 1.2% | 0.2% | 0.5% |
| Asian | 0.7% | 1.7% | 5.7% |
| Hawaiian | 0.0% | 0.1% | 0.2% |
| Other | 0.0% | 0.4% | 0.5% |
| Two Or More | 0.7% | 3.2% | 3.9% |
| Hispanic | 0.5% | 7.1% | 19.0% |
Gender in Marion
Marion is 54.2% female with 3,437 female residents.
Marion is 45.8% male with 2,901 male residents.
| Gender | Marion | SC | USA |
|---|---|---|---|
| Female | 54.2% | 51.3% | 50.5% |
| Male | 45.8% | 48.7% | 49.5% |
Highest level of educational attainment in Marion for adults over 25
3.0% of adults in Marion completed < 9th grade.
12.0% of adults in Marion completed 9-12th grade.
47.0% of adults in Marion completed high school / ged.
13.0% of adults in Marion completed some college.
6.0% of adults in Marion completed associate's degree.
8.0% of adults in Marion completed bachelor's degree.
11.0% of adults in Marion completed master's degree.
0.0% of adults in Marion completed professional degree.
0.0% of adults in Marion completed doctorate degree.
| Education | Marion | SC | USA |
|---|---|---|---|
| < 9th Grade | 3.0% | 4.0% | 5.0% |
| 9-12th Grade | 12.0% | 7.0% | 6.0% |
| High School / GED | 47.0% | 28.0% | 26.0% |
| Some College | 13.0% | 20.0% | 19.0% |
| Associate's Degree | 6.0% | 10.0% | 9.0% |
| Bachelor's Degree | 8.0% | 19.0% | 21.0% |
| Master's Degree | 11.0% | 9.0% | 10.0% |
| Professional Degree | 0.0% | 2.0% | 2.0% |
| Doctorate Degree | 0.0% | 1.0% | 2.0% |
Household Income For Marion, South Carolina
12.0% of households in Marion earn Less than $10,000.
3.7% of households in Marion earn $10,000 to $14,999.
28.7% of households in Marion earn $15,000 to $24,999.
18.4% of households in Marion earn $25,000 to $34,999.
7.1% of households in Marion earn $35,000 to $49,999.
13.7% of households in Marion earn $50,000 to $74,999.
8.8% of households in Marion earn $75,000 to $99,999.
3.3% of households in Marion earn $100,000 to $149,999.
1.4% of households in Marion earn $150,000 to $199,999.
2.9% of households in Marion earn $200,000 or more.
| Income | Marion | SC | USA |
|---|---|---|---|
| Less than $10,000 | 12.0% | 5.9% | 4.9% |
| $10,000 to $14,999 | 3.7% | 4.0% | 3.6% |
| $15,000 to $24,999 | 28.7% | 7.8% | 6.6% |
| $25,000 to $34,999 | 18.4% | 8.0% | 6.8% |
| $35,000 to $49,999 | 7.1% | 12.3% | 10.4% |
| $50,000 to $74,999 | 13.7% | 17.2% | 15.7% |
| $75,000 to $99,999 | 8.8% | 12.9% | 12.7% |
| $100,000 to $149,999 | 3.3% | 16.1% | 17.4% |
| $150,000 to $199,999 | 1.4% | 7.5% | 9.3% |
| $200,000 or more | 2.9% | 8.3% | 12.6% |


