North Myrtle Beach, SC
Demographics And Statistics
Living In North Myrtle Beach, South Carolina Summary
Life in North Myrtle Beach research summary. HomeSnacks has been using Saturday Night Science to research the quality of life in North Myrtle Beach over the past nine years using Census, FBI, Zillow, and other primary data sources. Based on the most recently available data, we found the following about life in North Myrtle Beach:
The population in North Myrtle Beach is 19,343.
The median home value in North Myrtle Beach is $388,462.
The median income in North Myrtle Beach is $72,111.
The cost of living in North Myrtle Beach is 110 which is 1.1x higher than the national average.
The median rent in North Myrtle Beach is $1,171.
The unemployment rate in North Myrtle Beach is 6.9%.
The poverty rate in North Myrtle Beach is 6.1%.
The average high in North Myrtle Beach is 72.6° and the average low is 54.0°.
North Myrtle Beach SnackAbility
Overall SnackAbility
North Myrtle Beach, SC Crime Report
Crime in North Myrtle Beach summary. We use data from the FBI to determine the crime rates in North Myrtle Beach. Key points include:
There were 745 total crimes in North Myrtle Beach in the last reporting year.
The overall crime rate per 100,000 people in North Myrtle Beach is 3,583.5 / 100k people.
The violent crime rate per 100,000 people in North Myrtle Beach is 360.8 / 100k people.
The property crime rate per 100,000 people in North Myrtle Beach is 3,222.7 / 100k people.
Overall, crime in North Myrtle Beach is 69.09% above the national average.
Total Crimes
Above National Average
Crime In North Myrtle Beach Comparison Table
| Statistic | Count Raw |
North Myrtle Beach / 100k People |
South Carolina / 100k People |
National / 100k People |
|---|---|---|---|---|
| Total Crimes Per 100K | 745 | 3,583.5 | 2,402.5 | 2,119.2 |
| Violent Crime | 75 | 360.8 | 436.7 | 359.0 |
| Murder | 0 | 0.0 | 7.5 | 5.0 |
| Robbery | 3 | 14.4 | 35.1 | 61.0 |
| Aggravated Assault | 60 | 288.6 | 357.1 | 256.0 |
| Property Crime | 670 | 3,222.7 | 1,965.8 | 1,760.0 |
| Burglary | 45 | 216.5 | 282.4 | 229.0 |
| Larceny | 576 | 2,770.6 | 1,468.2 | 1,272.0 |
| Car Theft | 49 | 235.7 | 215.1 | 259.0 |
North Myrtle Beach, SC Cost Of Living
Cost of living in North Myrtle Beach summary. We use data on the cost of living to determine how expensive it is to live in North Myrtle Beach. Real estate prices drive most of the variance in cost of living around South Carolina. Key points include:
The cost of living in North Myrtle Beach is 110 with 100 being average.
The cost of living in North Myrtle Beach is 1.1x higher than the national average.
The median home value in North Myrtle Beach is $388,462.
The median income in North Myrtle Beach is $72,111.
North Myrtle Beach's Overall Cost Of Living
Higher Than The National Average
Cost Of Living In North Myrtle Beach Comparison Table
| Living Expense | North Myrtle Beach | South Carolina | National Average | |
|---|---|---|---|---|
| Overall | 110 | 93 | 100 | |
| Services | 97 | 102 | 100 | |
| Groceries | 100 | 97 | 100 | |
| Health | 89 | 92 | 100 | |
| Housing | 137 | 81 | 100 | |
| Transportation | 87 | 92 | 100 | |
| Utilities | 121 | 109 | 100 | |
North Myrtle Beach, SC Weather
The average high in North Myrtle Beach is 72.6° and the average low is 54.0°.
There are 62.3 days of precipitation each year.
Expect an average of 48.6 inches of precipitation each year with 1.2 inches of snow.
| Stat | North Myrtle Beach |
|---|---|
| Average Annual High | 72.6 |
| Average Annual Low | 54.0 |
| Annual Precipitation Days | 62.3 |
| Average Annual Precipitation | 48.6 |
| Average Annual Snowfall | 1.2 |
Average High
Days of Rain
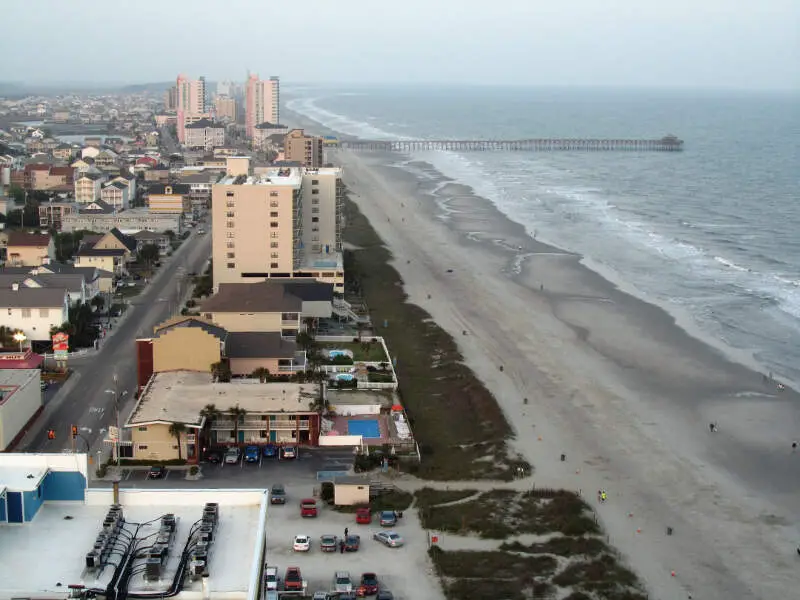
North Myrtle Beach, SC Photos
Rankings for North Myrtle Beach in South Carolina


Locations Around North Myrtle Beach
Map Of North Myrtle Beach, SC
Best Places Around North Myrtle Beach
Red Hill, SC
Population 16,480
Little River, SC
Population 10,457
Socastee, SC
Population 24,629
Conway, SC
Population 26,082
Myrtle Beach, SC
Population 37,214
North Myrtle Beach Demographics And Statistics
Population over time in North Myrtle Beach
The current population in North Myrtle Beach is 19,343. The population has increased 44.4% from 2010.
| Year | Population | % Change |
|---|---|---|
| 2023 | 19,343 | 2.6% |
| 2022 | 18,850 | 1.9% |
| 2021 | 18,502 | 10.9% |
| 2020 | 16,684 | 3.0% |
| 2019 | 16,200 | 2.1% |
| 2018 | 15,862 | 2.3% |
| 2017 | 15,510 | 2.0% |
| 2016 | 15,201 | 2.5% |
| 2015 | 14,824 | 2.3% |
| 2014 | 14,485 | 2.0% |
| 2013 | 14,196 | 1.9% |
| 2012 | 13,926 | 1.9% |
| 2011 | 13,670 | 2.0% |
| 2010 | 13,397 | - |
Race / Ethnicity in North Myrtle Beach
North Myrtle Beach is:
88.1% White with 17,047 White residents.
1.6% African American with 300 African American residents.
0.4% American Indian with 70 American Indian residents.
1.9% Asian with 367 Asian residents.
0.1% Hawaiian with 27 Hawaiian residents.
0.0% Other with 1 Other residents.
2.2% Two Or More with 420 Two Or More residents.
5.7% Hispanic with 1,111 Hispanic residents.
| Race | North Myrtle Beach | SC | USA |
|---|---|---|---|
| White | 88.1% | 62.2% | 58.2% |
| African American | 1.6% | 25.1% | 12.0% |
| American Indian | 0.4% | 0.2% | 0.5% |
| Asian | 1.9% | 1.7% | 5.7% |
| Hawaiian | 0.1% | 0.1% | 0.2% |
| Other | 0.0% | 0.4% | 0.5% |
| Two Or More | 2.2% | 3.2% | 3.9% |
| Hispanic | 5.7% | 7.1% | 19.0% |
Gender in North Myrtle Beach
North Myrtle Beach is 50.3% female with 9,736 female residents.
North Myrtle Beach is 49.7% male with 9,606 male residents.
| Gender | North Myrtle Beach | SC | USA |
|---|---|---|---|
| Female | 50.3% | 51.3% | 50.5% |
| Male | 49.7% | 48.7% | 49.5% |
Highest level of educational attainment in North Myrtle Beach for adults over 25
2.0% of adults in North Myrtle Beach completed < 9th grade.
5.0% of adults in North Myrtle Beach completed 9-12th grade.
24.0% of adults in North Myrtle Beach completed high school / ged.
21.0% of adults in North Myrtle Beach completed some college.
9.0% of adults in North Myrtle Beach completed associate's degree.
25.0% of adults in North Myrtle Beach completed bachelor's degree.
10.0% of adults in North Myrtle Beach completed master's degree.
2.0% of adults in North Myrtle Beach completed professional degree.
2.0% of adults in North Myrtle Beach completed doctorate degree.
| Education | North Myrtle Beach | SC | USA |
|---|---|---|---|
| < 9th Grade | 2.0% | 4.0% | 5.0% |
| 9-12th Grade | 5.0% | 7.0% | 6.0% |
| High School / GED | 24.0% | 28.0% | 26.0% |
| Some College | 21.0% | 20.0% | 19.0% |
| Associate's Degree | 9.0% | 10.0% | 9.0% |
| Bachelor's Degree | 25.0% | 19.0% | 21.0% |
| Master's Degree | 10.0% | 9.0% | 10.0% |
| Professional Degree | 2.0% | 2.0% | 2.0% |
| Doctorate Degree | 2.0% | 1.0% | 2.0% |
Household Income For North Myrtle Beach, South Carolina
2.5% of households in North Myrtle Beach earn Less than $10,000.
2.2% of households in North Myrtle Beach earn $10,000 to $14,999.
6.4% of households in North Myrtle Beach earn $15,000 to $24,999.
11.1% of households in North Myrtle Beach earn $25,000 to $34,999.
11.3% of households in North Myrtle Beach earn $35,000 to $49,999.
18.5% of households in North Myrtle Beach earn $50,000 to $74,999.
9.6% of households in North Myrtle Beach earn $75,000 to $99,999.
17.3% of households in North Myrtle Beach earn $100,000 to $149,999.
9.0% of households in North Myrtle Beach earn $150,000 to $199,999.
12.1% of households in North Myrtle Beach earn $200,000 or more.
| Income | North Myrtle Beach | SC | USA |
|---|---|---|---|
| Less than $10,000 | 2.5% | 5.9% | 4.9% |
| $10,000 to $14,999 | 2.2% | 4.0% | 3.6% |
| $15,000 to $24,999 | 6.4% | 7.8% | 6.6% |
| $25,000 to $34,999 | 11.1% | 8.0% | 6.8% |
| $35,000 to $49,999 | 11.3% | 12.3% | 10.4% |
| $50,000 to $74,999 | 18.5% | 17.2% | 15.7% |
| $75,000 to $99,999 | 9.6% | 12.9% | 12.7% |
| $100,000 to $149,999 | 17.3% | 16.1% | 17.4% |
| $150,000 to $199,999 | 9.0% | 7.5% | 9.3% |
| $200,000 or more | 12.1% | 8.3% | 12.6% |


