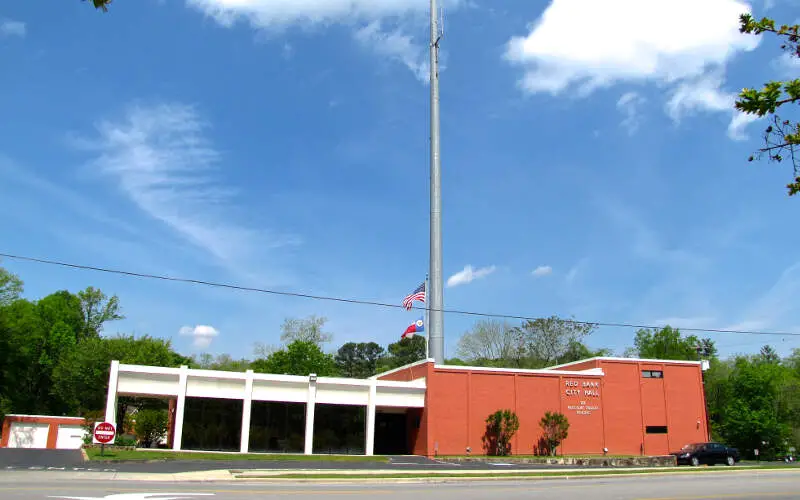
Red Bank, TN
Demographics And Statistics
Living In Red Bank, Tennessee Summary
Life in Red Bank research summary. HomeSnacks has been using Saturday Night Science to research the quality of life in Red Bank over the past nine years using Census, FBI, Zillow, and other primary data sources. Based on the most recently available data, we found the following about life in Red Bank:
The population in Red Bank is 11,960.
The median home value in Red Bank is $310,744.
The median income in Red Bank is $61,788.
The cost of living in Red Bank is 88 which is 0.9x lower than the national average.
The median rent in Red Bank is $1,118.
The unemployment rate in Red Bank is 3.6%.
The poverty rate in Red Bank is 12.9%.
The average high in Red Bank is 70.5° and the average low is 48.5°.
Red Bank SnackAbility
Overall SnackAbility
Red Bank, TN Crime Report
Crime in Red Bank summary. We use data from the FBI to determine the crime rates in Red Bank. Key points include:
There were 190 total crimes in Red Bank in the last reporting year.
The overall crime rate per 100,000 people in Red Bank is 1,568.6 / 100k people.
The violent crime rate per 100,000 people in Red Bank is 396.3 / 100k people.
The property crime rate per 100,000 people in Red Bank is 1,172.3 / 100k people.
Overall, crime in Red Bank is -25.98% below the national average.
Total Crimes
Below National Average
Crime In Red Bank Comparison Table
| Statistic | Count Raw |
Red Bank / 100k People |
Tennessee / 100k People |
National / 100k People |
|---|---|---|---|---|
| Total Crimes Per 100K | 190 | 1,568.6 | 2,624.4 | 2,119.2 |
| Violent Crime | 48 | 396.3 | 592.3 | 359.0 |
| Murder | 0 | 0.0 | 7.9 | 5.0 |
| Robbery | 1 | 8.3 | 58.4 | 61.0 |
| Aggravated Assault | 47 | 388.0 | 488.6 | 256.0 |
| Property Crime | 142 | 1,172.3 | 2,032.1 | 1,760.0 |
| Burglary | 17 | 140.3 | 251.8 | 229.0 |
| Larceny | 102 | 842.1 | 1,443.6 | 1,272.0 |
| Car Theft | 23 | 189.9 | 336.7 | 259.0 |
Red Bank, TN Cost Of Living
Cost of living in Red Bank summary. We use data on the cost of living to determine how expensive it is to live in Red Bank. Real estate prices drive most of the variance in cost of living around Tennessee. Key points include:
The cost of living in Red Bank is 88 with 100 being average.
The cost of living in Red Bank is 0.9x lower than the national average.
The median home value in Red Bank is $310,744.
The median income in Red Bank is $61,788.
Red Bank's Overall Cost Of Living
Lower Than The National Average
Cost Of Living In Red Bank Comparison Table
| Living Expense | Red Bank | Tennessee | National Average | |
|---|---|---|---|---|
| Overall | 88 | 90 | 100 | |
| Services | 91 | 93 | 100 | |
| Groceries | 98 | 99 | 100 | |
| Health | 94 | 87 | 100 | |
| Housing | 84 | 81 | 100 | |
| Transportation | 89 | 89 | 100 | |
| Utilities | 94 | 95 | 100 | |
Red Bank, TN Weather
The average high in Red Bank is 70.5° and the average low is 48.5°.
There are 81.7 days of precipitation each year.
Expect an average of 53.8 inches of precipitation each year with 2.1 inches of snow.
| Stat | Red Bank |
|---|---|
| Average Annual High | 70.5 |
| Average Annual Low | 48.5 |
| Annual Precipitation Days | 81.7 |
| Average Annual Precipitation | 53.8 |
| Average Annual Snowfall | 2.1 |
Average High
Days of Rain
Red Bank, TN Photos
Rankings for Red Bank in Tennessee


Locations Around Red Bank
Map Of Red Bank, TN
Best Places Around Red Bank
Signal Mountain, TN
Population 8,861
Middle Valley, TN
Population 11,808
Harrison, TN
Population 8,446
Collegedale, TN
Population 11,185
Fort Oglethorpe, GA
Population 10,332
Fairview, GA
Population 5,620
Soddy-Daisy, TN
Population 13,117
East Ridge, TN
Population 22,034
Chattanooga, TN
Population 182,832
Red Bank Demographics And Statistics
Population over time in Red Bank
The current population in Red Bank is 11,960. The population has increased 2.6% from 2010.
| Year | Population | % Change |
|---|---|---|
| 2023 | 11,960 | 0.3% |
| 2022 | 11,919 | 0.5% |
| 2021 | 11,855 | 0.6% |
| 2020 | 11,785 | 0.3% |
| 2019 | 11,745 | -0.0% |
| 2018 | 11,748 | 0.0% |
| 2017 | 11,744 | -0.4% |
| 2016 | 11,794 | 0.0% |
| 2015 | 11,793 | 0.3% |
| 2014 | 11,759 | 0.3% |
| 2013 | 11,729 | 0.1% |
| 2012 | 11,723 | 0.4% |
| 2011 | 11,682 | 0.2% |
| 2010 | 11,661 | - |
Race / Ethnicity in Red Bank
Red Bank is:
80.9% White with 9,671 White residents.
6.9% African American with 831 African American residents.
0.2% American Indian with 25 American Indian residents.
1.3% Asian with 151 Asian residents.
0.0% Hawaiian with 0 Hawaiian residents.
0.0% Other with 0 Other residents.
6.2% Two Or More with 742 Two Or More residents.
4.5% Hispanic with 540 Hispanic residents.
| Race | Red Bank | TN | USA |
|---|---|---|---|
| White | 80.9% | 71.5% | 58.2% |
| African American | 6.9% | 15.7% | 12.0% |
| American Indian | 0.2% | 0.1% | 0.5% |
| Asian | 1.3% | 1.8% | 5.7% |
| Hawaiian | 0.0% | 0.1% | 0.2% |
| Other | 0.0% | 0.4% | 0.5% |
| Two Or More | 6.2% | 3.3% | 3.9% |
| Hispanic | 4.5% | 7.1% | 19.0% |
Gender in Red Bank
Red Bank is 53.8% female with 6,437 female residents.
Red Bank is 46.2% male with 5,523 male residents.
| Gender | Red Bank | TN | USA |
|---|---|---|---|
| Female | 53.8% | 50.9% | 50.5% |
| Male | 46.2% | 49.1% | 49.5% |
Highest level of educational attainment in Red Bank for adults over 25
5.0% of adults in Red Bank completed < 9th grade.
2.0% of adults in Red Bank completed 9-12th grade.
19.0% of adults in Red Bank completed high school / ged.
23.0% of adults in Red Bank completed some college.
8.0% of adults in Red Bank completed associate's degree.
28.0% of adults in Red Bank completed bachelor's degree.
12.0% of adults in Red Bank completed master's degree.
2.0% of adults in Red Bank completed professional degree.
1.0% of adults in Red Bank completed doctorate degree.
| Education | Red Bank | TN | USA |
|---|---|---|---|
| < 9th Grade | 5.0% | 4.0% | 5.0% |
| 9-12th Grade | 2.0% | 7.0% | 6.0% |
| High School / GED | 19.0% | 31.0% | 26.0% |
| Some College | 23.0% | 20.0% | 19.0% |
| Associate's Degree | 8.0% | 8.0% | 9.0% |
| Bachelor's Degree | 28.0% | 19.0% | 21.0% |
| Master's Degree | 12.0% | 8.0% | 10.0% |
| Professional Degree | 2.0% | 2.0% | 2.0% |
| Doctorate Degree | 1.0% | 1.0% | 2.0% |
Household Income For Red Bank, Tennessee
4.3% of households in Red Bank earn Less than $10,000.
3.7% of households in Red Bank earn $10,000 to $14,999.
10.4% of households in Red Bank earn $15,000 to $24,999.
11.6% of households in Red Bank earn $25,000 to $34,999.
10.9% of households in Red Bank earn $35,000 to $49,999.
19.2% of households in Red Bank earn $50,000 to $74,999.
13.0% of households in Red Bank earn $75,000 to $99,999.
15.9% of households in Red Bank earn $100,000 to $149,999.
5.8% of households in Red Bank earn $150,000 to $199,999.
5.2% of households in Red Bank earn $200,000 or more.
| Income | Red Bank | TN | USA |
|---|---|---|---|
| Less than $10,000 | 4.3% | 5.2% | 4.9% |
| $10,000 to $14,999 | 3.7% | 4.2% | 3.6% |
| $15,000 to $24,999 | 10.4% | 7.8% | 6.6% |
| $25,000 to $34,999 | 11.6% | 7.9% | 6.8% |
| $35,000 to $49,999 | 10.9% | 12.4% | 10.4% |
| $50,000 to $74,999 | 19.2% | 17.4% | 15.7% |
| $75,000 to $99,999 | 13.0% | 13.2% | 12.7% |
| $100,000 to $149,999 | 15.9% | 16.4% | 17.4% |
| $150,000 to $199,999 | 5.8% | 7.1% | 9.3% |
| $200,000 or more | 5.2% | 8.3% | 12.6% |


