Lancaster, TX
Demographics And Statistics
Living In Lancaster, Texas Summary
Life in Lancaster research summary. HomeSnacks has been using Saturday Night Science to research the quality of life in Lancaster over the past nine years using Census, FBI, Zillow, and other primary data sources. Based on the most recently available data, we found the following about life in Lancaster:
The population in Lancaster is 40,753.
The median home value in Lancaster is $270,403.
The median income in Lancaster is $67,584.
The cost of living in Lancaster is 102 which is 1.0x higher than the national average.
The median rent in Lancaster is $1,627.
The unemployment rate in Lancaster is 6.8%.
The poverty rate in Lancaster is 14.4%.
The average high in Lancaster is 76.3° and the average low is 55.0°.
Lancaster SnackAbility
Overall SnackAbility
Lancaster, TX Crime Report
Crime in Lancaster summary. We use data from the FBI to determine the crime rates in Lancaster. Key points include:
There were 1,432 total crimes in Lancaster in the last reporting year.
The overall crime rate per 100,000 people in Lancaster is 3,537.0 / 100k people.
The violent crime rate per 100,000 people in Lancaster is 410.0 / 100k people.
The property crime rate per 100,000 people in Lancaster is 3,127.0 / 100k people.
Overall, crime in Lancaster is 66.90% above the national average.
Total Crimes
Above National Average
Crime In Lancaster Comparison Table
| Statistic | Count Raw |
Lancaster / 100k People |
Texas / 100k People |
National / 100k People |
|---|---|---|---|---|
| Total Crimes Per 100K | 1,432 | 3,537.0 | 2,429.9 | 2,119.2 |
| Violent Crime | 166 | 410.0 | 389.4 | 359.0 |
| Murder | 6 | 14.8 | 5.2 | 5.0 |
| Robbery | 28 | 69.2 | 63.5 | 61.0 |
| Aggravated Assault | 116 | 286.5 | 270.7 | 256.0 |
| Property Crime | 1,266 | 3,127.0 | 2,040.5 | 1,760.0 |
| Burglary | 353 | 871.9 | 284.3 | 229.0 |
| Larceny | 697 | 1,721.6 | 1,425.6 | 1,272.0 |
| Car Theft | 216 | 533.5 | 330.7 | 259.0 |
Lancaster, TX Cost Of Living
Cost of living in Lancaster summary. We use data on the cost of living to determine how expensive it is to live in Lancaster. Real estate prices drive most of the variance in cost of living around Texas. Key points include:
The cost of living in Lancaster is 102 with 100 being average.
The cost of living in Lancaster is 1.0x higher than the national average.
The median home value in Lancaster is $270,403.
The median income in Lancaster is $67,584.
Lancaster's Overall Cost Of Living
Higher Than The National Average
Cost Of Living In Lancaster Comparison Table
| Living Expense | Lancaster | Texas | National Average | |
|---|---|---|---|---|
| Overall | 102 | 92 | 100 | |
| Services | 106 | 97 | 100 | |
| Groceries | 100 | 97 | 100 | |
| Health | 108 | 93 | 100 | |
| Housing | 94 | 82 | 100 | |
| Transportation | 90 | 94 | 100 | |
| Utilities | 109 | 104 | 100 | |
Lancaster, TX Weather
The average high in Lancaster is 76.3° and the average low is 55.0°.
There are 58.4 days of precipitation each year.
Expect an average of 38.6 inches of precipitation each year with 0.8 inches of snow.
| Stat | Lancaster |
|---|---|
| Average Annual High | 76.3 |
| Average Annual Low | 55.0 |
| Annual Precipitation Days | 58.4 |
| Average Annual Precipitation | 38.6 |
| Average Annual Snowfall | 0.8 |
Average High
Days of Rain
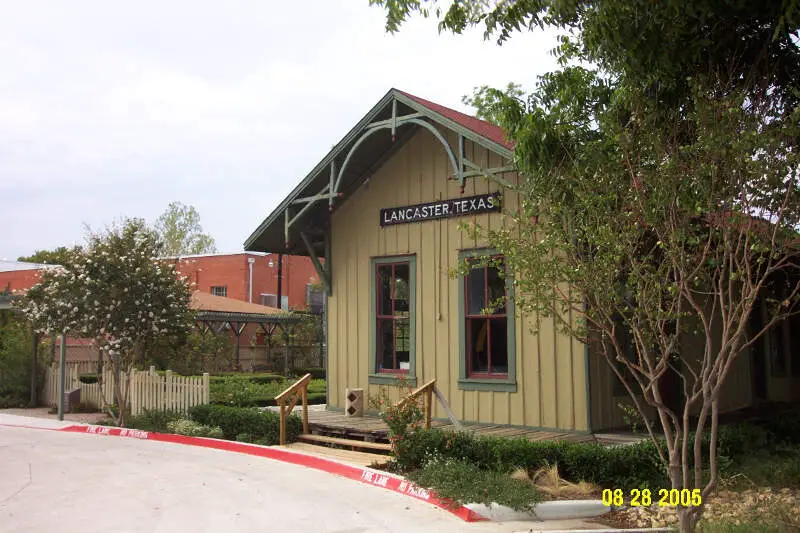
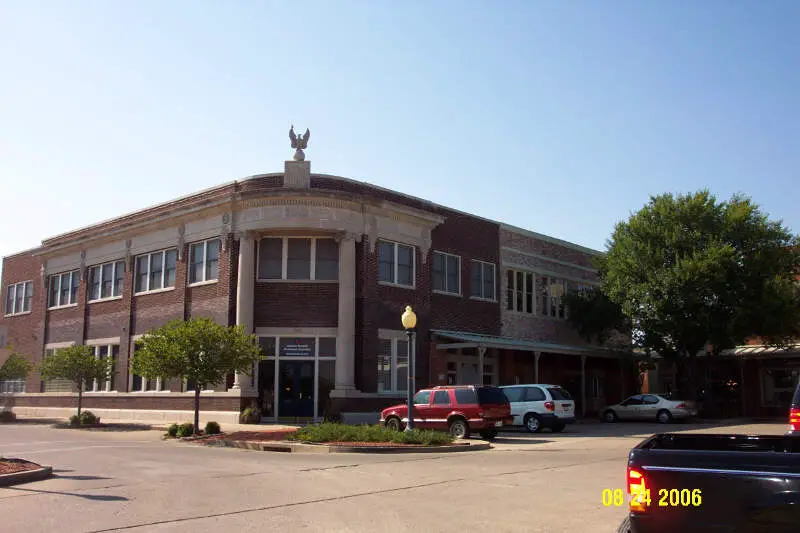
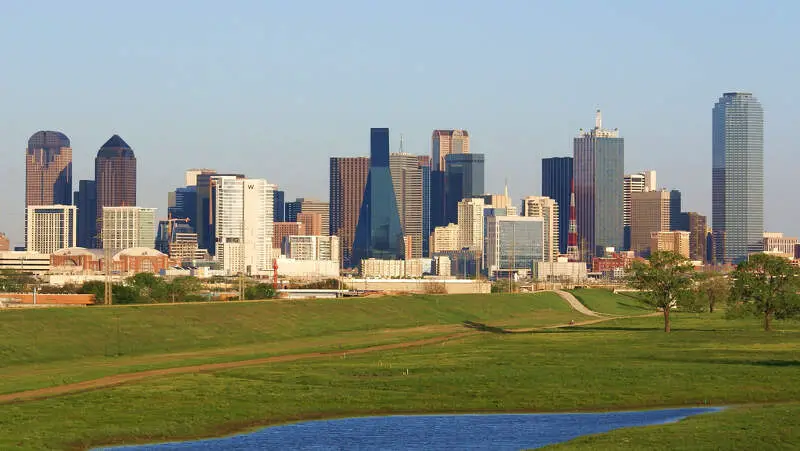
Lancaster, TX Photos
Rankings for Lancaster in Texas


Locations Around Lancaster
Map Of Lancaster, TX
Best Places Around Lancaster
University Park, TX
Population 25,104
Duncanville, TX
Population 39,879
Waxahachie, TX
Population 43,591
Grand Prairie, TX
Population 198,564
Red Oak, TX
Population 15,909
Midlothian, TX
Population 37,256
DeSoto, TX
Population 55,896
Cedar Hill, TX
Population 48,547
Seagoville, TX
Population 18,968
Dallas, TX
Population 1,299,553
Lancaster Demographics And Statistics
Population over time in Lancaster
The current population in Lancaster is 40,753. The population has increased 19.2% from 2010.
| Year | Population | % Change |
|---|---|---|
| 2023 | 40,753 | -0.5% |
| 2022 | 40,958 | -0.2% |
| 2021 | 41,057 | 4.6% |
| 2020 | 39,264 | 0.1% |
| 2019 | 39,214 | 0.1% |
| 2018 | 39,162 | 0.7% |
| 2017 | 38,871 | 1.2% |
| 2016 | 38,426 | 0.7% |
| 2015 | 38,152 | 1.1% |
| 2014 | 37,731 | 1.7% |
| 2013 | 37,087 | 2.2% |
| 2012 | 36,271 | 3.1% |
| 2011 | 35,187 | 2.9% |
| 2010 | 34,186 | - |
Race / Ethnicity in Lancaster
Lancaster is:
9.6% White with 3,897 White residents.
63.9% African American with 26,029 African American residents.
0.0% American Indian with 0 American Indian residents.
0.7% Asian with 291 Asian residents.
0.0% Hawaiian with 0 Hawaiian residents.
0.2% Other with 74 Other residents.
2.0% Two Or More with 835 Two Or More residents.
23.6% Hispanic with 9,627 Hispanic residents.
| Race | Lancaster | TX | USA |
|---|---|---|---|
| White | 9.6% | 39.9% | 58.2% |
| African American | 63.9% | 11.9% | 12.0% |
| American Indian | 0.0% | 0.2% | 0.5% |
| Asian | 0.7% | 5.3% | 5.7% |
| Hawaiian | 0.0% | 0.1% | 0.2% |
| Other | 0.2% | 0.4% | 0.5% |
| Two Or More | 2.0% | 2.9% | 3.9% |
| Hispanic | 23.6% | 39.5% | 19.0% |
Gender in Lancaster
Lancaster is 54.2% female with 22,089 female residents.
Lancaster is 45.8% male with 18,664 male residents.
| Gender | Lancaster | TX | USA |
|---|---|---|---|
| Female | 54.2% | 50.1% | 50.5% |
| Male | 45.8% | 49.9% | 49.5% |
Highest level of educational attainment in Lancaster for adults over 25
5.0% of adults in Lancaster completed < 9th grade.
8.0% of adults in Lancaster completed 9-12th grade.
28.0% of adults in Lancaster completed high school / ged.
24.0% of adults in Lancaster completed some college.
9.0% of adults in Lancaster completed associate's degree.
16.0% of adults in Lancaster completed bachelor's degree.
8.0% of adults in Lancaster completed master's degree.
1.0% of adults in Lancaster completed professional degree.
1.0% of adults in Lancaster completed doctorate degree.
| Education | Lancaster | TX | USA |
|---|---|---|---|
| < 9th Grade | 5.0% | 7.0% | 5.0% |
| 9-12th Grade | 8.0% | 7.0% | 6.0% |
| High School / GED | 28.0% | 24.0% | 26.0% |
| Some College | 24.0% | 21.0% | 19.0% |
| Associate's Degree | 9.0% | 8.0% | 9.0% |
| Bachelor's Degree | 16.0% | 21.0% | 21.0% |
| Master's Degree | 8.0% | 9.0% | 10.0% |
| Professional Degree | 1.0% | 2.0% | 2.0% |
| Doctorate Degree | 1.0% | 1.0% | 2.0% |
Household Income For Lancaster, Texas
6.2% of households in Lancaster earn Less than $10,000.
2.6% of households in Lancaster earn $10,000 to $14,999.
6.2% of households in Lancaster earn $15,000 to $24,999.
6.7% of households in Lancaster earn $25,000 to $34,999.
12.4% of households in Lancaster earn $35,000 to $49,999.
23.3% of households in Lancaster earn $50,000 to $74,999.
13.0% of households in Lancaster earn $75,000 to $99,999.
17.7% of households in Lancaster earn $100,000 to $149,999.
6.2% of households in Lancaster earn $150,000 to $199,999.
5.7% of households in Lancaster earn $200,000 or more.
| Income | Lancaster | TX | USA |
|---|---|---|---|
| Less than $10,000 | 6.2% | 5.0% | 4.9% |
| $10,000 to $14,999 | 2.6% | 3.4% | 3.6% |
| $15,000 to $24,999 | 6.2% | 6.5% | 6.6% |
| $25,000 to $34,999 | 6.7% | 7.0% | 6.8% |
| $35,000 to $49,999 | 12.4% | 10.9% | 10.4% |
| $50,000 to $74,999 | 23.3% | 16.4% | 15.7% |
| $75,000 to $99,999 | 13.0% | 12.8% | 12.7% |
| $100,000 to $149,999 | 17.7% | 17.2% | 17.4% |
| $150,000 to $199,999 | 6.2% | 9.1% | 9.3% |
| $200,000 or more | 5.7% | 11.7% | 12.6% |


