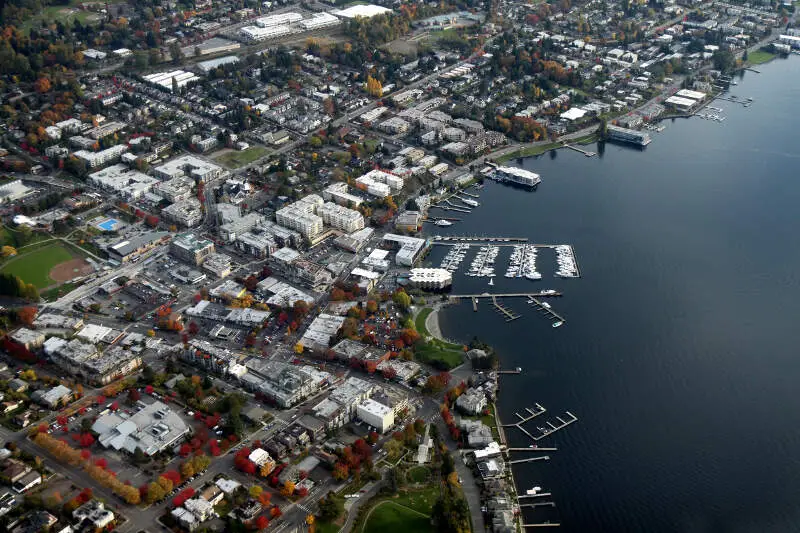
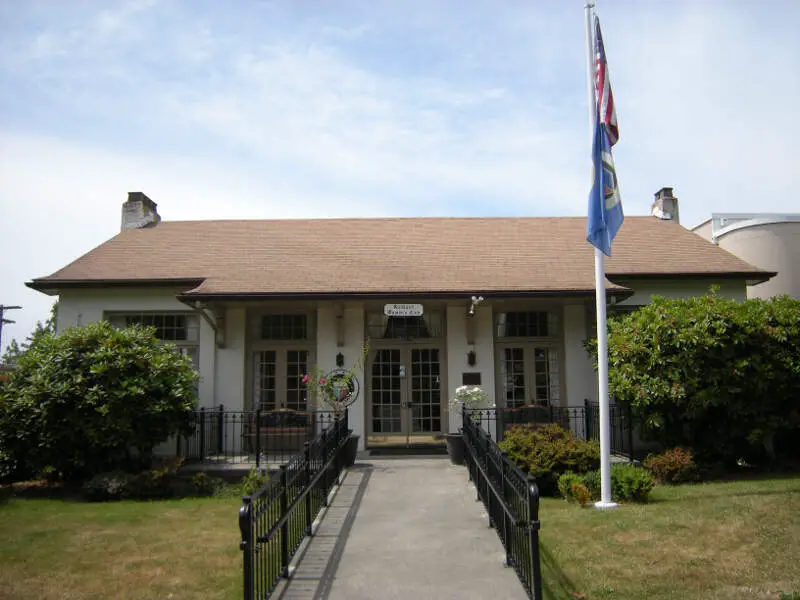
Kirkland, WA
Demographics And Statistics
Living In Kirkland, Washington Summary
Life in Kirkland research summary. HomeSnacks has been using Saturday Night Science to research the quality of life in Kirkland over the past nine years using Census, FBI, Zillow, and other primary data sources. Based on the most recently available data, we found the following about life in Kirkland:
The population in Kirkland is 91,614.
The median home value in Kirkland is $1,235,034.
The median income in Kirkland is $143,533.
The cost of living in Kirkland is 184 which is 1.8x higher than the national average.
The median rent in Kirkland is $2,342.
The unemployment rate in Kirkland is 4.6%.
The poverty rate in Kirkland is 6.0%.
The average high in Kirkland is 60.2° and the average low is 44.3°.
Kirkland SnackAbility
Overall SnackAbility
Kirkland, WA Crime Report
Crime in Kirkland summary. We use data from the FBI to determine the crime rates in Kirkland. Key points include:
There were 1,880 total crimes in Kirkland in the last reporting year.
The overall crime rate per 100,000 people in Kirkland is 2,073.1 / 100k people.
The violent crime rate per 100,000 people in Kirkland is 60.6 / 100k people.
The property crime rate per 100,000 people in Kirkland is 2,012.4 / 100k people.
Overall, crime in Kirkland is -2.18% below the national average.
Total Crimes
Below National Average
Crime In Kirkland Comparison Table
| Statistic | Count Raw |
Kirkland / 100k People |
Washington / 100k People |
National / 100k People |
|---|---|---|---|---|
| Total Crimes Per 100K | 1,880 | 2,073.1 | 2,792.6 | 2,119.2 |
| Violent Crime | 55 | 60.6 | 326.1 | 359.0 |
| Murder | 1 | 1.1 | 3.8 | 5.0 |
| Robbery | 9 | 9.9 | 67.5 | 61.0 |
| Aggravated Assault | 32 | 35.3 | 217.0 | 256.0 |
| Property Crime | 1,825 | 2,012.4 | 2,466.5 | 1,760.0 |
| Burglary | 202 | 222.7 | 398.8 | 229.0 |
| Larceny | 1,400 | 1,543.8 | 1,634.2 | 1,272.0 |
| Car Theft | 223 | 245.9 | 433.5 | 259.0 |
Kirkland, WA Cost Of Living
Cost of living in Kirkland summary. We use data on the cost of living to determine how expensive it is to live in Kirkland. Real estate prices drive most of the variance in cost of living around Washington. Key points include:
The cost of living in Kirkland is 184 with 100 being average.
The cost of living in Kirkland is 1.8x higher than the national average.
The median home value in Kirkland is $1,235,034.
The median income in Kirkland is $143,533.
Kirkland's Overall Cost Of Living
Higher Than The National Average
Cost Of Living In Kirkland Comparison Table
| Living Expense | Kirkland | Washington | National Average | |
|---|---|---|---|---|
| Overall | 184 | 118 | 100 | |
| Services | 121 | 111 | 100 | |
| Groceries | 116 | 112 | 100 | |
| Health | 139 | 122 | 100 | |
| Housing | 337 | 135 | 100 | |
| Transportation | 126 | 124 | 100 | |
| Utilities | 100 | 91 | 100 | |
Kirkland, WA Weather
The average high in Kirkland is 60.2° and the average low is 44.3°.
There are 90.6 days of precipitation each year.
Expect an average of 39.1 inches of precipitation each year with 3.9 inches of snow.
| Stat | Kirkland |
|---|---|
| Average Annual High | 60.2 |
| Average Annual Low | 44.3 |
| Annual Precipitation Days | 90.6 |
| Average Annual Precipitation | 39.1 |
| Average Annual Snowfall | 3.9 |
Average High
Days of Rain
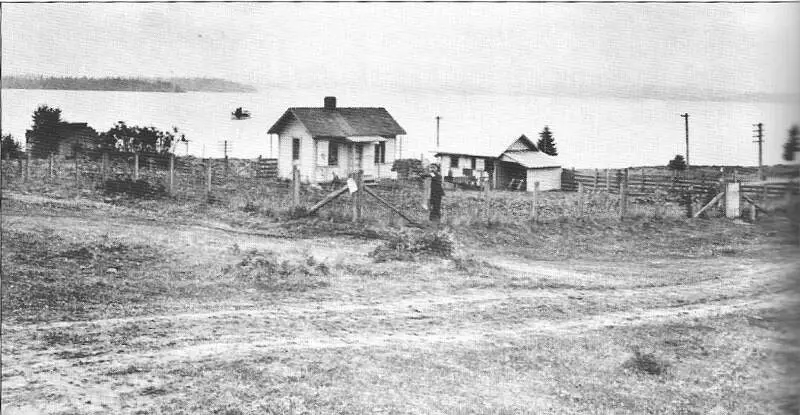
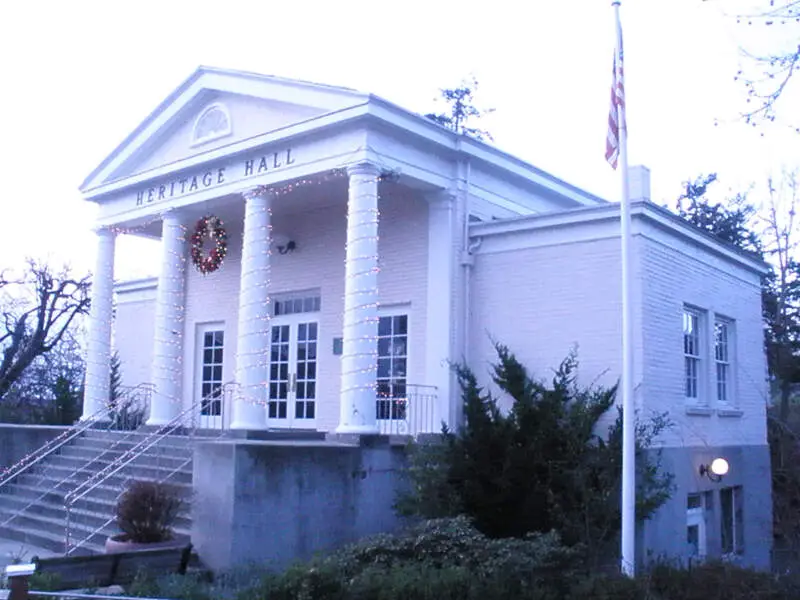
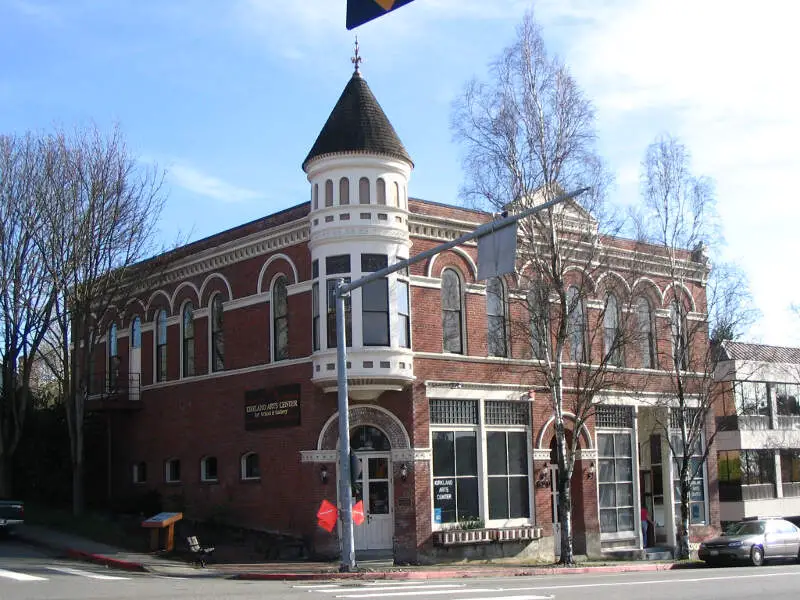
Kirkland, WA Photos

Rankings for Kirkland in Washington


Locations Around Kirkland
Map Of Kirkland, WA
Best Places Around Kirkland
Bainbridge Island, WA
Population 24,607
Snohomish, WA
Population 10,177
SeaTac, WA
Population 31,143
Everett, WA
Population 111,083
Tukwila, WA
Population 21,479
Lake Stickney, WA
Population 15,514
White Center, WA
Population 15,017
Monroe, WA
Population 19,696
Lynnwood, WA
Population 40,953
Bryn Mawr-Skyway, WA
Population 17,577
Kirkland Demographics And Statistics
Population over time in Kirkland
The current population in Kirkland is 91,614. The population has increased 92.2% from 2010.
| Year | Population | % Change |
|---|---|---|
| 2023 | 91,614 | -0.4% |
| 2022 | 92,015 | 0.4% |
| 2021 | 91,656 | 0.6% |
| 2020 | 91,146 | 1.9% |
| 2019 | 89,438 | 1.5% |
| 2018 | 88,079 | 1.5% |
| 2017 | 86,772 | 1.1% |
| 2016 | 85,812 | 1.3% |
| 2015 | 84,721 | 1.7% |
| 2014 | 83,320 | 9.9% |
| 2013 | 75,835 | 54.5% |
| 2012 | 49,090 | 1.6% |
| 2011 | 48,334 | 1.4% |
| 2010 | 47,677 | - |
Race / Ethnicity in Kirkland
Kirkland is:
65.2% White with 59,694 White residents.
1.5% African American with 1,417 African American residents.
0.3% American Indian with 264 American Indian residents.
17.8% Asian with 16,265 Asian residents.
0.1% Hawaiian with 110 Hawaiian residents.
0.9% Other with 834 Other residents.
6.4% Two Or More with 5,904 Two Or More residents.
7.8% Hispanic with 7,126 Hispanic residents.
| Race | Kirkland | WA | USA |
|---|---|---|---|
| White | 65.2% | 64.3% | 58.2% |
| African American | 1.5% | 3.8% | 12.0% |
| American Indian | 0.3% | 0.8% | 0.5% |
| Asian | 17.8% | 9.3% | 5.7% |
| Hawaiian | 0.1% | 0.7% | 0.2% |
| Other | 0.9% | 0.5% | 0.5% |
| Two Or More | 6.4% | 6.5% | 3.9% |
| Hispanic | 7.8% | 14.1% | 19.0% |
Gender in Kirkland
Kirkland is 49.7% female with 45,572 female residents.
Kirkland is 50.3% male with 46,041 male residents.
| Gender | Kirkland | WA | USA |
|---|---|---|---|
| Female | 49.7% | 49.6% | 50.5% |
| Male | 50.3% | 50.4% | 49.5% |
Highest level of educational attainment in Kirkland for adults over 25
1.0% of adults in Kirkland completed < 9th grade.
1.0% of adults in Kirkland completed 9-12th grade.
11.0% of adults in Kirkland completed high school / ged.
15.0% of adults in Kirkland completed some college.
7.0% of adults in Kirkland completed associate's degree.
38.0% of adults in Kirkland completed bachelor's degree.
20.0% of adults in Kirkland completed master's degree.
3.0% of adults in Kirkland completed professional degree.
4.0% of adults in Kirkland completed doctorate degree.
| Education | Kirkland | WA | USA |
|---|---|---|---|
| < 9th Grade | 1.0% | 3.0% | 5.0% |
| 9-12th Grade | 1.0% | 4.0% | 6.0% |
| High School / GED | 11.0% | 22.0% | 26.0% |
| Some College | 15.0% | 22.0% | 19.0% |
| Associate's Degree | 7.0% | 10.0% | 9.0% |
| Bachelor's Degree | 38.0% | 24.0% | 21.0% |
| Master's Degree | 20.0% | 11.0% | 10.0% |
| Professional Degree | 3.0% | 2.0% | 2.0% |
| Doctorate Degree | 4.0% | 2.0% | 2.0% |
Household Income For Kirkland, Washington
2.7% of households in Kirkland earn Less than $10,000.
1.6% of households in Kirkland earn $10,000 to $14,999.
3.0% of households in Kirkland earn $15,000 to $24,999.
3.5% of households in Kirkland earn $25,000 to $34,999.
4.1% of households in Kirkland earn $35,000 to $49,999.
9.7% of households in Kirkland earn $50,000 to $74,999.
9.7% of households in Kirkland earn $75,000 to $99,999.
17.5% of households in Kirkland earn $100,000 to $149,999.
12.8% of households in Kirkland earn $150,000 to $199,999.
35.5% of households in Kirkland earn $200,000 or more.
| Income | Kirkland | WA | USA |
|---|---|---|---|
| Less than $10,000 | 2.7% | 3.8% | 4.9% |
| $10,000 to $14,999 | 1.6% | 2.7% | 3.6% |
| $15,000 to $24,999 | 3.0% | 4.9% | 6.6% |
| $25,000 to $34,999 | 3.5% | 5.3% | 6.8% |
| $35,000 to $49,999 | 4.1% | 8.6% | 10.4% |
| $50,000 to $74,999 | 9.7% | 14.6% | 15.7% |
| $75,000 to $99,999 | 9.7% | 12.6% | 12.7% |
| $100,000 to $149,999 | 17.5% | 19.2% | 17.4% |
| $150,000 to $199,999 | 12.8% | 11.3% | 9.3% |
| $200,000 or more | 35.5% | 17.2% | 12.6% |


