Mercer Island, WA
Demographics And Statistics
Living In Mercer Island, Washington Summary
Life in Mercer Island research summary. HomeSnacks has been using Saturday Night Science to research the quality of life in Mercer Island over the past nine years using Census, FBI, Zillow, and other primary data sources. Based on the most recently available data, we found the following about life in Mercer Island:
The population in Mercer Island is 25,282.
The median home value in Mercer Island is $2,263,983.
The median income in Mercer Island is $202,359.
The cost of living in Mercer Island is 263 which is 2.6x higher than the national average.
The median rent in Mercer Island is $2,464.
The unemployment rate in Mercer Island is 2.5%.
The poverty rate in Mercer Island is 4.6%.
The average high in Mercer Island is 60.2° and the average low is 44.4°.
Mercer Island SnackAbility
Overall SnackAbility
Mercer Island, WA Crime Report
Crime in Mercer Island summary. We use data from the FBI to determine the crime rates in Mercer Island. Key points include:
There were 312 total crimes in Mercer Island in the last reporting year.
The overall crime rate per 100,000 people in Mercer Island is 1,277.9 / 100k people.
The violent crime rate per 100,000 people in Mercer Island is 36.9 / 100k people.
The property crime rate per 100,000 people in Mercer Island is 1,241.0 / 100k people.
Overall, crime in Mercer Island is -39.70% below the national average.
Total Crimes
Below National Average
Crime In Mercer Island Comparison Table
| Statistic | Count Raw |
Mercer Island / 100k People |
Washington / 100k People |
National / 100k People |
|---|---|---|---|---|
| Total Crimes Per 100K | 312 | 1,277.9 | 2,792.6 | 2,119.2 |
| Violent Crime | 9 | 36.9 | 326.1 | 359.0 |
| Murder | 0 | 0.0 | 3.8 | 5.0 |
| Robbery | 4 | 16.4 | 67.5 | 61.0 |
| Aggravated Assault | 4 | 16.4 | 217.0 | 256.0 |
| Property Crime | 303 | 1,241.0 | 2,466.5 | 1,760.0 |
| Burglary | 56 | 229.4 | 398.8 | 229.0 |
| Larceny | 226 | 925.6 | 1,634.2 | 1,272.0 |
| Car Theft | 21 | 86.0 | 433.5 | 259.0 |
Mercer Island, WA Cost Of Living
Cost of living in Mercer Island summary. We use data on the cost of living to determine how expensive it is to live in Mercer Island. Real estate prices drive most of the variance in cost of living around Washington. Key points include:
The cost of living in Mercer Island is 263 with 100 being average.
The cost of living in Mercer Island is 2.6x higher than the national average.
The median home value in Mercer Island is $2,263,983.
The median income in Mercer Island is $202,359.
Mercer Island's Overall Cost Of Living
Higher Than The National Average
Cost Of Living In Mercer Island Comparison Table
| Living Expense | Mercer Island | Washington | National Average | |
|---|---|---|---|---|
| Overall | 263 | 118 | 100 | |
| Services | 121 | 111 | 100 | |
| Groceries | 115 | 112 | 100 | |
| Health | 139 | 122 | 100 | |
| Housing | 595 | 135 | 100 | |
| Transportation | 130 | 124 | 100 | |
| Utilities | 104 | 91 | 100 | |
Mercer Island, WA Weather
The average high in Mercer Island is 60.2° and the average low is 44.4°.
There are 92.0 days of precipitation each year.
Expect an average of 36.9 inches of precipitation each year with 5.0 inches of snow.
| Stat | Mercer Island |
|---|---|
| Average Annual High | 60.2 |
| Average Annual Low | 44.4 |
| Annual Precipitation Days | 92.0 |
| Average Annual Precipitation | 36.9 |
| Average Annual Snowfall | 5.0 |
Average High
Days of Rain
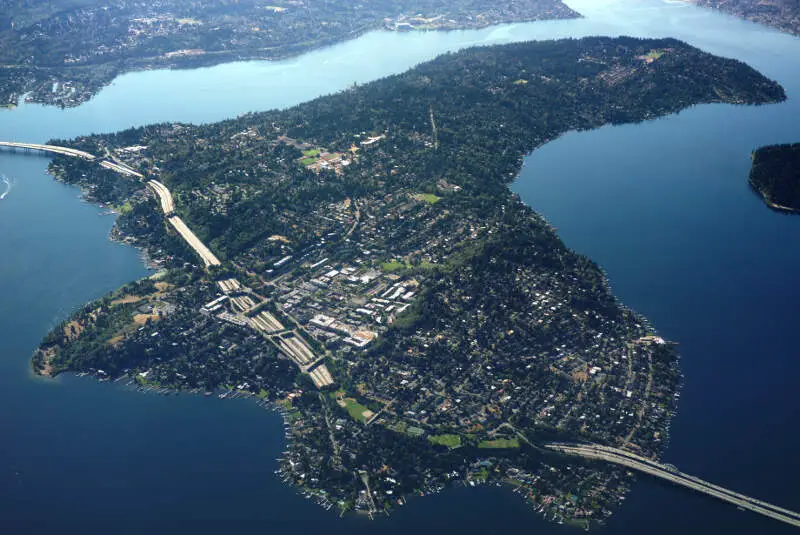
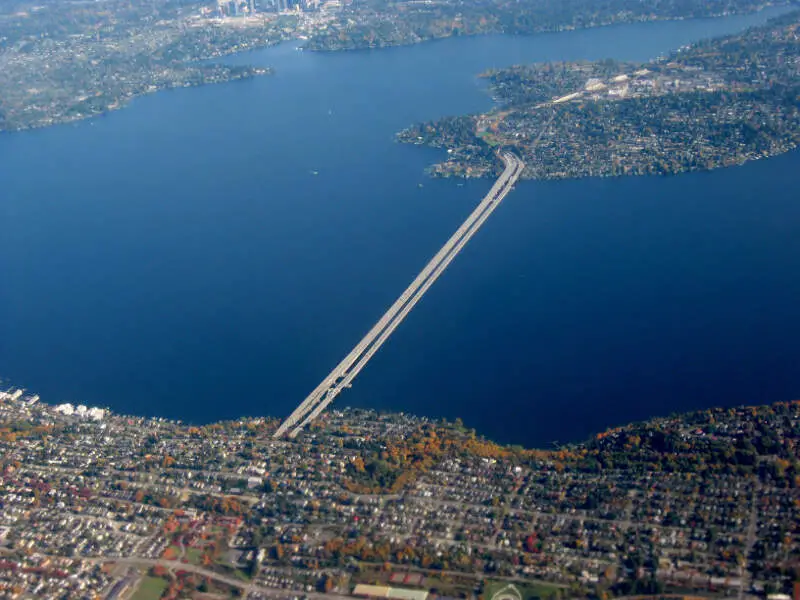
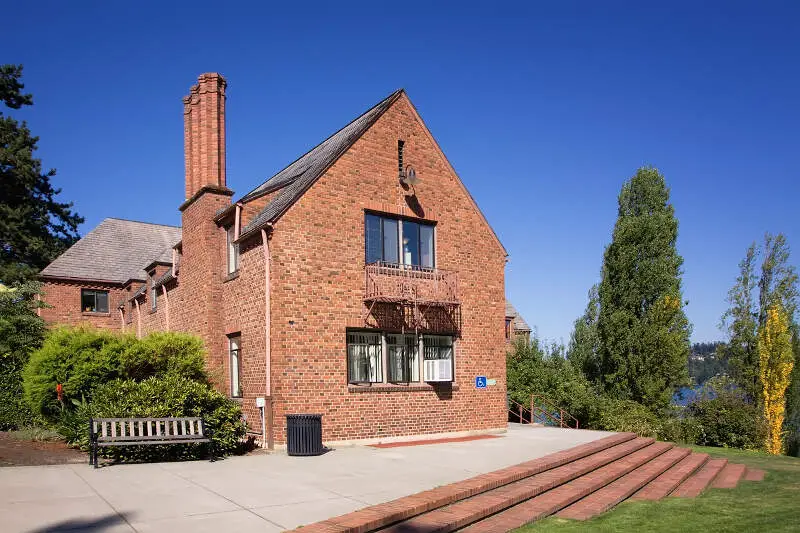
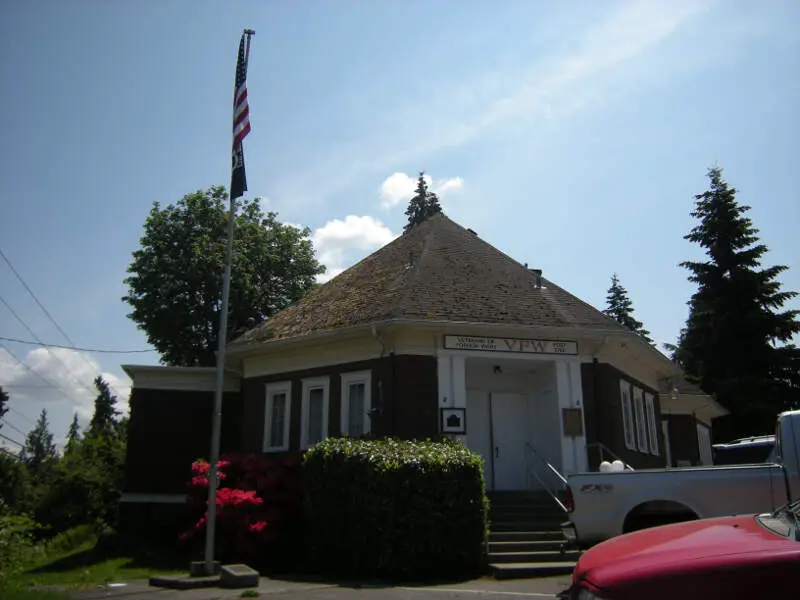
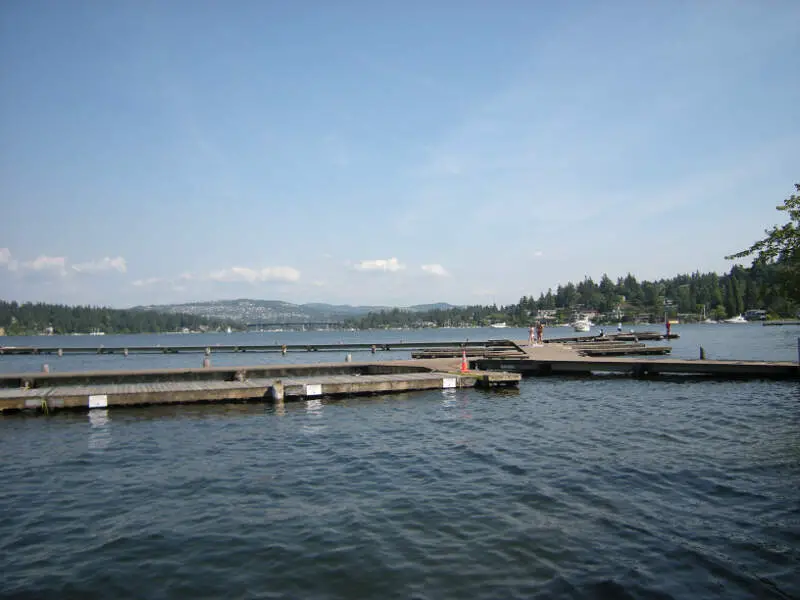
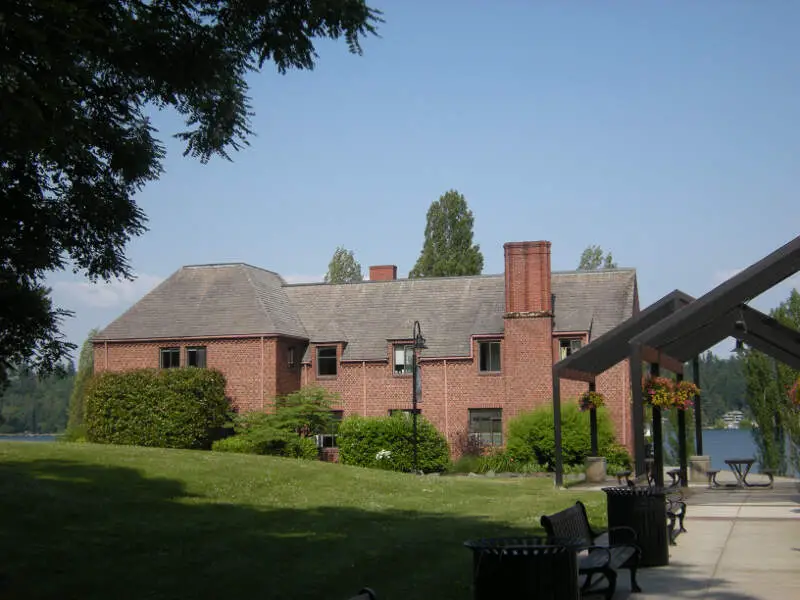
Mercer Island, WA Photos
Rankings for Mercer Island in Washington


Locations Around Mercer Island
Map Of Mercer Island, WA
Best Places Around Mercer Island
Port Orchard, WA
Population 16,398
Bainbridge Island, WA
Population 24,607
Vashon, WA
Population 10,424
SeaTac, WA
Population 31,143
Kent, WA
Population 135,015
Auburn, WA
Population 85,455
Tukwila, WA
Population 21,479
Parkwood, WA
Population 6,976
East Port Orchard, WA
Population 5,581
White Center, WA
Population 15,017
Mercer Island Demographics And Statistics
Population over time in Mercer Island
The current population in Mercer Island is 25,282. The population has increased 13.0% from 2010.
| Year | Population | % Change |
|---|---|---|
| 2023 | 25,282 | -0.7% |
| 2022 | 25,464 | -0.2% |
| 2021 | 25,506 | -1.2% |
| 2020 | 25,820 | 0.6% |
| 2019 | 25,675 | 0.7% |
| 2018 | 25,492 | 2.9% |
| 2017 | 24,768 | 1.2% |
| 2016 | 24,467 | 1.4% |
| 2015 | 24,120 | 2.0% |
| 2014 | 23,636 | 1.4% |
| 2013 | 23,301 | 1.7% |
| 2012 | 22,922 | 1.5% |
| 2011 | 22,592 | 1.0% |
| 2010 | 22,376 | - |
Race / Ethnicity in Mercer Island
Mercer Island is:
65.3% White with 16,503 White residents.
1.4% African American with 345 African American residents.
0.0% American Indian with 7 American Indian residents.
22.2% Asian with 5,609 Asian residents.
0.0% Hawaiian with 0 Hawaiian residents.
0.6% Other with 162 Other residents.
8.2% Two Or More with 2,068 Two Or More residents.
2.3% Hispanic with 588 Hispanic residents.
| Race | Mercer Island | WA | USA |
|---|---|---|---|
| White | 65.3% | 64.3% | 58.2% |
| African American | 1.4% | 3.8% | 12.0% |
| American Indian | 0.0% | 0.8% | 0.5% |
| Asian | 22.2% | 9.3% | 5.7% |
| Hawaiian | 0.0% | 0.7% | 0.2% |
| Other | 0.6% | 0.5% | 0.5% |
| Two Or More | 8.2% | 6.5% | 3.9% |
| Hispanic | 2.3% | 14.1% | 19.0% |
Gender in Mercer Island
Mercer Island is 53.6% female with 13,539 female residents.
Mercer Island is 46.4% male with 11,743 male residents.
| Gender | Mercer Island | WA | USA |
|---|---|---|---|
| Female | 53.6% | 49.6% | 50.5% |
| Male | 46.4% | 50.4% | 49.5% |
Highest level of educational attainment in Mercer Island for adults over 25
3.0% of adults in Mercer Island completed < 9th grade.
0.0% of adults in Mercer Island completed 9-12th grade.
5.0% of adults in Mercer Island completed high school / ged.
8.0% of adults in Mercer Island completed some college.
6.0% of adults in Mercer Island completed associate's degree.
38.0% of adults in Mercer Island completed bachelor's degree.
22.0% of adults in Mercer Island completed master's degree.
11.0% of adults in Mercer Island completed professional degree.
7.0% of adults in Mercer Island completed doctorate degree.
| Education | Mercer Island | WA | USA |
|---|---|---|---|
| < 9th Grade | 3.0% | 3.0% | 5.0% |
| 9-12th Grade | 0.0% | 4.0% | 6.0% |
| High School / GED | 5.0% | 22.0% | 26.0% |
| Some College | 8.0% | 22.0% | 19.0% |
| Associate's Degree | 6.0% | 10.0% | 9.0% |
| Bachelor's Degree | 38.0% | 24.0% | 21.0% |
| Master's Degree | 22.0% | 11.0% | 10.0% |
| Professional Degree | 11.0% | 2.0% | 2.0% |
| Doctorate Degree | 7.0% | 2.0% | 2.0% |
Household Income For Mercer Island, Washington
2.5% of households in Mercer Island earn Less than $10,000.
0.6% of households in Mercer Island earn $10,000 to $14,999.
3.0% of households in Mercer Island earn $15,000 to $24,999.
3.7% of households in Mercer Island earn $25,000 to $34,999.
5.0% of households in Mercer Island earn $35,000 to $49,999.
7.7% of households in Mercer Island earn $50,000 to $74,999.
5.7% of households in Mercer Island earn $75,000 to $99,999.
12.4% of households in Mercer Island earn $100,000 to $149,999.
8.7% of households in Mercer Island earn $150,000 to $199,999.
50.6% of households in Mercer Island earn $200,000 or more.
| Income | Mercer Island | WA | USA |
|---|---|---|---|
| Less than $10,000 | 2.5% | 3.8% | 4.9% |
| $10,000 to $14,999 | 0.6% | 2.7% | 3.6% |
| $15,000 to $24,999 | 3.0% | 4.9% | 6.6% |
| $25,000 to $34,999 | 3.7% | 5.3% | 6.8% |
| $35,000 to $49,999 | 5.0% | 8.6% | 10.4% |
| $50,000 to $74,999 | 7.7% | 14.6% | 15.7% |
| $75,000 to $99,999 | 5.7% | 12.6% | 12.7% |
| $100,000 to $149,999 | 12.4% | 19.2% | 17.4% |
| $150,000 to $199,999 | 8.7% | 11.3% | 9.3% |
| $200,000 or more | 50.6% | 17.2% | 12.6% |


