Puyallup, WA
Demographics And Statistics
Living In Puyallup, Washington Summary
Life in Puyallup research summary. HomeSnacks has been using Saturday Night Science to research the quality of life in Puyallup over the past nine years using Census, FBI, Zillow, and other primary data sources. Based on the most recently available data, we found the following about life in Puyallup:
The population in Puyallup is 42,642.
The median home value in Puyallup is $563,859.
The median income in Puyallup is $95,639.
The cost of living in Puyallup is 135 which is 1.4x higher than the national average.
The median rent in Puyallup is $1,750.
The unemployment rate in Puyallup is 5.3%.
The poverty rate in Puyallup is 7.5%.
The average high in Puyallup is 61.4° and the average low is 44.0°.
Puyallup SnackAbility
Overall SnackAbility
Puyallup, WA Crime Report
Crime in Puyallup summary. We use data from the FBI to determine the crime rates in Puyallup. Key points include:
There were 1,778 total crimes in Puyallup in the last reporting year.
The overall crime rate per 100,000 people in Puyallup is 4,243.6 / 100k people.
The violent crime rate per 100,000 people in Puyallup is 374.7 / 100k people.
The property crime rate per 100,000 people in Puyallup is 3,868.9 / 100k people.
Overall, crime in Puyallup is 100.24% above the national average.
Total Crimes
Above National Average
Crime In Puyallup Comparison Table
| Statistic | Count Raw |
Puyallup / 100k People |
Washington / 100k People |
National / 100k People |
|---|---|---|---|---|
| Total Crimes Per 100K | 1,778 | 4,243.6 | 2,792.6 | 2,119.2 |
| Violent Crime | 157 | 374.7 | 326.1 | 359.0 |
| Murder | 1 | 2.4 | 3.8 | 5.0 |
| Robbery | 36 | 85.9 | 67.5 | 61.0 |
| Aggravated Assault | 106 | 253.0 | 217.0 | 256.0 |
| Property Crime | 1,621 | 3,868.9 | 2,466.5 | 1,760.0 |
| Burglary | 188 | 448.7 | 398.8 | 229.0 |
| Larceny | 1,078 | 2,572.9 | 1,634.2 | 1,272.0 |
| Car Theft | 355 | 847.3 | 433.5 | 259.0 |
Puyallup, WA Cost Of Living
Cost of living in Puyallup summary. We use data on the cost of living to determine how expensive it is to live in Puyallup. Real estate prices drive most of the variance in cost of living around Washington. Key points include:
The cost of living in Puyallup is 135 with 100 being average.
The cost of living in Puyallup is 1.4x higher than the national average.
The median home value in Puyallup is $563,859.
The median income in Puyallup is $95,639.
Puyallup's Overall Cost Of Living
Higher Than The National Average
Cost Of Living In Puyallup Comparison Table
| Living Expense | Puyallup | Washington | National Average | |
|---|---|---|---|---|
| Overall | 135 | 118 | 100 | |
| Services | 117 | 111 | 100 | |
| Groceries | 114 | 112 | 100 | |
| Health | 126 | 122 | 100 | |
| Housing | 174 | 135 | 100 | |
| Transportation | 126 | 124 | 100 | |
| Utilities | 96 | 91 | 100 | |
Puyallup, WA Weather
The average high in Puyallup is 61.4° and the average low is 44.0°.
There are 97.8 days of precipitation each year.
Expect an average of 40.4 inches of precipitation each year with 3.8 inches of snow.
| Stat | Puyallup |
|---|---|
| Average Annual High | 61.4 |
| Average Annual Low | 44.0 |
| Annual Precipitation Days | 97.8 |
| Average Annual Precipitation | 40.4 |
| Average Annual Snowfall | 3.8 |
Average High
Days of Rain
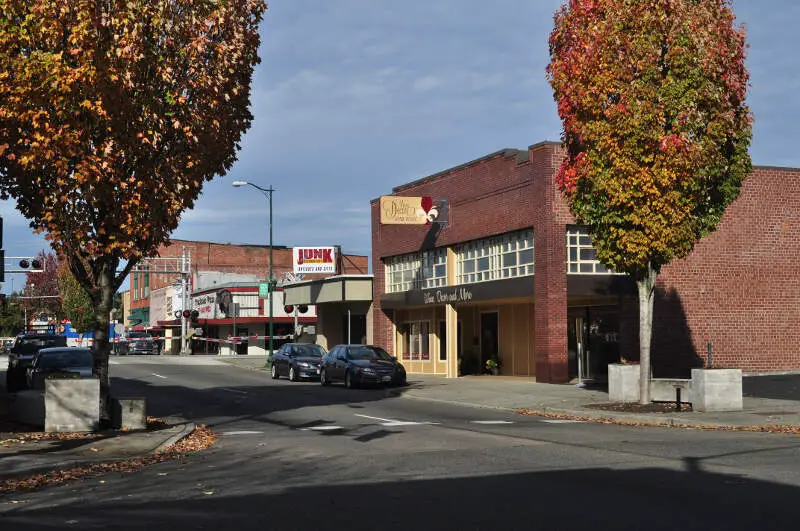
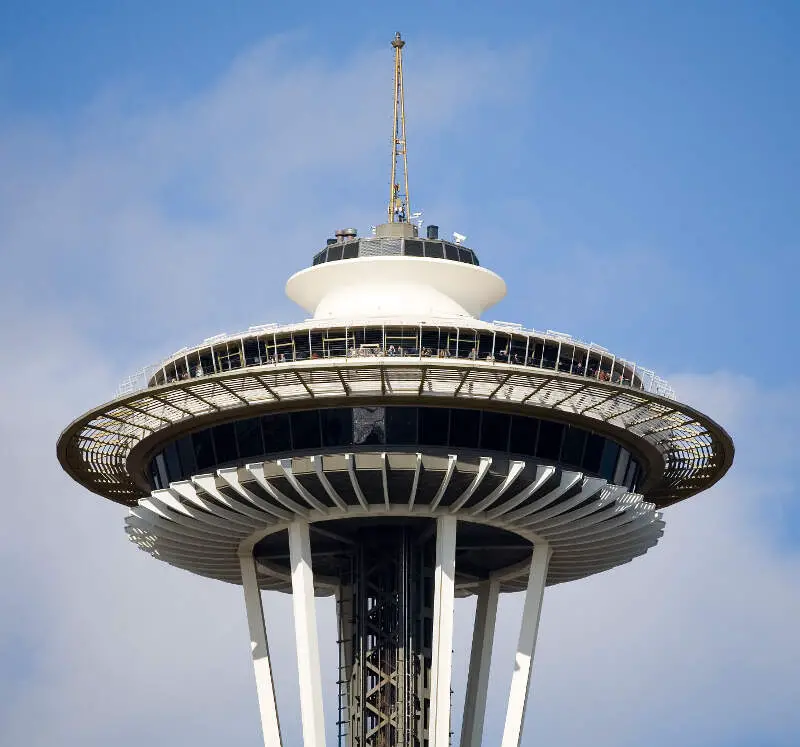
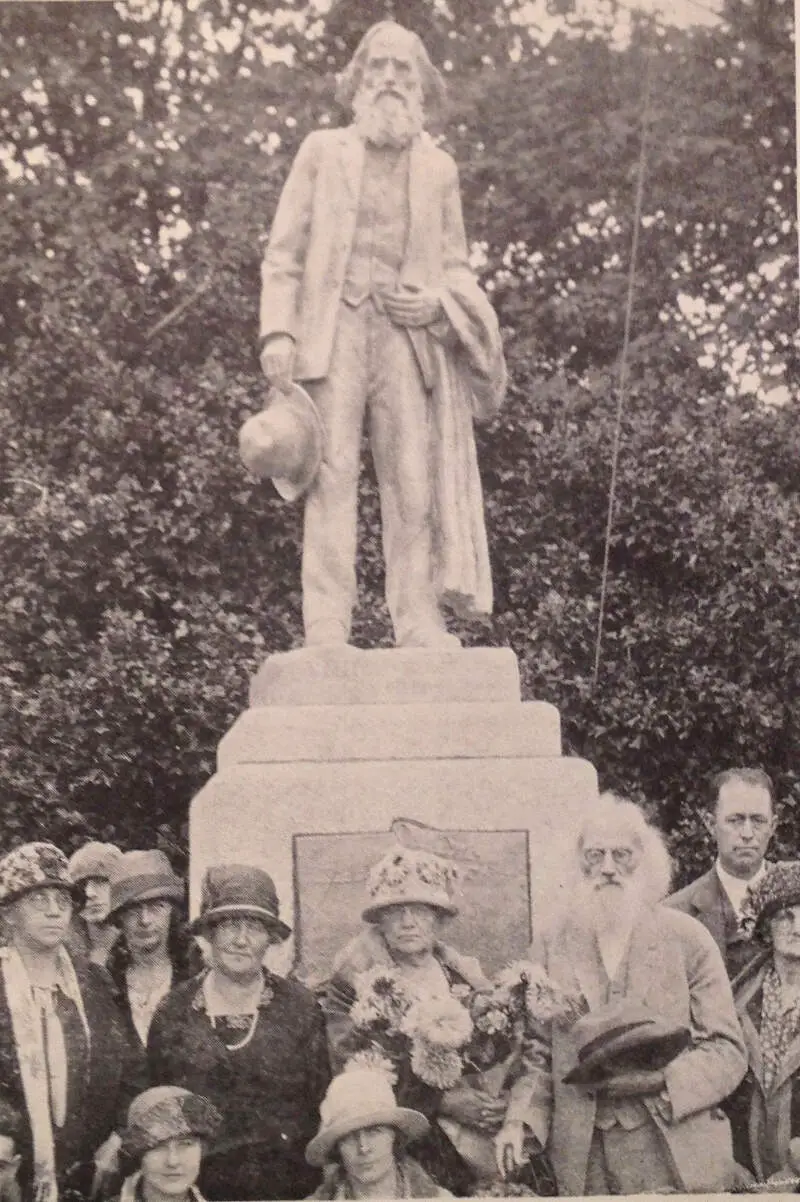
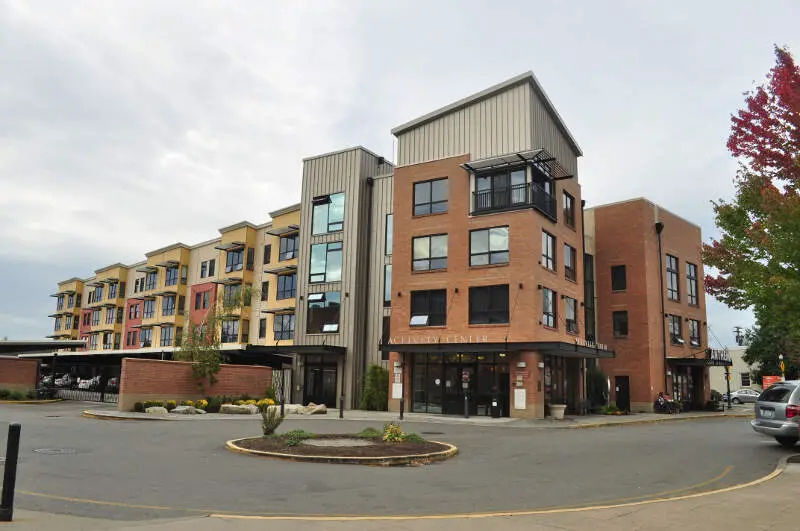
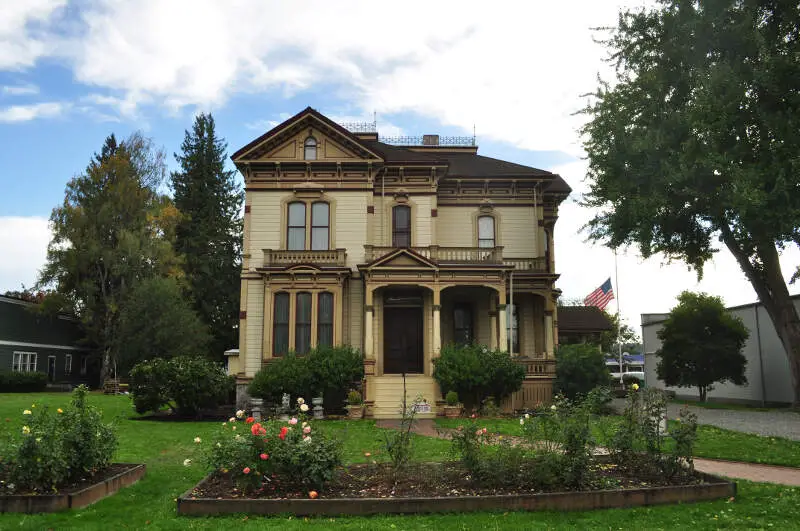
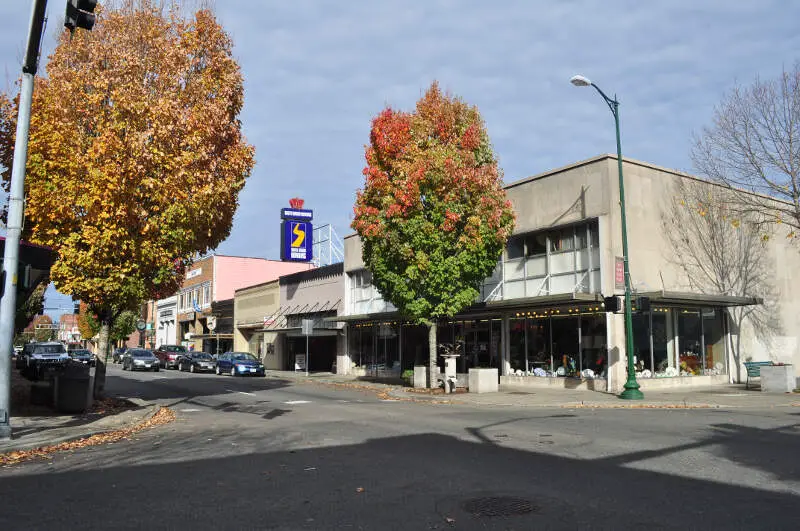
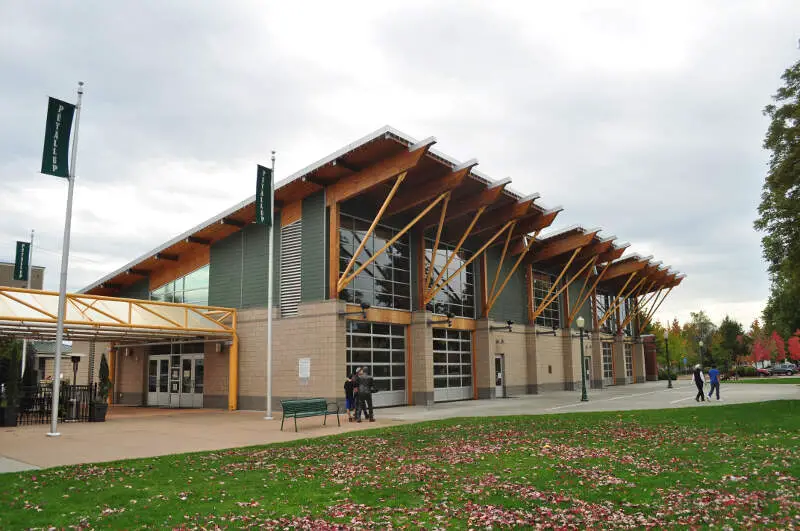
Puyallup, WA Photos
Rankings for Puyallup in Washington


Locations Around Puyallup
Map Of Puyallup, WA
Best Places Around Puyallup
Gig Harbor, WA
Population 12,202
Summit View, WA
Population 9,014
Fife, WA
Population 10,902
Parkland, WA
Population 39,174
Midland, WA
Population 8,676
Lakewood, WA
Population 63,034
Sumner, WA
Population 10,674
Wollochet, WA
Population 6,905
Tacoma, WA
Population 220,482
Frederickson, WA
Population 24,219
Puyallup Demographics And Statistics
Population over time in Puyallup
The current population in Puyallup is 42,642. The population has increased 16.2% from 2010.
| Year | Population | % Change |
|---|---|---|
| 2023 | 42,642 | 0.1% |
| 2022 | 42,610 | 0.6% |
| 2021 | 42,366 | 1.7% |
| 2020 | 41,666 | 1.6% |
| 2019 | 40,991 | 1.7% |
| 2018 | 40,305 | 1.7% |
| 2017 | 39,637 | 0.9% |
| 2016 | 39,274 | 1.4% |
| 2015 | 38,720 | 1.6% |
| 2014 | 38,092 | 1.0% |
| 2013 | 37,720 | 1.0% |
| 2012 | 37,358 | 1.0% |
| 2011 | 36,974 | 0.7% |
| 2010 | 36,703 | - |
Race / Ethnicity in Puyallup
Puyallup is:
69.9% White with 29,807 White residents.
4.0% African American with 1,725 African American residents.
0.3% American Indian with 143 American Indian residents.
6.1% Asian with 2,610 Asian residents.
0.6% Hawaiian with 246 Hawaiian residents.
0.9% Other with 368 Other residents.
7.9% Two Or More with 3,378 Two Or More residents.
10.2% Hispanic with 4,365 Hispanic residents.
| Race | Puyallup | WA | USA |
|---|---|---|---|
| White | 69.9% | 64.3% | 58.2% |
| African American | 4.0% | 3.8% | 12.0% |
| American Indian | 0.3% | 0.8% | 0.5% |
| Asian | 6.1% | 9.3% | 5.7% |
| Hawaiian | 0.6% | 0.7% | 0.2% |
| Other | 0.9% | 0.5% | 0.5% |
| Two Or More | 7.9% | 6.5% | 3.9% |
| Hispanic | 10.2% | 14.1% | 19.0% |
Gender in Puyallup
Puyallup is 51.2% female with 21,833 female residents.
Puyallup is 48.8% male with 20,809 male residents.
| Gender | Puyallup | WA | USA |
|---|---|---|---|
| Female | 51.2% | 49.6% | 50.5% |
| Male | 48.8% | 50.4% | 49.5% |
Highest level of educational attainment in Puyallup for adults over 25
2.0% of adults in Puyallup completed < 9th grade.
4.0% of adults in Puyallup completed 9-12th grade.
29.0% of adults in Puyallup completed high school / ged.
24.0% of adults in Puyallup completed some college.
13.0% of adults in Puyallup completed associate's degree.
20.0% of adults in Puyallup completed bachelor's degree.
6.0% of adults in Puyallup completed master's degree.
1.0% of adults in Puyallup completed professional degree.
1.0% of adults in Puyallup completed doctorate degree.
| Education | Puyallup | WA | USA |
|---|---|---|---|
| < 9th Grade | 2.0% | 3.0% | 5.0% |
| 9-12th Grade | 4.0% | 4.0% | 6.0% |
| High School / GED | 29.0% | 22.0% | 26.0% |
| Some College | 24.0% | 22.0% | 19.0% |
| Associate's Degree | 13.0% | 10.0% | 9.0% |
| Bachelor's Degree | 20.0% | 24.0% | 21.0% |
| Master's Degree | 6.0% | 11.0% | 10.0% |
| Professional Degree | 1.0% | 2.0% | 2.0% |
| Doctorate Degree | 1.0% | 2.0% | 2.0% |
Household Income For Puyallup, Washington
1.9% of households in Puyallup earn Less than $10,000.
1.7% of households in Puyallup earn $10,000 to $14,999.
5.6% of households in Puyallup earn $15,000 to $24,999.
5.1% of households in Puyallup earn $25,000 to $34,999.
7.7% of households in Puyallup earn $35,000 to $49,999.
13.9% of households in Puyallup earn $50,000 to $74,999.
16.1% of households in Puyallup earn $75,000 to $99,999.
24.2% of households in Puyallup earn $100,000 to $149,999.
10.5% of households in Puyallup earn $150,000 to $199,999.
13.5% of households in Puyallup earn $200,000 or more.
| Income | Puyallup | WA | USA |
|---|---|---|---|
| Less than $10,000 | 1.9% | 3.8% | 4.9% |
| $10,000 to $14,999 | 1.7% | 2.7% | 3.6% |
| $15,000 to $24,999 | 5.6% | 4.9% | 6.6% |
| $25,000 to $34,999 | 5.1% | 5.3% | 6.8% |
| $35,000 to $49,999 | 7.7% | 8.6% | 10.4% |
| $50,000 to $74,999 | 13.9% | 14.6% | 15.7% |
| $75,000 to $99,999 | 16.1% | 12.6% | 12.7% |
| $100,000 to $149,999 | 24.2% | 19.2% | 17.4% |
| $150,000 to $199,999 | 10.5% | 11.3% | 9.3% |
| $200,000 or more | 13.5% | 17.2% | 12.6% |


