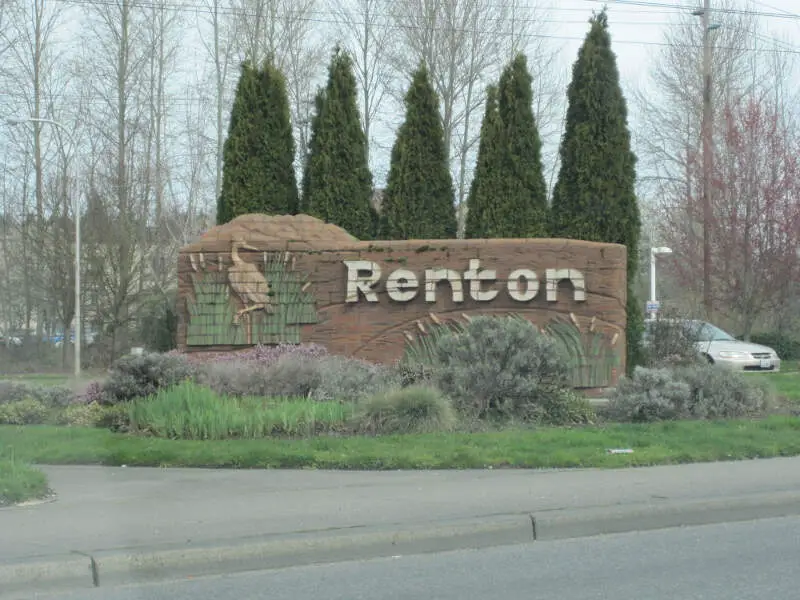
Renton, WA
Demographics And Statistics
Living In Renton, Washington Summary
Life in Renton research summary. HomeSnacks has been using Saturday Night Science to research the quality of life in Renton over the past nine years using Census, FBI, Zillow, and other primary data sources. Based on the most recently available data, we found the following about life in Renton:
The population in Renton is 105,279.
The median home value in Renton is $746,524.
The median income in Renton is $96,626.
The cost of living in Renton is 147 which is 1.5x higher than the national average.
The median rent in Renton is $1,923.
The unemployment rate in Renton is 4.5%.
The poverty rate in Renton is 7.8%.
The average high in Renton is 60.1° and the average low is 44.0°.
Renton SnackAbility
Overall SnackAbility
Renton, WA Crime Report
Crime in Renton summary. We use data from the FBI to determine the crime rates in Renton. Key points include:
There were 3,790 total crimes in Renton in the last reporting year.
The overall crime rate per 100,000 people in Renton is 3,652.6 / 100k people.
The violent crime rate per 100,000 people in Renton is 339.2 / 100k people.
The property crime rate per 100,000 people in Renton is 3,313.4 / 100k people.
Overall, crime in Renton is 72.35% above the national average.
Total Crimes
Above National Average
Crime In Renton Comparison Table
| Statistic | Count Raw |
Renton / 100k People |
Washington / 100k People |
National / 100k People |
|---|---|---|---|---|
| Total Crimes Per 100K | 3,790 | 3,652.6 | 2,792.6 | 2,119.2 |
| Violent Crime | 352 | 339.2 | 326.1 | 359.0 |
| Murder | 5 | 4.8 | 3.8 | 5.0 |
| Robbery | 95 | 91.6 | 67.5 | 61.0 |
| Aggravated Assault | 205 | 197.6 | 217.0 | 256.0 |
| Property Crime | 3,438 | 3,313.4 | 2,466.5 | 1,760.0 |
| Burglary | 452 | 435.6 | 398.8 | 229.0 |
| Larceny | 1,805 | 1,739.6 | 1,634.2 | 1,272.0 |
| Car Theft | 1,181 | 1,138.2 | 433.5 | 259.0 |
Renton, WA Cost Of Living
Cost of living in Renton summary. We use data on the cost of living to determine how expensive it is to live in Renton. Real estate prices drive most of the variance in cost of living around Washington. Key points include:
The cost of living in Renton is 147 with 100 being average.
The cost of living in Renton is 1.5x higher than the national average.
The median home value in Renton is $746,524.
The median income in Renton is $96,626.
Renton's Overall Cost Of Living
Higher Than The National Average
Cost Of Living In Renton Comparison Table
| Living Expense | Renton | Washington | National Average | |
|---|---|---|---|---|
| Overall | 147 | 118 | 100 | |
| Services | 115 | 111 | 100 | |
| Groceries | 114 | 112 | 100 | |
| Health | 114 | 122 | 100 | |
| Housing | 220 | 135 | 100 | |
| Transportation | 126 | 124 | 100 | |
| Utilities | 99 | 91 | 100 | |
Renton, WA Weather
The average high in Renton is 60.1° and the average low is 44.0°.
There are 101.3 days of precipitation each year.
Expect an average of 40.0 inches of precipitation each year with 5.4 inches of snow.
| Stat | Renton |
|---|---|
| Average Annual High | 60.1 |
| Average Annual Low | 44.0 |
| Annual Precipitation Days | 101.3 |
| Average Annual Precipitation | 40.0 |
| Average Annual Snowfall | 5.4 |
Average High
Days of Rain
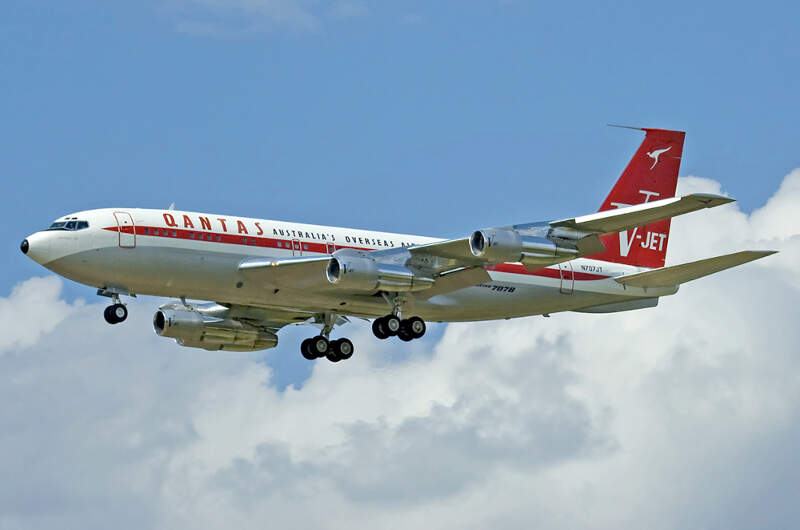
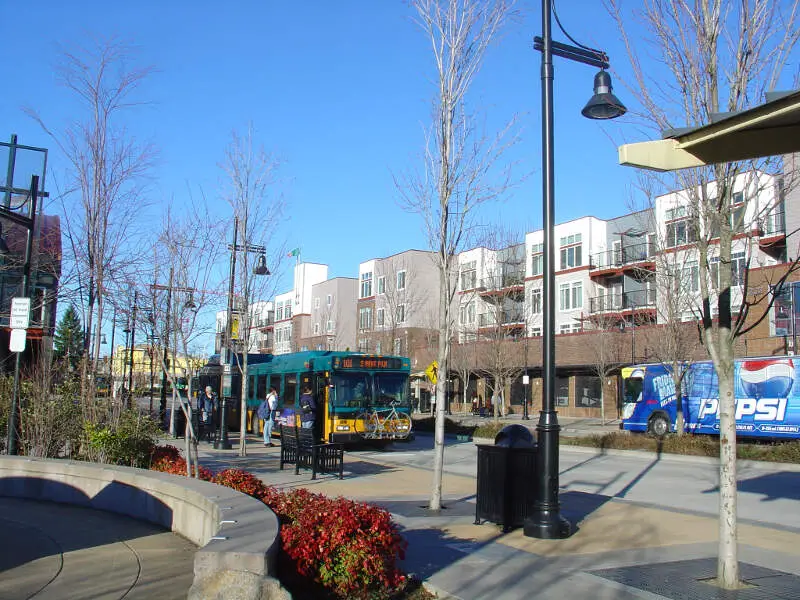
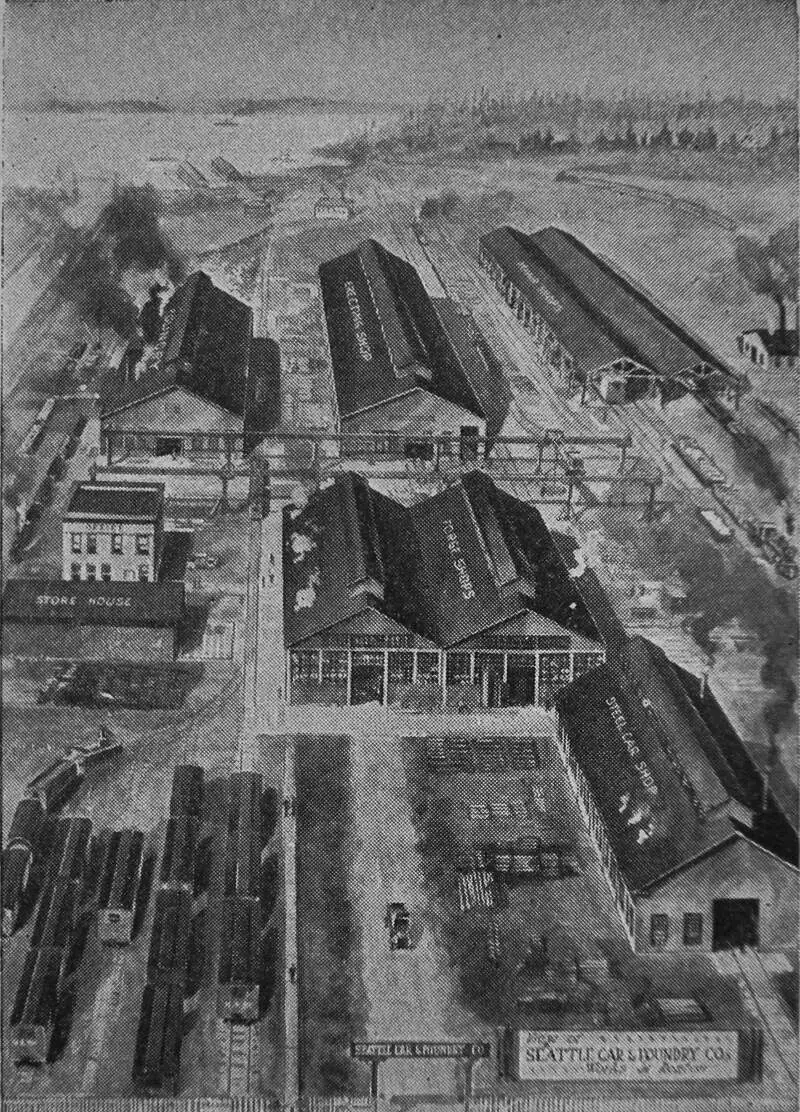
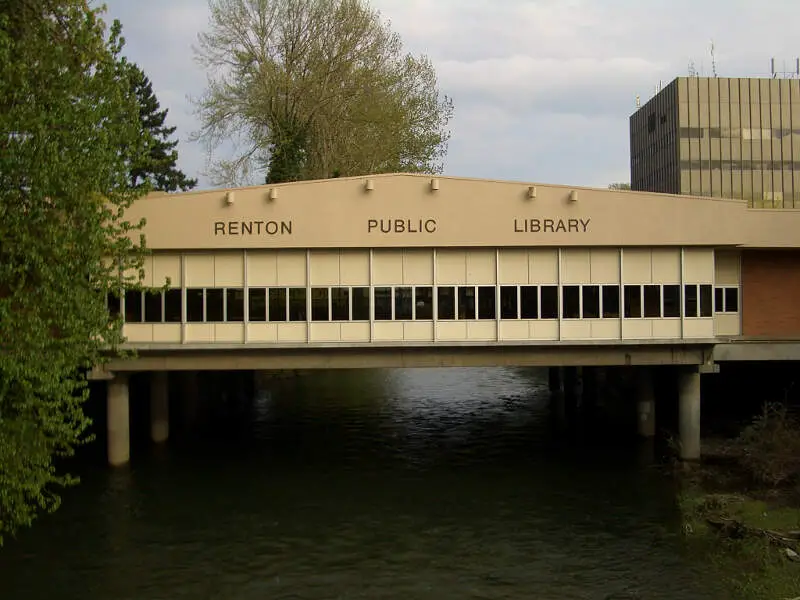
Renton, WA Photos
Rankings for Renton in Washington


Locations Around Renton
Map Of Renton, WA
Best Places Around Renton
Fife, WA
Population 10,902
Sumner, WA
Population 10,674
Tacoma, WA
Population 220,482
Bainbridge Island, WA
Population 24,607
Lake Tapps, WA
Population 12,360
Vashon, WA
Population 10,424
SeaTac, WA
Population 31,143
Bonney Lake, WA
Population 22,776
Milton, WA
Population 8,747
Kent, WA
Population 135,015
Renton Demographics And Statistics
Population over time in Renton
The current population in Renton is 105,279. The population has increased 21.9% from 2010.
| Year | Population | % Change |
|---|---|---|
| 2023 | 105,279 | -0.1% |
| 2022 | 105,355 | 0.0% |
| 2021 | 105,313 | 3.4% |
| 2020 | 101,871 | 0.4% |
| 2019 | 101,484 | 0.4% |
| 2018 | 101,054 | 1.4% |
| 2017 | 99,692 | 1.2% |
| 2016 | 98,499 | 1.3% |
| 2015 | 97,234 | 1.8% |
| 2014 | 95,479 | 2.0% |
| 2013 | 93,601 | 2.6% |
| 2012 | 91,273 | 3.0% |
| 2011 | 88,655 | 2.6% |
| 2010 | 86,372 | - |
Race / Ethnicity in Renton
Renton is:
40.4% White with 42,561 White residents.
8.9% African American with 9,334 African American residents.
0.4% American Indian with 374 American Indian residents.
25.8% Asian with 27,156 Asian residents.
0.7% Hawaiian with 764 Hawaiian residents.
0.7% Other with 742 Other residents.
8.5% Two Or More with 8,981 Two Or More residents.
14.6% Hispanic with 15,367 Hispanic residents.
| Race | Renton | WA | USA |
|---|---|---|---|
| White | 40.4% | 64.3% | 58.2% |
| African American | 8.9% | 3.8% | 12.0% |
| American Indian | 0.4% | 0.8% | 0.5% |
| Asian | 25.8% | 9.3% | 5.7% |
| Hawaiian | 0.7% | 0.7% | 0.2% |
| Other | 0.7% | 0.5% | 0.5% |
| Two Or More | 8.5% | 6.5% | 3.9% |
| Hispanic | 14.6% | 14.1% | 19.0% |
Gender in Renton
Renton is 50.0% female with 52,627 female residents.
Renton is 50.0% male with 52,651 male residents.
| Gender | Renton | WA | USA |
|---|---|---|---|
| Female | 50.0% | 49.6% | 50.5% |
| Male | 50.0% | 50.4% | 49.5% |
Highest level of educational attainment in Renton for adults over 25
6.0% of adults in Renton completed < 9th grade.
5.0% of adults in Renton completed 9-12th grade.
20.0% of adults in Renton completed high school / ged.
20.0% of adults in Renton completed some college.
10.0% of adults in Renton completed associate's degree.
25.0% of adults in Renton completed bachelor's degree.
10.0% of adults in Renton completed master's degree.
2.0% of adults in Renton completed professional degree.
2.0% of adults in Renton completed doctorate degree.
| Education | Renton | WA | USA |
|---|---|---|---|
| < 9th Grade | 6.0% | 3.0% | 5.0% |
| 9-12th Grade | 5.0% | 4.0% | 6.0% |
| High School / GED | 20.0% | 22.0% | 26.0% |
| Some College | 20.0% | 22.0% | 19.0% |
| Associate's Degree | 10.0% | 10.0% | 9.0% |
| Bachelor's Degree | 25.0% | 24.0% | 21.0% |
| Master's Degree | 10.0% | 11.0% | 10.0% |
| Professional Degree | 2.0% | 2.0% | 2.0% |
| Doctorate Degree | 2.0% | 2.0% | 2.0% |
Household Income For Renton, Washington
3.3% of households in Renton earn Less than $10,000.
2.6% of households in Renton earn $10,000 to $14,999.
4.6% of households in Renton earn $15,000 to $24,999.
4.7% of households in Renton earn $25,000 to $34,999.
6.9% of households in Renton earn $35,000 to $49,999.
15.5% of households in Renton earn $50,000 to $74,999.
13.7% of households in Renton earn $75,000 to $99,999.
19.4% of households in Renton earn $100,000 to $149,999.
11.4% of households in Renton earn $150,000 to $199,999.
17.7% of households in Renton earn $200,000 or more.
| Income | Renton | WA | USA |
|---|---|---|---|
| Less than $10,000 | 3.3% | 3.8% | 4.9% |
| $10,000 to $14,999 | 2.6% | 2.7% | 3.6% |
| $15,000 to $24,999 | 4.6% | 4.9% | 6.6% |
| $25,000 to $34,999 | 4.7% | 5.3% | 6.8% |
| $35,000 to $49,999 | 6.9% | 8.6% | 10.4% |
| $50,000 to $74,999 | 15.5% | 14.6% | 15.7% |
| $75,000 to $99,999 | 13.7% | 12.6% | 12.7% |
| $100,000 to $149,999 | 19.4% | 19.2% | 17.4% |
| $150,000 to $199,999 | 11.4% | 11.3% | 9.3% |
| $200,000 or more | 17.7% | 17.2% | 12.6% |


