Wenatchee, WA
Demographics And Statistics
Living In Wenatchee, Washington Summary
Life in Wenatchee research summary. HomeSnacks has been using Saturday Night Science to research the quality of life in Wenatchee over the past nine years using Census, FBI, Zillow, and other primary data sources. Based on the most recently available data, we found the following about life in Wenatchee:
The population in Wenatchee is 35,502.
The median home value in Wenatchee is $493,529.
The median income in Wenatchee is $70,000.
The cost of living in Wenatchee is 118 which is 1.2x higher than the national average.
The median rent in Wenatchee is $1,194.
The unemployment rate in Wenatchee is 3.7%.
The poverty rate in Wenatchee is 11.7%.
The average high in Wenatchee is 62.7° and the average low is 40.9°.
Wenatchee SnackAbility
Overall SnackAbility
Wenatchee, WA Crime Report
Crime in Wenatchee summary. We use data from the FBI to determine the crime rates in Wenatchee. Key points include:
There were 1,074 total crimes in Wenatchee in the last reporting year.
The overall crime rate per 100,000 people in Wenatchee is 3,023.4 / 100k people.
The violent crime rate per 100,000 people in Wenatchee is 236.5 / 100k people.
The property crime rate per 100,000 people in Wenatchee is 2,786.9 / 100k people.
Overall, crime in Wenatchee is 42.66% above the national average.
Total Crimes
Above National Average
Crime In Wenatchee Comparison Table
| Statistic | Count Raw |
Wenatchee / 100k People |
Washington / 100k People |
National / 100k People |
|---|---|---|---|---|
| Total Crimes Per 100K | 1,074 | 3,023.4 | 2,792.6 | 2,119.2 |
| Violent Crime | 84 | 236.5 | 326.1 | 359.0 |
| Murder | 0 | 0.0 | 3.8 | 5.0 |
| Robbery | 12 | 33.8 | 67.5 | 61.0 |
| Aggravated Assault | 56 | 157.6 | 217.0 | 256.0 |
| Property Crime | 990 | 2,786.9 | 2,466.5 | 1,760.0 |
| Burglary | 151 | 425.1 | 398.8 | 229.0 |
| Larceny | 770 | 2,167.6 | 1,634.2 | 1,272.0 |
| Car Theft | 69 | 194.2 | 433.5 | 259.0 |
Wenatchee, WA Cost Of Living
Cost of living in Wenatchee summary. We use data on the cost of living to determine how expensive it is to live in Wenatchee. Real estate prices drive most of the variance in cost of living around Washington. Key points include:
The cost of living in Wenatchee is 118 with 100 being average.
The cost of living in Wenatchee is 1.2x higher than the national average.
The median home value in Wenatchee is $493,529.
The median income in Wenatchee is $70,000.
Wenatchee's Overall Cost Of Living
Higher Than The National Average
Cost Of Living In Wenatchee Comparison Table
| Living Expense | Wenatchee | Washington | National Average | |
|---|---|---|---|---|
| Overall | 118 | 118 | 100 | |
| Services | 114 | 111 | 100 | |
| Groceries | 107 | 112 | 100 | |
| Health | 121 | 122 | 100 | |
| Housing | 132 | 135 | 100 | |
| Transportation | 132 | 124 | 100 | |
| Utilities | 86 | 91 | 100 | |
Wenatchee, WA Weather
The average high in Wenatchee is 62.7° and the average low is 40.9°.
There are 28.7 days of precipitation each year.
Expect an average of 9.2 inches of precipitation each year with 24.4 inches of snow.
| Stat | Wenatchee |
|---|---|
| Average Annual High | 62.7 |
| Average Annual Low | 40.9 |
| Annual Precipitation Days | 28.7 |
| Average Annual Precipitation | 9.2 |
| Average Annual Snowfall | 24.4 |
Average High
Days of Rain
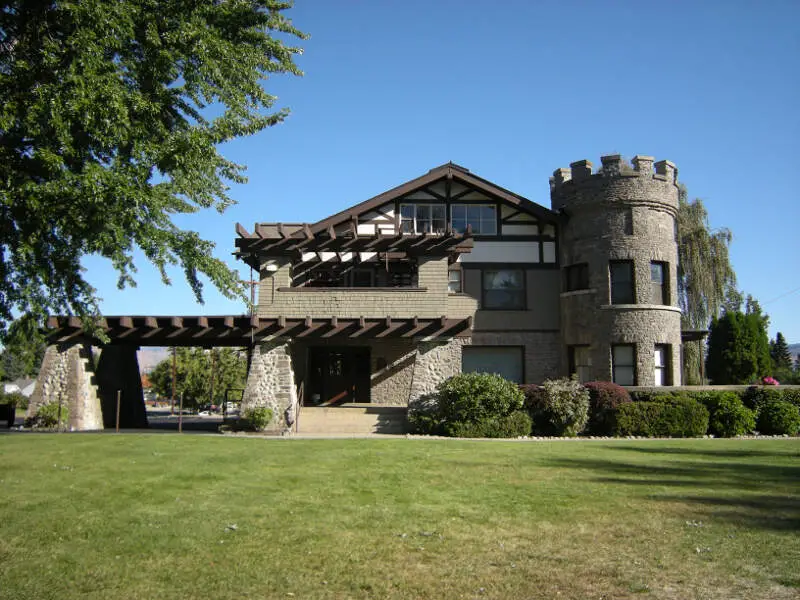
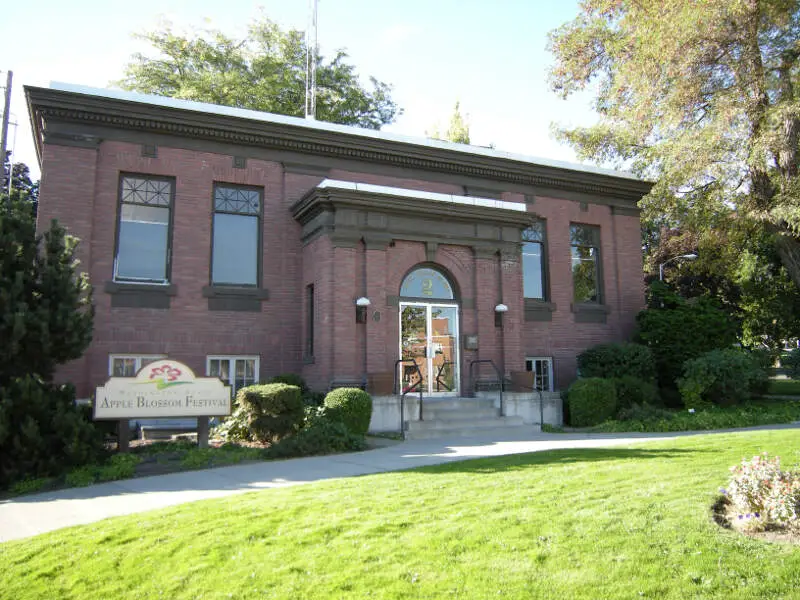
Wenatchee, WA Photos


1 Reviews & Comments About Wenatchee
/5

Travman 2322 - None
I live In Wenatchee WA You know that place all the west side people come and watch our wildfires and skiers if you live in or by Wenatchee tell me this is not true! !,
Rankings for Wenatchee in Washington


Locations Around Wenatchee
Map Of Wenatchee, WA
Best Places Around Wenatchee
Ephrata, WA
Population 8,493
Quincy, WA
Population 7,922
Ellensburg, WA
Population 18,913
East Wenatchee, WA
Population 14,114
Wenatchee Demographics And Statistics
Population over time in Wenatchee
The current population in Wenatchee is 35,502. The population has increased 13.9% from 2010.
| Year | Population | % Change |
|---|---|---|
| 2023 | 35,502 | 0.4% |
| 2022 | 35,365 | 0.8% |
| 2021 | 35,086 | 2.4% |
| 2020 | 34,249 | 0.2% |
| 2019 | 34,188 | 0.3% |
| 2018 | 34,094 | 1.6% |
| 2017 | 33,544 | 0.9% |
| 2016 | 33,257 | 0.9% |
| 2015 | 32,950 | 1.0% |
| 2014 | 32,627 | 1.0% |
| 2013 | 32,301 | 1.1% |
| 2012 | 31,956 | 1.2% |
| 2011 | 31,572 | 1.3% |
| 2010 | 31,173 | - |
Race / Ethnicity in Wenatchee
Wenatchee is:
58.6% White with 20,806 White residents.
0.9% African American with 328 African American residents.
0.7% American Indian with 256 American Indian residents.
0.8% Asian with 284 Asian residents.
0.1% Hawaiian with 26 Hawaiian residents.
0.1% Other with 47 Other residents.
3.7% Two Or More with 1,320 Two Or More residents.
35.0% Hispanic with 12,435 Hispanic residents.
| Race | Wenatchee | WA | USA |
|---|---|---|---|
| White | 58.6% | 64.3% | 58.2% |
| African American | 0.9% | 3.8% | 12.0% |
| American Indian | 0.7% | 0.8% | 0.5% |
| Asian | 0.8% | 9.3% | 5.7% |
| Hawaiian | 0.1% | 0.7% | 0.2% |
| Other | 0.1% | 0.5% | 0.5% |
| Two Or More | 3.7% | 6.5% | 3.9% |
| Hispanic | 35.0% | 14.1% | 19.0% |
Gender in Wenatchee
Wenatchee is 50.6% female with 17,973 female residents.
Wenatchee is 49.4% male with 17,529 male residents.
| Gender | Wenatchee | WA | USA |
|---|---|---|---|
| Female | 50.6% | 49.6% | 50.5% |
| Male | 49.4% | 50.4% | 49.5% |
Highest level of educational attainment in Wenatchee for adults over 25
9.0% of adults in Wenatchee completed < 9th grade.
6.0% of adults in Wenatchee completed 9-12th grade.
23.0% of adults in Wenatchee completed high school / ged.
22.0% of adults in Wenatchee completed some college.
11.0% of adults in Wenatchee completed associate's degree.
19.0% of adults in Wenatchee completed bachelor's degree.
6.0% of adults in Wenatchee completed master's degree.
3.0% of adults in Wenatchee completed professional degree.
1.0% of adults in Wenatchee completed doctorate degree.
| Education | Wenatchee | WA | USA |
|---|---|---|---|
| < 9th Grade | 9.0% | 3.0% | 5.0% |
| 9-12th Grade | 6.0% | 4.0% | 6.0% |
| High School / GED | 23.0% | 22.0% | 26.0% |
| Some College | 22.0% | 22.0% | 19.0% |
| Associate's Degree | 11.0% | 10.0% | 9.0% |
| Bachelor's Degree | 19.0% | 24.0% | 21.0% |
| Master's Degree | 6.0% | 11.0% | 10.0% |
| Professional Degree | 3.0% | 2.0% | 2.0% |
| Doctorate Degree | 1.0% | 2.0% | 2.0% |
Household Income For Wenatchee, Washington
3.2% of households in Wenatchee earn Less than $10,000.
2.9% of households in Wenatchee earn $10,000 to $14,999.
7.6% of households in Wenatchee earn $15,000 to $24,999.
9.8% of households in Wenatchee earn $25,000 to $34,999.
12.1% of households in Wenatchee earn $35,000 to $49,999.
17.9% of households in Wenatchee earn $50,000 to $74,999.
16.8% of households in Wenatchee earn $75,000 to $99,999.
15.9% of households in Wenatchee earn $100,000 to $149,999.
7.4% of households in Wenatchee earn $150,000 to $199,999.
6.4% of households in Wenatchee earn $200,000 or more.
| Income | Wenatchee | WA | USA |
|---|---|---|---|
| Less than $10,000 | 3.2% | 3.8% | 4.9% |
| $10,000 to $14,999 | 2.9% | 2.7% | 3.6% |
| $15,000 to $24,999 | 7.6% | 4.9% | 6.6% |
| $25,000 to $34,999 | 9.8% | 5.3% | 6.8% |
| $35,000 to $49,999 | 12.1% | 8.6% | 10.4% |
| $50,000 to $74,999 | 17.9% | 14.6% | 15.7% |
| $75,000 to $99,999 | 16.8% | 12.6% | 12.7% |
| $100,000 to $149,999 | 15.9% | 19.2% | 17.4% |
| $150,000 to $199,999 | 7.4% | 11.3% | 9.3% |
| $200,000 or more | 6.4% | 17.2% | 12.6% |


