Whitest cities in Kentucky research summary. We analyzed Kentucky’s most recent Census data to determine the whitest cities in Kentucky based on the percentage of White residents.
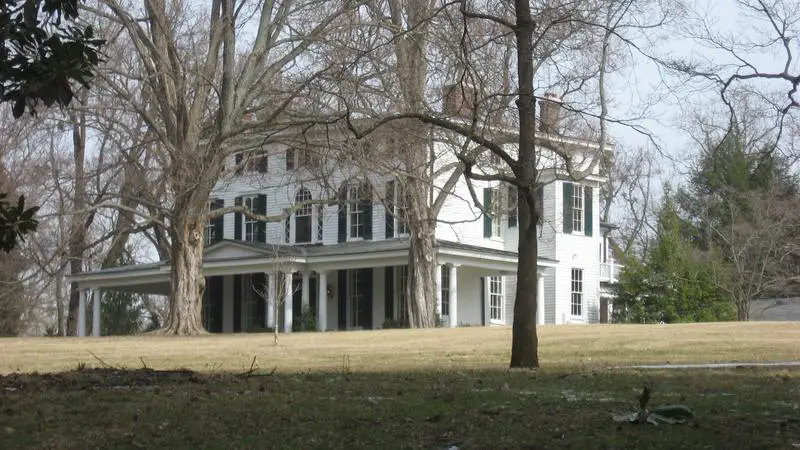
95.7% White · #1 whitest in Kentucky
Data | Crime | Cost of living | Movers
95.5% White · #2 whitest in Kentucky
Taylor Mill is a home rule-class city in Kenton County, Kentucky, in the United States. The population was 6,913 during the year 2000 U.S. census.
Data | Crime | Cost of living | Movers
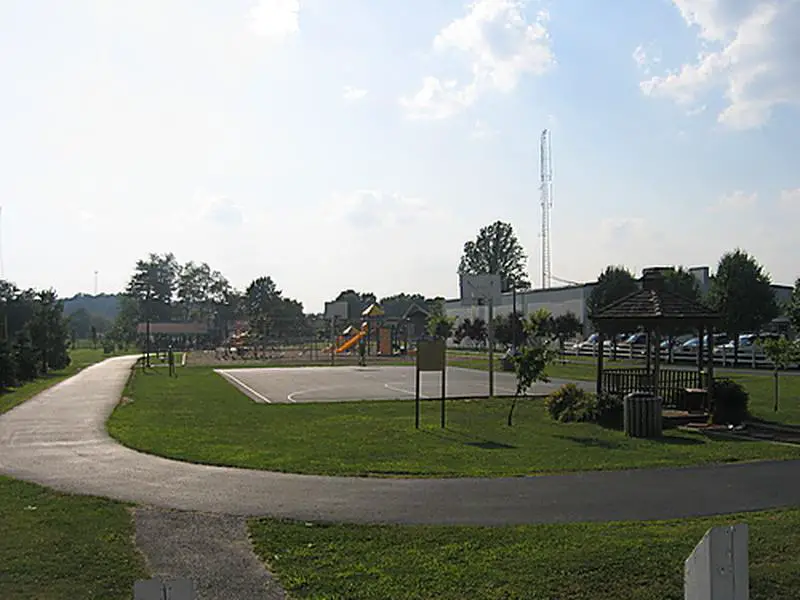
95.4% White · #3 whitest in Kentucky
Flatwoods is a home rule-class city in Greenup County, Kentucky, United States. Flatwoods is considered a suburb of nearby Ashland, although Ashland itself is located in neighboring Boyd County. The population of Flatwoods was 7,423 at the 2010 census, making Flatwoods the largest city in Greenup County. Flatwoods is a part of the Huntington-Ashland, WV-KY-OH, Metropolitan Statistical Area. As of the 2010 census, the MSA had a population of 287,702.
Data | Crime | Cost of living | Movers
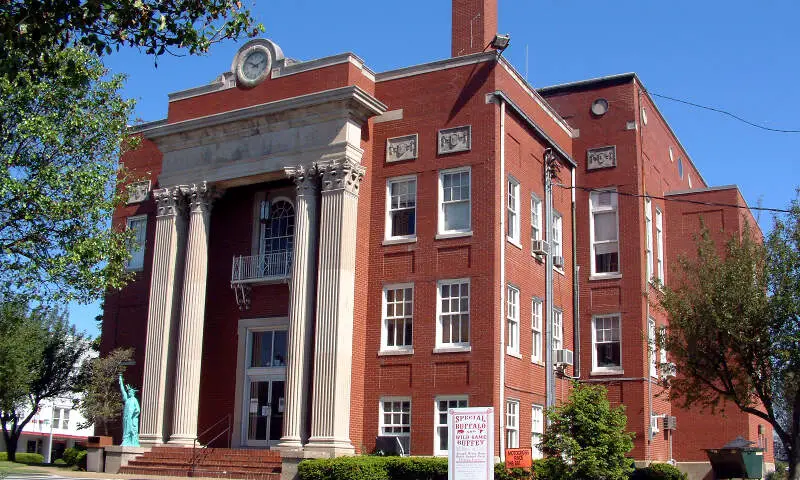
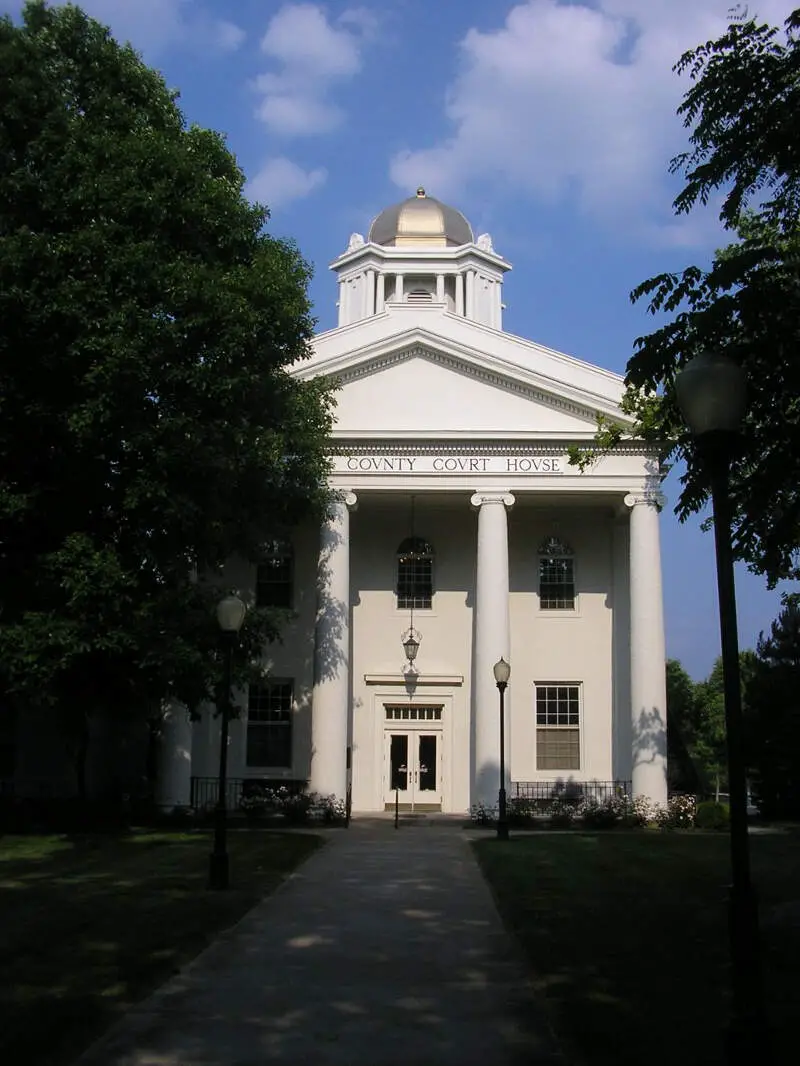
94.9% White · #4 whitest in Kentucky
Leitchfield is the county seat of Grayson County, Kentucky, United States. Leitchfield is a home rule-class city with a population of 6,699 as of the 2010 census.
Data | Crime | Cost of living | Movers
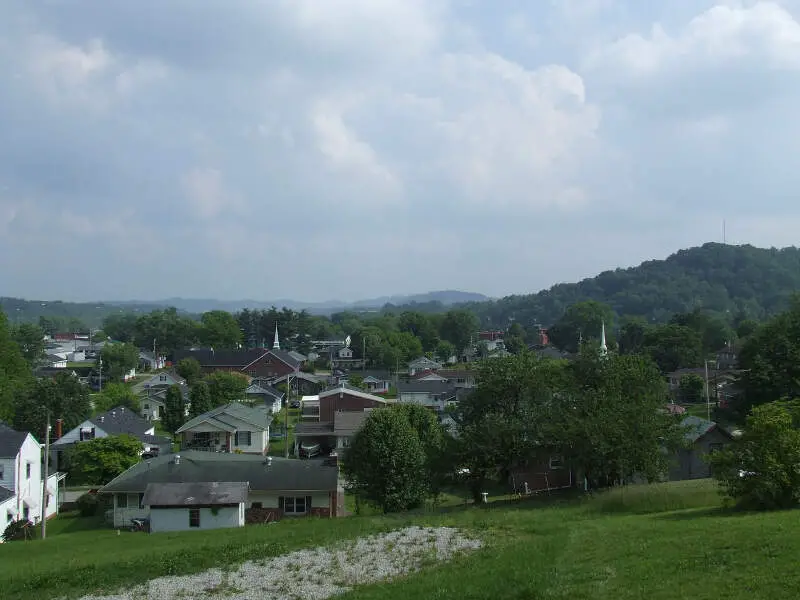
94.7% White · #5 whitest in Kentucky
Corbin is a home rule-class city in Whitley and Knox counties in the southeastern portion of the U.S. state of Kentucky. The urbanized area around Corbin extends into Laurel County; this area is not incorporated into the city limits due to a state law prohibiting cities from being in more than two counties. However, this area is served by some of the city’s public services. As of the 2010 census, the city population was 7,304, with 21,132 living in the “urban cluster” that includes Corbin and North Corbin.
Data | Crime | Cost of living | Movers
94.2% White · #6 whitest in Kentucky
Cold Spring is a home rule-class city in Campbell County, Kentucky, in the United States. The population was 5,912 at the 2010 census, up from 3,806 at the 2000 census. It is part of the Cincinnati-Northern Kentucky metropolitan area.
Data | Crime | Cost of living | Movers
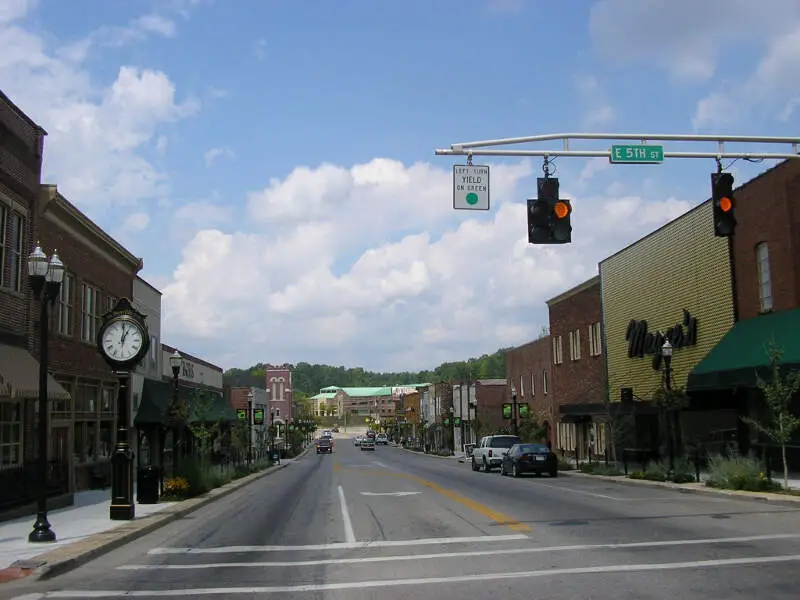
93.4% White · #7 whitest in Kentucky
London is a home rule-class city in Laurel County, Kentucky, in the United States. It is the seat of its county. The population was 7,993 at the time of the 2010 U.S. census. London, Kentucky, is the second-largest city named London in the United States and the fourth-largest in the world. It is part of the London, Kentucky micropolitan area. Of the seventeen micropolitan areas in Kentucky, London is the largest; the London micropolitan area’s 2010 Census population was 126,369. London is also home to the annual World Chicken Festival that celebrates the life of Colonel Sanders and features the world’s largest skillet.
Data | Crime | Cost of living | Movers
92.6% White · #8 whitest in Kentucky
Mount Washington is a home rule-class city in northeast Bullitt County, Kentucky, in the United States. The population was 9,117 at the 2010 census. The city is one of several surrounding Louisville that have experienced a sharp rise in population in the past three decades, becoming a commuter town.
Data | Crime | Cost of living | Movers
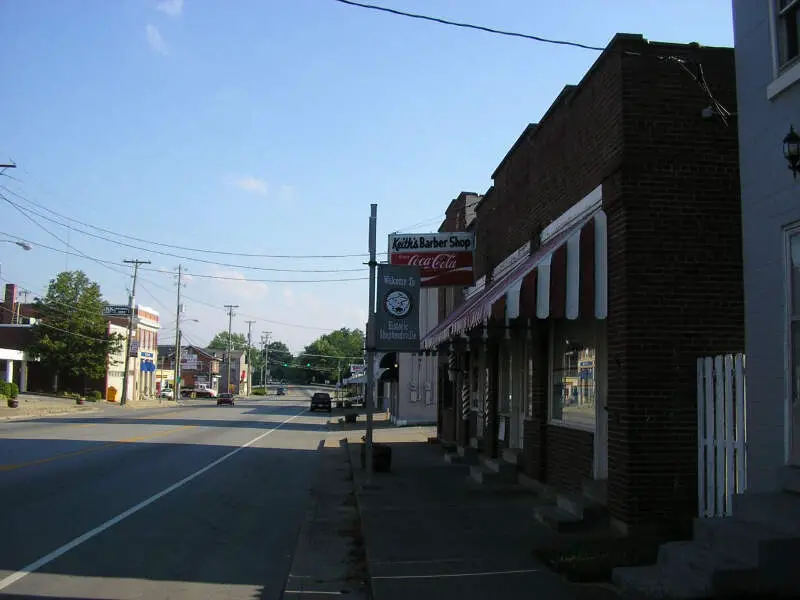
92.4% White · #9 whitest in Kentucky
Shepherdsville is a home rule-class city on the Salt River in Bullitt County, Kentucky, in the United States. It is the seat of its county, located just south of Louisville. The population was 11,222 during the 2010 U.S. Census.
Data | Crime | Cost of living | Movers
91.4% White · #10 whitest in Kentucky
Independence is a home rule-class city in Kenton County, Kentucky, in the United States. It is one of its county’s two seats of government. Independence is a suburb of Cincinnati, Ohio, and the population was 24,757 at the time of the 2010 U.S. census.
Data | Crime | Cost of living | Movers
The receipts
Compare the top ten
Pick a metric. The bars rescale. The red line is Kentucky’s statewide median.
On the map
Where Kentucky’s White population is concentrated
Saturday Night Science
Methodology: How we determined the whitest places in Kentucky for 2026
To rank the whitest places in Kentucky, we used Saturday Night Science to look at Census demographic data.
We had to look at the number of white people living in each city in Kentucky on a per capita basis. In other words, the percentage of white people living in each city in Kentucky.
We looked at table B03002: Hispanic OR LATINO ORIGIN BY RACE. Here are the category names as defined by the Census:
- Hispanic or Latino
- White alone*
- Black or African American alone*
- American Indian and Alaska Native alone*
- Asian alone*
- Native Hawaiian and Other Pacific Islander alone*
- Some other race alone*
- Two or more races*
Our particular column of interest here was the number of people who identified as White alone.
We limited our analysis to places with a population greater than 5,000 people. That left us with 75 cities.
We then calculated the percentage of residents that are White. The percentages ranked from 95.7% to 34.6%.
Finally, we ranked each city based on the percentage of the White population, with a higher percentage being more White. Edgewood took the distinction of being the most White, while Shively was the least White city.
We updated this article for 2026. This report represents our eleventh time ranking the whitest cities in Kentucky.
The full plate
Cities In Kentucky By White Population
Click any column to sort. Search by city name.
| Rank | City | Population | White Population | % White |
|---|---|---|---|---|
| 1 | Edgewood | 8,447 | 8,084 | 95.7% |
| 2 | Taylor Mill | 6,937 | 6,624 | 95.5% |
| 3 | Flatwoods | 7,269 | 6,938 | 95.4% |
| 4 | Leitchfield | 6,819 | 6,468 | 94.9% |
| 5 | Corbin | 8,246 | 7,805 | 94.7% |
| 6 | Cold Spring | 6,341 | 5,975 | 94.2% |
| 7 | London | 7,561 | 7,061 | 93.4% |
| 8 | Mount Washington | 18,480 | 17,120 | 92.6% |
| 9 | Shepherdsville | 14,533 | 13,425 | 92.4% |
| 10 | Independence | 29,392 | 26,855 | 91.4% |
| 11 | Alexandria | 10,562 | 9,640 | 91.3% |
| 12 | Ashland | 21,295 | 19,418 | 91.2% |
| 13 | Bellevue | 5,636 | 5,134 | 91.1% |
| 14 | Mount Sterling | 7,551 | 6,876 | 91.1% |
| 15 | Lawrenceburg | 11,943 | 10,817 | 90.6% |
| 16 | Morehead | 6,870 | 6,205 | 90.3% |
| 17 | Cynthiana | 6,458 | 5,818 | 90.1% |
| 18 | Pikeville | 7,490 | 6,708 | 89.6% |
| 19 | Union | 7,642 | 6,832 | 89.4% |
| 20 | Dayton | 5,743 | 5,099 | 88.8% |
| 21 | Fort Thomas | 17,169 | 15,241 | 88.8% |
| 22 | Middlesborough | 9,123 | 8,064 | 88.4% |
| 23 | Highland Heights | 6,444 | 5,651 | 87.7% |
| 24 | Berea | 15,786 | 13,833 | 87.6% |
| 25 | Villa Hills | 7,480 | 6,521 | 87.2% |
| 26 | La Grange | 10,311 | 8,965 | 86.9% |
| 27 | Central City | 5,707 | 4,945 | 86.6% |
| 28 | Williamsburg | 5,270 | 4,566 | 86.6% |
| 29 | Fort Mitchell | 8,713 | 7,532 | 86.4% |
| 30 | Somerset | 12,216 | 10,488 | 85.9% |
| 31 | St. Matthews | 17,577 | 15,041 | 85.6% |
| 32 | Winchester | 19,213 | 16,290 | 84.8% |
| 33 | Fort Wright | 5,887 | 4,974 | 84.5% |
| 34 | Maysville | 8,737 | 7,349 | 84.1% |
| 35 | Newport | 13,967 | 11,721 | 83.9% |
| 36 | Richmond | 37,111 | 30,984 | 83.5% |
| 37 | Nicholasville | 32,197 | 26,878 | 83.5% |
| 38 | Princeton | 6,241 | 5,134 | 82.3% |
| 39 | Monticello | 5,753 | 4,730 | 82.2% |
| 40 | Murray | 18,080 | 14,747 | 81.6% |
| 41 | Georgetown | 39,117 | 31,854 | 81.4% |
| 42 | Douglass Hills | 5,474 | 4,457 | 81.4% |
| 43 | Harrodsburg | 9,313 | 7,582 | 81.4% |
| 44 | Erlanger | 19,875 | 16,155 | 81.3% |
| 45 | Campbellsville | 11,622 | 9,430 | 81.1% |
| 46 | Franklin | 10,360 | 8,354 | 80.6% |
| 47 | Elsmere | 9,205 | 7,369 | 80.1% |
| 48 | Russellville | 7,316 | 5,854 | 80.0% |
| 49 | Paris | 10,160 | 8,067 | 79.4% |
| 50 | Owensboro | 60,302 | 47,667 | 79.0% |
| 51 | Glasgow | 15,197 | 12,009 | 79.0% |
| 52 | Danville | 17,327 | 13,575 | 78.3% |
| 53 | Bardstown | 13,804 | 10,773 | 78.0% |
| 54 | Henderson | 27,852 | 21,734 | 78.0% |
| 55 | Madisonville | 19,515 | 15,154 | 77.7% |
| 56 | Florence | 32,803 | 25,266 | 77.0% |
| 57 | Versailles | 10,492 | 8,028 | 76.5% |
| 58 | Covington | 41,110 | 30,916 | 75.2% |
| 59 | Middletown | 9,763 | 7,326 | 75.0% |
| 60 | Elizabethtown | 32,576 | 24,208 | 74.3% |
| 61 | Lyndon | 11,030 | 8,075 | 73.2% |
| 62 | Jeffersontown | 29,199 | 21,207 | 72.6% |
| 63 | Hillview | 8,797 | 6,371 | 72.4% |
| 64 | Frankfort | 28,503 | 20,527 | 72.0% |
| 65 | Lebanon | 6,430 | 4,528 | 70.4% |
| 66 | Paducah | 26,845 | 18,707 | 69.7% |
| 67 | Shelbyville | 17,668 | 11,861 | 67.1% |
| 68 | Lexington-Fayette urban county | 323,725 | 216,082 | 66.7% |
| 69 | Mayfield | 9,868 | 6,448 | 65.3% |
| 70 | Bowling Green | 75,388 | 46,827 | 62.1% |
| 71 | Louisville/Jefferson County metro government (balance) | 631,818 | 375,394 | 59.4% |
| 72 | Radcliff | 22,864 | 13,358 | 58.4% |
| 73 | Hopkinsville | 30,906 | 18,001 | 58.2% |
| 74 | Oak Grove | 7,962 | 4,314 | 54.2% |
| 75 | Shively | 15,638 | 5,404 | 34.6% |
Source: U.S. Census ACS 2020-2024. 75 cities with more than 5,000 residents.
Summary
Summary: White Populations Across Kentucky
We measured the locations with the highest percentage of white people in Kentucky. According to the most recent data, this list provides accurate information on the whitest places in Kentucky.
The most White cities in Kentucky are Edgewood, Taylor Mill, Flatwoods, Leitchfield, Corbin, Cold Spring, London, Mount Washington, Shepherdsville, and Independence. Not sold on Kentucky? Take the two-minute Find Your Place quiz and see which state actually fits you.


