Foley, AL
Demographics And Statistics
Living In Foley, Alabama Summary
Life in Foley research summary. HomeSnacks has been using Saturday Night Science to research the quality of life in Foley over the past nine years using Census, FBI, Zillow, and other primary data sources. Based on the most recently available data, we found the following about life in Foley:
The population in Foley is 22,330.
The median home value in Foley is $312,294.
The median income in Foley is $67,346.
The cost of living in Foley is 95 which is 0.9x lower than the national average.
The median rent in Foley is $1,169.
The unemployment rate in Foley is 5.6%.
The poverty rate in Foley is 11.8%.
The average high in Foley is 76.9° and the average low is 56.9°.
Foley SnackAbility
Overall SnackAbility
Foley, AL Crime Report
Crime in Foley summary. We use data from the FBI to determine the crime rates in Foley. Key points include:
There were 455 total crimes in Foley in the last reporting year.
The overall crime rate per 100,000 people in Foley is 1,721.9 / 100k people.
The violent crime rate per 100,000 people in Foley is 193.0 / 100k people.
The property crime rate per 100,000 people in Foley is 1,528.9 / 100k people.
Overall, crime in Foley is -18.75% below the national average.
Total Crimes
Below National Average
Crime In Foley Comparison Table
| Statistic | Count Raw |
Foley / 100k People |
Alabama / 100k People |
National / 100k People |
|---|---|---|---|---|
| Total Crimes Per 100K | 455 | 1,721.9 | 1,924.9 | 2,119.2 |
| Violent Crime | 51 | 193.0 | 359.9 | 359.0 |
| Murder | 1 | 3.8 | 8.7 | 5.0 |
| Robbery | 7 | 26.5 | 34.0 | 61.0 |
| Aggravated Assault | 43 | 162.7 | 291.4 | 256.0 |
| Property Crime | 404 | 1,528.9 | 1,565.1 | 1,760.0 |
| Burglary | 31 | 117.3 | 243.5 | 229.0 |
| Larceny | 340 | 1,286.7 | 1,148.5 | 1,272.0 |
| Car Theft | 33 | 124.9 | 173.0 | 259.0 |
Foley, AL Cost Of Living
Cost of living in Foley summary. We use data on the cost of living to determine how expensive it is to live in Foley. Real estate prices drive most of the variance in cost of living around Alabama. Key points include:
The cost of living in Foley is 95 with 100 being average.
The cost of living in Foley is 0.9x lower than the national average.
The median home value in Foley is $312,294.
The median income in Foley is $67,346.
Foley's Overall Cost Of Living
Lower Than The National Average
Cost Of Living In Foley Comparison Table
| Living Expense | Foley | Alabama | National Average | |
|---|---|---|---|---|
| Overall | 95 | 90 | 100 | |
| Services | 98 | 97 | 100 | |
| Groceries | 98 | 98 | 100 | |
| Health | 105 | 86 | 100 | |
| Housing | 100 | 74 | 100 | |
| Transportation | 95 | 93 | 100 | |
| Utilities | 88 | 102 | 100 | |
Foley, AL Weather
The average high in Foley is 76.9° and the average low is 56.9°.
There are 79.5 days of precipitation each year.
Expect an average of 66.1 inches of precipitation each year with 0.1 inches of snow.
| Stat | Foley |
|---|---|
| Average Annual High | 76.9 |
| Average Annual Low | 56.9 |
| Annual Precipitation Days | 79.5 |
| Average Annual Precipitation | 66.1 |
| Average Annual Snowfall | 0.1 |
Average High
Days of Rain
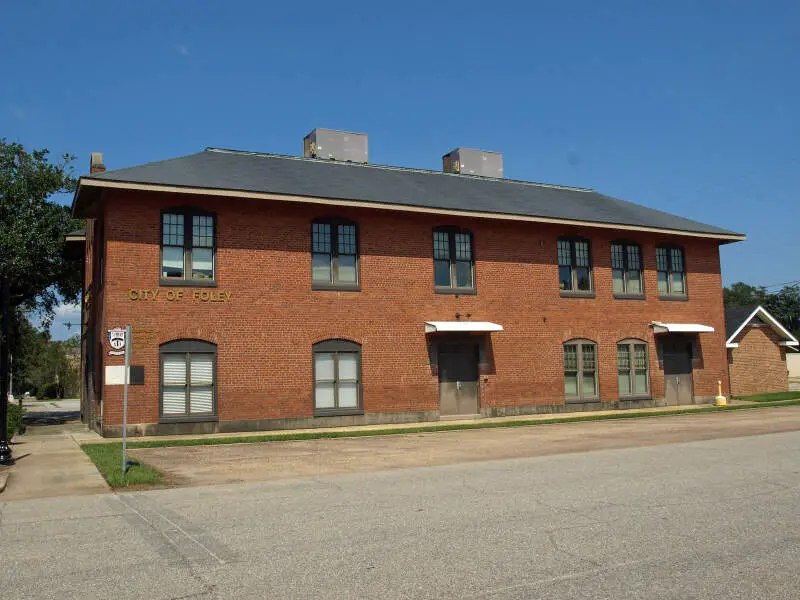
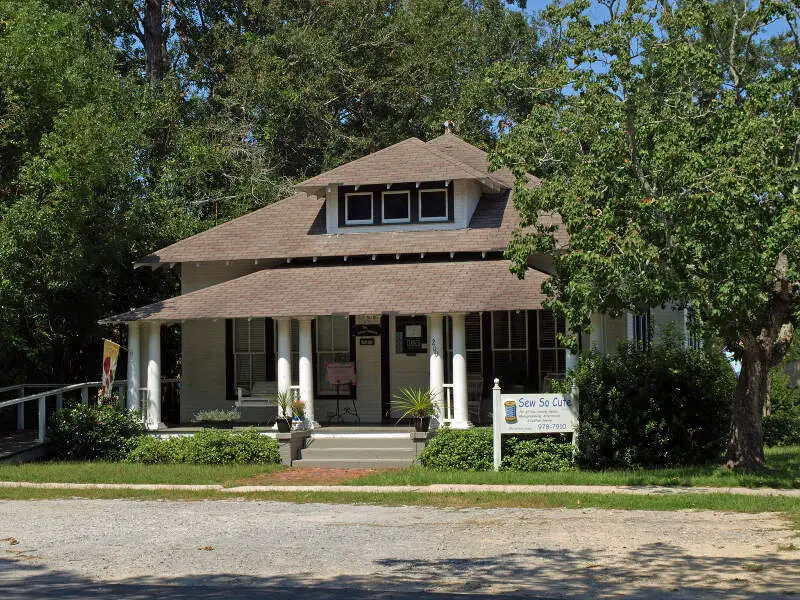
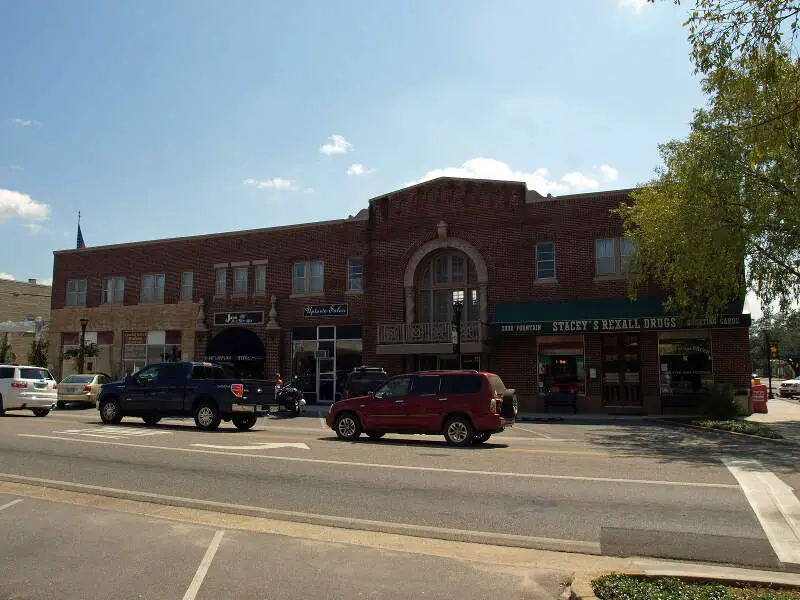
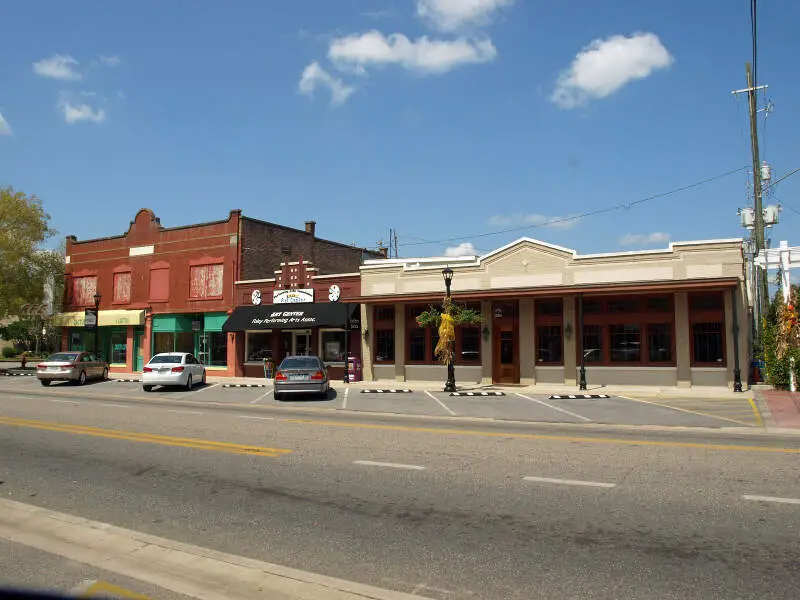
Foley, AL Photos

Rankings for Foley in Alabama


Locations Around Foley
Map Of Foley, AL
Best Places Around Foley
Gonzalez, FL
Population 13,861
Pace, FL
Population 25,630
Whitfield, PA
Population 5,346
Navarre, FL
Population 38,988
Bellview, FL
Population 25,051
Pensacola, FL
Population 54,011
Myrtle Grove, FL
Population 16,637
Ferry Pass, FL
Population 30,467
Ensley, FL
Population 23,036
Prichard, AL
Population 19,121
Foley Demographics And Statistics
Population over time in Foley
The current population in Foley is 22,330. The population has increased 64.6% from 2010.
| Year | Population | % Change |
|---|---|---|
| 2023 | 22,330 | 5.8% |
| 2022 | 21,113 | 4.7% |
| 2021 | 20,170 | 4.3% |
| 2020 | 19,337 | 4.3% |
| 2019 | 18,533 | 4.0% |
| 2018 | 17,818 | 2.9% |
| 2017 | 17,315 | 3.4% |
| 2016 | 16,741 | 2.4% |
| 2015 | 16,345 | 5.9% |
| 2014 | 15,428 | 2.7% |
| 2013 | 15,019 | 2.8% |
| 2012 | 14,603 | 3.6% |
| 2011 | 14,099 | 3.9% |
| 2010 | 13,570 | - |
Race / Ethnicity in Foley
Foley is:
77.0% White with 17,196 White residents.
4.6% African American with 1,022 African American residents.
0.0% American Indian with 0 American Indian residents.
2.3% Asian with 516 Asian residents.
0.0% Hawaiian with 0 Hawaiian residents.
2.3% Other with 507 Other residents.
3.2% Two Or More with 721 Two Or More residents.
10.6% Hispanic with 2,368 Hispanic residents.
| Race | Foley | AL | USA |
|---|---|---|---|
| White | 77.0% | 63.8% | 58.2% |
| African American | 4.6% | 25.9% | 12.0% |
| American Indian | 0.0% | 0.3% | 0.5% |
| Asian | 2.3% | 1.4% | 5.7% |
| Hawaiian | 0.0% | 0.0% | 0.2% |
| Other | 2.3% | 0.3% | 0.5% |
| Two Or More | 3.2% | 2.9% | 3.9% |
| Hispanic | 10.6% | 5.4% | 19.0% |
Gender in Foley
Foley is 52.3% female with 11,680 female residents.
Foley is 47.7% male with 10,650 male residents.
| Gender | Foley | AL | USA |
|---|---|---|---|
| Female | 52.3% | 51.5% | 50.5% |
| Male | 47.7% | 48.5% | 49.5% |
Highest level of educational attainment in Foley for adults over 25
5.0% of adults in Foley completed < 9th grade.
7.0% of adults in Foley completed 9-12th grade.
35.0% of adults in Foley completed high school / ged.
20.0% of adults in Foley completed some college.
7.0% of adults in Foley completed associate's degree.
18.0% of adults in Foley completed bachelor's degree.
6.0% of adults in Foley completed master's degree.
1.0% of adults in Foley completed professional degree.
1.0% of adults in Foley completed doctorate degree.
| Education | Foley | AL | USA |
|---|---|---|---|
| < 9th Grade | 5.0% | 4.0% | 5.0% |
| 9-12th Grade | 7.0% | 8.0% | 6.0% |
| High School / GED | 35.0% | 30.0% | 26.0% |
| Some College | 20.0% | 21.0% | 19.0% |
| Associate's Degree | 7.0% | 9.0% | 9.0% |
| Bachelor's Degree | 18.0% | 17.0% | 21.0% |
| Master's Degree | 6.0% | 8.0% | 10.0% |
| Professional Degree | 1.0% | 2.0% | 2.0% |
| Doctorate Degree | 1.0% | 1.0% | 2.0% |
Household Income For Foley, Alabama
4.3% of households in Foley earn Less than $10,000.
5.2% of households in Foley earn $10,000 to $14,999.
9.1% of households in Foley earn $15,000 to $24,999.
6.9% of households in Foley earn $25,000 to $34,999.
9.5% of households in Foley earn $35,000 to $49,999.
19.3% of households in Foley earn $50,000 to $74,999.
19.2% of households in Foley earn $75,000 to $99,999.
14.0% of households in Foley earn $100,000 to $149,999.
7.5% of households in Foley earn $150,000 to $199,999.
5.1% of households in Foley earn $200,000 or more.
| Income | Foley | AL | USA |
|---|---|---|---|
| Less than $10,000 | 4.3% | 6.3% | 4.9% |
| $10,000 to $14,999 | 5.2% | 5.0% | 3.6% |
| $15,000 to $24,999 | 9.1% | 9.2% | 6.6% |
| $25,000 to $34,999 | 6.9% | 8.7% | 6.8% |
| $35,000 to $49,999 | 9.5% | 12.2% | 10.4% |
| $50,000 to $74,999 | 19.3% | 16.8% | 15.7% |
| $75,000 to $99,999 | 19.2% | 12.5% | 12.7% |
| $100,000 to $149,999 | 14.0% | 15.2% | 17.4% |
| $150,000 to $199,999 | 7.5% | 7.1% | 9.3% |
| $200,000 or more | 5.1% | 7.2% | 12.6% |


