Sheridan, AR
Demographics And Statistics
Living In Sheridan, Arkansas Summary
Life in Sheridan research summary. HomeSnacks has been using Saturday Night Science to research the quality of life in Sheridan over the past nine years using Census, FBI, Zillow, and other primary data sources. Based on the most recently available data, we found the following about life in Sheridan:
The population in Sheridan is 5,063.
The median home value in Sheridan is $216,636.
The median income in Sheridan is $61,025.
The median rent in Sheridan is $757.
The unemployment rate in Sheridan is 3.6%.
The poverty rate in Sheridan is 16.3%.
The average high in Sheridan is 73.7° and the average low is 50.3°.
Table Of Contents
Sheridan SnackAbility
Overall SnackAbility
Sheridan, AR Crime Report
Crime in Sheridan summary. We use data from the FBI to determine the crime rates in Sheridan. Key points include:
There were 87 total crimes in Sheridan in the last reporting year.
The overall crime rate per 100,000 people in Sheridan is 1,651.5 / 100k people.
The violent crime rate per 100,000 people in Sheridan is 531.5 / 100k people.
The property crime rate per 100,000 people in Sheridan is 1,120.0 / 100k people.
Overall, crime in Sheridan is -22.07% below the national average.
Total Crimes
Below National Average
Crime In Sheridan Comparison Table
| Statistic | Count Raw |
Sheridan / 100k People |
Arkansas / 100k People |
National / 100k People |
|---|---|---|---|---|
| Total Crimes Per 100K | 87 | 1,651.5 | 2,508.9 | 2,119.2 |
| Violent Crime | 28 | 531.5 | 579.4 | 359.0 |
| Murder | 0 | 0.0 | 7.3 | 5.0 |
| Robbery | 1 | 19.0 | 38.6 | 61.0 |
| Aggravated Assault | 22 | 417.6 | 463.5 | 256.0 |
| Property Crime | 59 | 1,120.0 | 1,929.5 | 1,760.0 |
| Burglary | 8 | 151.9 | 352.7 | 229.0 |
| Larceny | 48 | 911.2 | 1,400.0 | 1,272.0 |
| Car Theft | 3 | 56.9 | 176.8 | 259.0 |
Sheridan, AR Weather
The average high in Sheridan is 73.7° and the average low is 50.3°.
There are 70.9 days of precipitation each year.
Expect an average of 53.2 inches of precipitation each year with 2.5 inches of snow.
| Stat | Sheridan |
|---|---|
| Average Annual High | 73.7 |
| Average Annual Low | 50.3 |
| Annual Precipitation Days | 70.9 |
| Average Annual Precipitation | 53.2 |
| Average Annual Snowfall | 2.5 |
Average High
Days of Rain
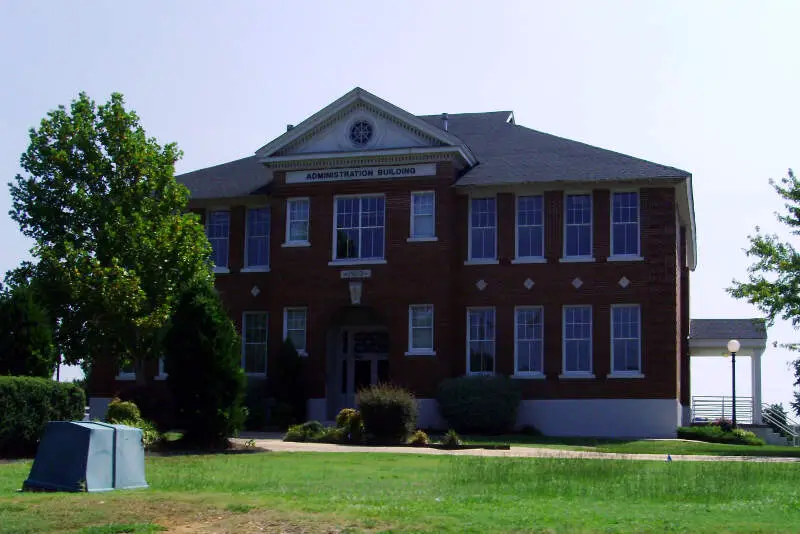
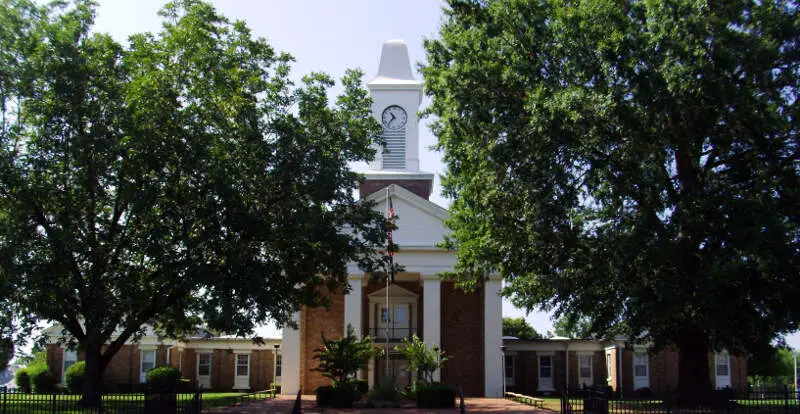
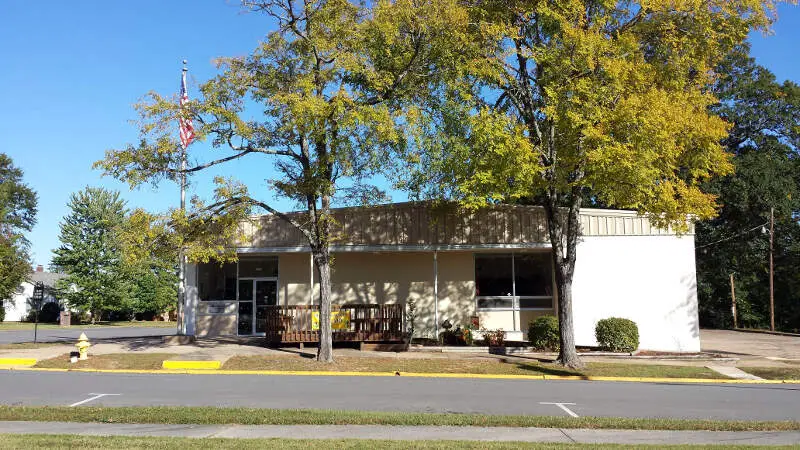
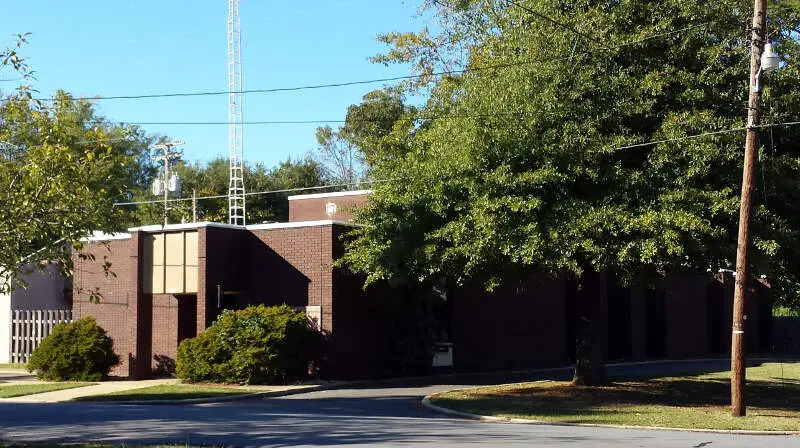
Sheridan, AR Photos

Rankings for Sheridan in Arkansas


Locations Around Sheridan
Map Of Sheridan, AR
Best Places Around Sheridan
Maumelle, AR
Population 19,286
Sherwood, AR
Population 32,915
Benton, AR
Population 35,954
Little Rock, AR
Population 202,739
Bryant, AR
Population 21,125
North Little Rock, AR
Population 64,504
Jacksonville, AR
Population 29,285
Malvern, AR
Population 10,938
East End, AR
Population 6,344
White Hall, AR
Population 5,520
Sheridan Demographics And Statistics
Population over time in Sheridan
The current population in Sheridan is 5,063. The population has increased 7.9% from 2010.
| Year | Population | % Change |
|---|---|---|
| 2023 | 5,063 | 1.2% |
| 2022 | 5,002 | 1.9% |
| 2021 | 4,908 | -0.2% |
| 2020 | 4,919 | 1.5% |
| 2019 | 4,846 | -0.2% |
| 2018 | 4,857 | 0.1% |
| 2017 | 4,850 | 1.2% |
| 2016 | 4,794 | 0.7% |
| 2015 | 4,763 | 0.3% |
| 2014 | 4,749 | 0.8% |
| 2013 | 4,713 | 0.5% |
| 2012 | 4,691 | 0.6% |
| 2011 | 4,662 | -0.6% |
| 2010 | 4,691 | - |
Race / Ethnicity in Sheridan
Sheridan is:
90.9% White with 4,604 White residents.
3.9% African American with 197 African American residents.
0.1% American Indian with 6 American Indian residents.
0.0% Asian with 0 Asian residents.
0.0% Hawaiian with 0 Hawaiian residents.
1.6% Other with 83 Other residents.
1.3% Two Or More with 65 Two Or More residents.
2.1% Hispanic with 108 Hispanic residents.
| Race | Sheridan | AR | USA |
|---|---|---|---|
| White | 90.9% | 68.4% | 58.2% |
| African American | 3.9% | 14.8% | 12.0% |
| American Indian | 0.1% | 0.4% | 0.5% |
| Asian | 0.0% | 1.5% | 5.7% |
| Hawaiian | 0.0% | 0.4% | 0.2% |
| Other | 1.6% | 0.3% | 0.5% |
| Two Or More | 1.3% | 5.5% | 3.9% |
| Hispanic | 2.1% | 8.8% | 19.0% |
Gender in Sheridan
Sheridan is 54.7% female with 2,769 female residents.
Sheridan is 45.3% male with 2,294 male residents.
| Gender | Sheridan | AR | USA |
|---|---|---|---|
| Female | 54.7% | 50.7% | 50.5% |
| Male | 45.3% | 49.3% | 49.5% |
Highest level of educational attainment in Sheridan for adults over 25
4.0% of adults in Sheridan completed < 9th grade.
5.0% of adults in Sheridan completed 9-12th grade.
40.0% of adults in Sheridan completed high school / ged.
22.0% of adults in Sheridan completed some college.
5.0% of adults in Sheridan completed associate's degree.
17.0% of adults in Sheridan completed bachelor's degree.
4.0% of adults in Sheridan completed master's degree.
3.0% of adults in Sheridan completed professional degree.
0.0% of adults in Sheridan completed doctorate degree.
| Education | Sheridan | AR | USA |
|---|---|---|---|
| < 9th Grade | 4.0% | 5.0% | 5.0% |
| 9-12th Grade | 5.0% | 7.0% | 6.0% |
| High School / GED | 40.0% | 34.0% | 26.0% |
| Some College | 22.0% | 21.0% | 19.0% |
| Associate's Degree | 5.0% | 8.0% | 9.0% |
| Bachelor's Degree | 17.0% | 16.0% | 21.0% |
| Master's Degree | 4.0% | 7.0% | 10.0% |
| Professional Degree | 3.0% | 1.0% | 2.0% |
| Doctorate Degree | 0.0% | 1.0% | 2.0% |
Household Income For Sheridan, Arkansas
1.4% of households in Sheridan earn Less than $10,000.
3.6% of households in Sheridan earn $10,000 to $14,999.
21.3% of households in Sheridan earn $15,000 to $24,999.
10.6% of households in Sheridan earn $25,000 to $34,999.
5.6% of households in Sheridan earn $35,000 to $49,999.
17.6% of households in Sheridan earn $50,000 to $74,999.
17.4% of households in Sheridan earn $75,000 to $99,999.
16.2% of households in Sheridan earn $100,000 to $149,999.
2.7% of households in Sheridan earn $150,000 to $199,999.
3.6% of households in Sheridan earn $200,000 or more.
| Income | Sheridan | AR | USA |
|---|---|---|---|
| Less than $10,000 | 1.4% | 6.0% | 4.9% |
| $10,000 to $14,999 | 3.6% | 5.0% | 3.6% |
| $15,000 to $24,999 | 21.3% | 9.5% | 6.6% |
| $25,000 to $34,999 | 10.6% | 9.4% | 6.8% |
| $35,000 to $49,999 | 5.6% | 13.3% | 10.4% |
| $50,000 to $74,999 | 17.6% | 17.5% | 15.7% |
| $75,000 to $99,999 | 17.4% | 12.6% | 12.7% |
| $100,000 to $149,999 | 16.2% | 14.4% | 17.4% |
| $150,000 to $199,999 | 2.7% | 5.9% | 9.3% |
| $200,000 or more | 3.6% | 6.3% | 12.6% |


