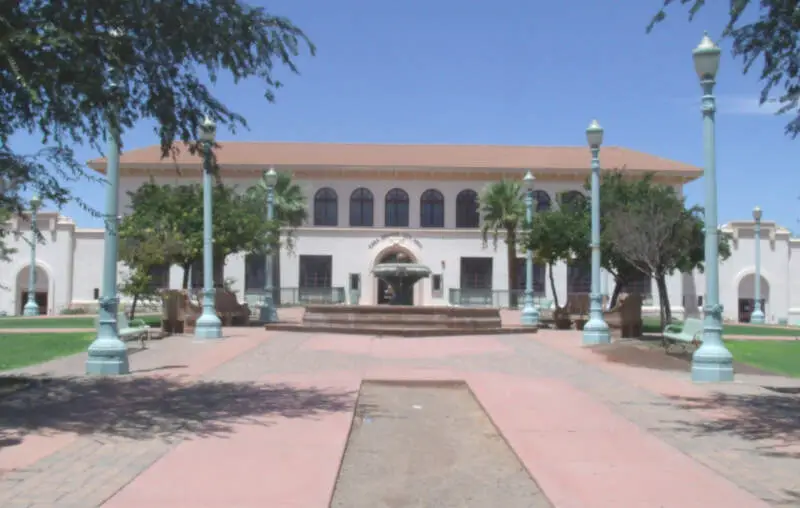
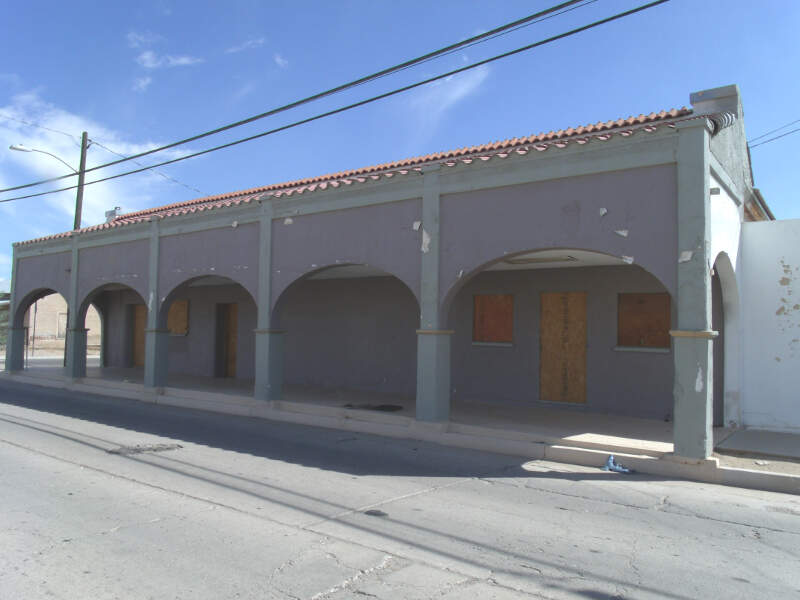
Casa Grande, AZ
Demographics And Statistics
Living In Casa Grande, Arizona Summary
Life in Casa Grande research summary. HomeSnacks has been using Saturday Night Science to research the quality of life in Casa Grande over the past nine years using Census, FBI, Zillow, and other primary data sources. Based on the most recently available data, we found the following about life in Casa Grande:
The population in Casa Grande is 57,590.
The median home value in Casa Grande is $319,602.
The median income in Casa Grande is $66,354.
The cost of living in Casa Grande is 107 which is 1.1x higher than the national average.
The median rent in Casa Grande is $1,315.
The unemployment rate in Casa Grande is 6.4%.
The poverty rate in Casa Grande is 14.1%.
The average high in Casa Grande is 85.1° and the average low is 55.8°.
Casa Grande SnackAbility
Overall SnackAbility
Casa Grande, AZ Crime Report
Crime in Casa Grande summary. We use data from the FBI to determine the crime rates in Casa Grande. Key points include:
There were 1,305 total crimes in Casa Grande in the last reporting year.
The overall crime rate per 100,000 people in Casa Grande is 1,938.6 / 100k people.
The violent crime rate per 100,000 people in Casa Grande is 410.0 / 100k people.
The property crime rate per 100,000 people in Casa Grande is 1,528.6 / 100k people.
Overall, crime in Casa Grande is -8.52% below the national average.
Total Crimes
Below National Average
Crime In Casa Grande Comparison Table
| Statistic | Count Raw |
Casa Grande / 100k People |
Arizona / 100k People |
National / 100k People |
|---|---|---|---|---|
| Total Crimes Per 100K | 1,305 | 1,938.6 | 2,214.0 | 2,119.2 |
| Violent Crime | 276 | 410.0 | 421.9 | 359.0 |
| Murder | 4 | 5.9 | 4.9 | 5.0 |
| Robbery | 15 | 22.3 | 64.6 | 61.0 |
| Aggravated Assault | 227 | 337.2 | 312.4 | 256.0 |
| Property Crime | 1,029 | 1,528.6 | 1,792.1 | 1,760.0 |
| Burglary | 173 | 257.0 | 217.8 | 229.0 |
| Larceny | 689 | 1,023.5 | 1,329.9 | 1,272.0 |
| Car Theft | 167 | 248.1 | 244.4 | 259.0 |
Casa Grande, AZ Cost Of Living
Cost of living in Casa Grande summary. We use data on the cost of living to determine how expensive it is to live in Casa Grande. Real estate prices drive most of the variance in cost of living around Arizona. Key points include:
The cost of living in Casa Grande is 107 with 100 being average.
The cost of living in Casa Grande is 1.1x higher than the national average.
The median home value in Casa Grande is $319,602.
The median income in Casa Grande is $66,354.
Casa Grande's Overall Cost Of Living
Higher Than The National Average
Cost Of Living In Casa Grande Comparison Table
| Living Expense | Casa Grande | Arizona | National Average | |
|---|---|---|---|---|
| Overall | 107 | 102 | 100 | |
| Services | 115 | 102 | 100 | |
| Groceries | 102 | 103 | 100 | |
| Health | 99 | 95 | 100 | |
| Housing | 93 | 99 | 100 | |
| Transportation | 123 | 107 | 100 | |
| Utilities | 97 | 96 | 100 | |
Casa Grande, AZ Weather
The average high in Casa Grande is 85.1° and the average low is 55.8°.
There are 24.0 days of precipitation each year.
Expect an average of 10.6 inches of precipitation each year with 0.7 inches of snow.
| Stat | Casa Grande |
|---|---|
| Average Annual High | 85.1 |
| Average Annual Low | 55.8 |
| Annual Precipitation Days | 24.0 |
| Average Annual Precipitation | 10.6 |
| Average Annual Snowfall | 0.7 |
Average High
Days of Rain
Casa Grande, AZ Photos
Rankings for Casa Grande in Arizona


Locations Around Casa Grande
Map Of Casa Grande, AZ
Best Places Around Casa Grande
Santa Cruz, CA
Population 60,953
Gilbert, AZ
Population 271,118
Fountain Hills, AZ
Population 23,768
Chandler, AZ
Population 278,123
Sun Lakes, AZ
Population 14,079
Marana, AZ
Population 54,487
Queen Creek, AZ
Population 66,369
Tempe, AZ
Population 186,419
Maricopa, AZ
Population 62,986
Gold Canyon, AZ
Population 12,488
Casa Grande Demographics And Statistics
Population over time in Casa Grande
The current population in Casa Grande is 57,590. The population has increased 33.8% from 2010.
| Year | Population | % Change |
|---|---|---|
| 2023 | 57,590 | 4.4% |
| 2022 | 55,186 | 3.2% |
| 2021 | 53,488 | -6.7% |
| 2020 | 57,318 | 3.0% |
| 2019 | 55,653 | 2.5% |
| 2018 | 54,316 | 3.5% |
| 2017 | 52,501 | 1.8% |
| 2016 | 51,571 | 3.6% |
| 2015 | 49,796 | -1.0% |
| 2014 | 50,316 | 2.9% |
| 2013 | 48,908 | 2.6% |
| 2012 | 47,675 | 4.1% |
| 2011 | 45,787 | 6.4% |
| 2010 | 43,050 | - |
Race / Ethnicity in Casa Grande
Casa Grande is:
43.4% White with 24,980 White residents.
4.5% African American with 2,569 African American residents.
2.3% American Indian with 1,310 American Indian residents.
1.7% Asian with 970 Asian residents.
0.3% Hawaiian with 146 Hawaiian residents.
0.4% Other with 213 Other residents.
4.5% Two Or More with 2,563 Two Or More residents.
43.1% Hispanic with 24,839 Hispanic residents.
| Race | Casa Grande | AZ | USA |
|---|---|---|---|
| White | 43.4% | 53.4% | 58.2% |
| African American | 4.5% | 4.4% | 12.0% |
| American Indian | 2.3% | 3.4% | 0.5% |
| Asian | 1.7% | 3.3% | 5.7% |
| Hawaiian | 0.3% | 0.2% | 0.2% |
| Other | 0.4% | 0.4% | 0.5% |
| Two Or More | 4.5% | 3.9% | 3.9% |
| Hispanic | 43.1% | 31.0% | 19.0% |
Gender in Casa Grande
Casa Grande is 48.9% female with 28,175 female residents.
Casa Grande is 51.1% male with 29,415 male residents.
| Gender | Casa Grande | AZ | USA |
|---|---|---|---|
| Female | 48.9% | 50.1% | 50.5% |
| Male | 51.1% | 49.9% | 49.5% |
Highest level of educational attainment in Casa Grande for adults over 25
5.0% of adults in Casa Grande completed < 9th grade.
7.0% of adults in Casa Grande completed 9-12th grade.
34.0% of adults in Casa Grande completed high school / ged.
24.0% of adults in Casa Grande completed some college.
10.0% of adults in Casa Grande completed associate's degree.
13.0% of adults in Casa Grande completed bachelor's degree.
6.0% of adults in Casa Grande completed master's degree.
1.0% of adults in Casa Grande completed professional degree.
0.0% of adults in Casa Grande completed doctorate degree.
| Education | Casa Grande | AZ | USA |
|---|---|---|---|
| < 9th Grade | 5.0% | 6.0% | 5.0% |
| 9-12th Grade | 7.0% | 6.0% | 6.0% |
| High School / GED | 34.0% | 23.0% | 26.0% |
| Some College | 24.0% | 24.0% | 19.0% |
| Associate's Degree | 10.0% | 9.0% | 9.0% |
| Bachelor's Degree | 13.0% | 20.0% | 21.0% |
| Master's Degree | 6.0% | 9.0% | 10.0% |
| Professional Degree | 1.0% | 2.0% | 2.0% |
| Doctorate Degree | 0.0% | 1.0% | 2.0% |
Household Income For Casa Grande, Arizona
6.4% of households in Casa Grande earn Less than $10,000.
2.5% of households in Casa Grande earn $10,000 to $14,999.
5.0% of households in Casa Grande earn $15,000 to $24,999.
8.9% of households in Casa Grande earn $25,000 to $34,999.
13.6% of households in Casa Grande earn $35,000 to $49,999.
20.2% of households in Casa Grande earn $50,000 to $74,999.
13.5% of households in Casa Grande earn $75,000 to $99,999.
17.3% of households in Casa Grande earn $100,000 to $149,999.
7.8% of households in Casa Grande earn $150,000 to $199,999.
5.0% of households in Casa Grande earn $200,000 or more.
| Income | Casa Grande | AZ | USA |
|---|---|---|---|
| Less than $10,000 | 6.4% | 4.9% | 4.9% |
| $10,000 to $14,999 | 2.5% | 2.9% | 3.6% |
| $15,000 to $24,999 | 5.0% | 6.1% | 6.6% |
| $25,000 to $34,999 | 8.9% | 6.9% | 6.8% |
| $35,000 to $49,999 | 13.6% | 10.9% | 10.4% |
| $50,000 to $74,999 | 20.2% | 17.0% | 15.7% |
| $75,000 to $99,999 | 13.5% | 13.6% | 12.7% |
| $100,000 to $149,999 | 17.3% | 18.1% | 17.4% |
| $150,000 to $199,999 | 7.8% | 9.0% | 9.3% |
| $200,000 or more | 5.0% | 10.6% | 12.6% |


