Are you looking for love in North Carolina?
Or are you just hoping to hook up with a hot North Carolinian?
Either way, we’ve got you covered here.
If you live in North Carolina, there’s a pretty good chance there are a lot of singles in your area. The Tar Heel State has plenty of people over 18 who aren’t married or in a serious relationship.
That’s great news for people who are single and looking to mingle.
So, where are the best cities for singles in North Carolina? We used Saturday Night Science to find out.

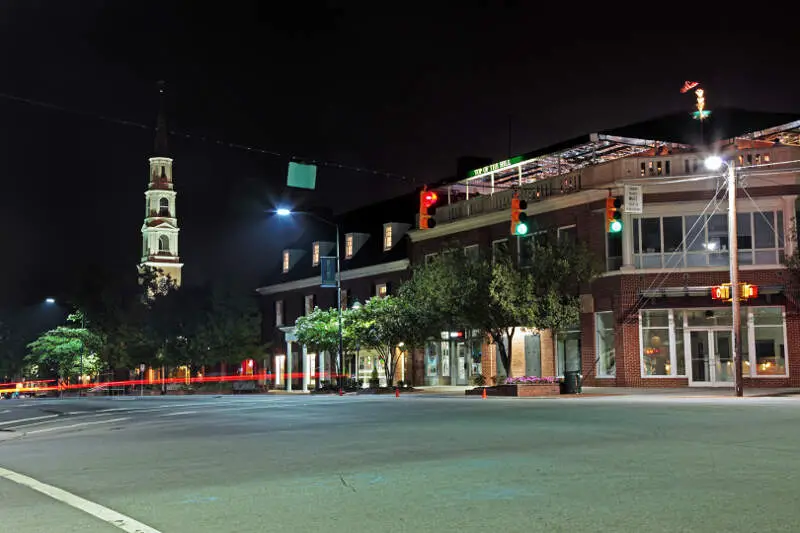
33.4 median age · 7.0% married households
Carrboro is a town in Orange County in the U.S. state of North Carolina. The population was 19,582 at the 2010 census. The town, which is part of the Raleigh-Durham-Chapel Hill combined statistical area, was named after North Carolina industrialist Julian Shakespeare Carr.
Data | Crime | Cost of living | Movers

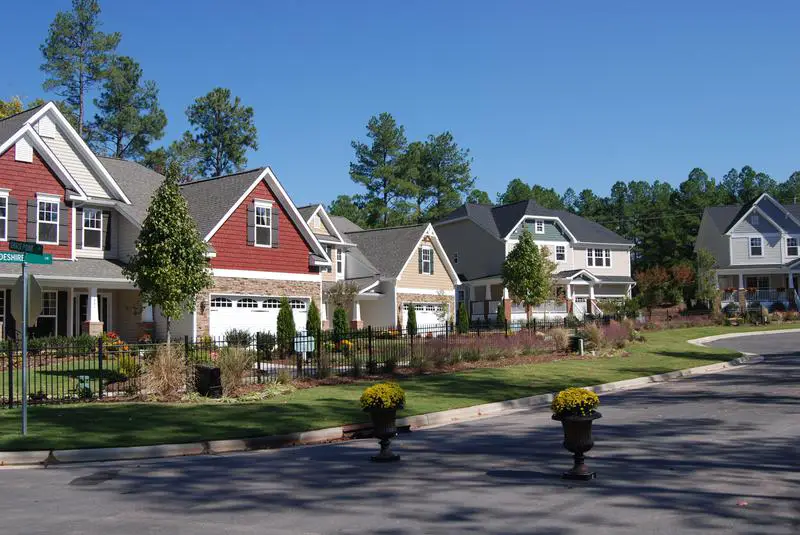
21.3 median age · 6.0% married households
Data | Crime | Cost of living | Movers
25.8 median age · 6.0% married households
Chapel Hill is a town in Orange and Durham counties in the U.S. state of North Carolina. Its population was 57,233 in the 2010 census, making Chapel Hill the 15th-largest city in the state. Chapel Hill, Durham, and the state capital, Raleigh, make up the corners of the Research Triangle, with a total population of 1,998,808.
Data | Crime | Cost of living | Movers

34.7 median age · 12.0% married households
Raleigh is the capital of the state of North Carolina and the seat of Wake County in the United States. Raleigh is the second largest city in the state of North Carolina, behind only Charlotte. Raleigh is known as the “City of Oaks” for its many oak trees, which line the streets in the heart of the city. The city covers a land area of 142.8 square miles. The U.S. Census Bureau estimated the city’s population as 451,066 as of July 1, 2015. It is one of the fastest-growing cities in the country. The city of Raleigh is named after Sir Walter Raleigh, who established the lost Roanoke Colony in present-day Dare County.
Data | Crime | Cost of living | Movers

34.5 median age · 9.0% married households
Charlotte is the most populous city in the U.S. state of North Carolina. It is the county seat of Mecklenburg County. In 2016, the U.S.Census Bureau estimated the population was 842,051, making it the 17th-most populous city in the United States. The Charlotte metropolitan area ranks 22nd-largest in the U.S., and had a 2016 population of 2,474,314. The Charlotte metropolitan area is part of a sixteen-county market region or combined statistical area with a 2016 U.S.Census population estimate of 2,632,249. Between 2004 and 2014, Charlotte was ranked as the country’s fastest growing metro area, with 888,000 new residents. Based on U.S. Census data from 2005 to 2015, it also tops the 50 largest U.S. cities as the millennial hub. It is the second-largest city in the southeastern United States, just behind Jacksonville, Florida. It is the third-fastest growing major city in the United States. It is listed as a “gamma-minus” global city by the Globalization and World Cities Research Network. Residents are referred to as “Charlotteans”.
Data | Crime | Cost of living | Movers
35.2 median age · 5.0% married households
Morrisville is a town located in both Wake and Durham counties of the U.S. state of North Carolina. The population was 18,576 at the 2010 census. The U.S. Census Bureau estimates the town’s population to be 21,932 as of July 1, 2013. Morrisville is part of the Research Triangle metropolitan region. The regional name originated after the 1959 creation of the Research Triangle Park, located midway between the cities of Raleigh and Durham. The Research Triangle region encompasses the U.S. Census Bureau’s Combined Statistical Area of Raleigh-Durham-Cary. The estimated population of the Raleigh-Durham-Cary CSA was 1,565,223 as of July 1, 2006, with the Raleigh-Cary Metropolitan Statistical Area portion estimated at 994,551 residents. The U.S. headquarters of Chinese multinational Lenovo are located in the municipal limits.
Data | Crime | Cost of living | Movers

35.1 median age · 11.0% married households
Durham is a city in the U.S. state of North Carolina. It is the county seat of Durham County. The U.S. Census Bureau estimated the city’s population to be 251,893 as of July 1, 2014, making it the 4th-most populous city in North Carolina, and the 78th-most populous city in the United States. Durham is the core of the four-county Durham-Chapel Hill Metropolitan Area, which has a population of 542,710 as of U.S. Census 2014 Population Estimates. The US Office of Management and Budget also includes Durham as a part of the Raleigh-Durham-Chapel Hill Combined Statistical Area, which has a population of 2,037,430 as of U.S. Census 2014 Population Estimates.
Data | Crime | Cost of living | Movers

30.6 median age · 11.0% married households
Fayetteville is a city in Cumberland County, North Carolina, United States. It is the county seat of Cumberland County, and is best known as the home of Fort Bragg, a major U.S. Army installation northwest of the city.
Data | Crime | Cost of living | Movers
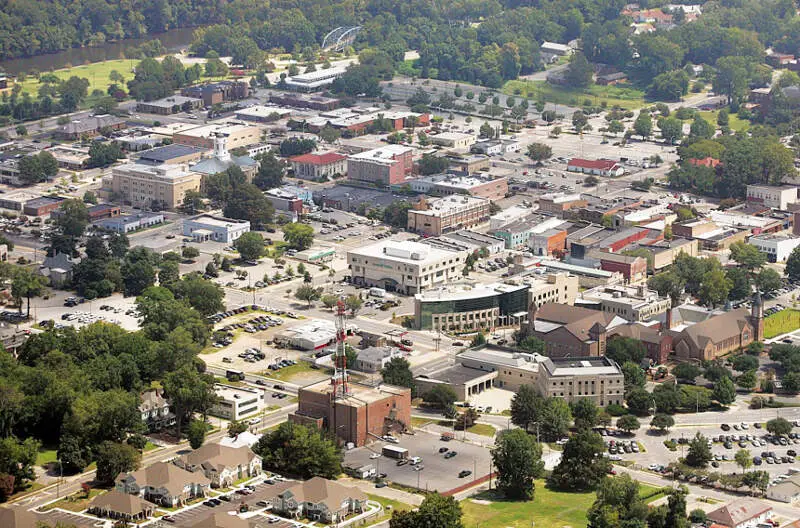
27.3 median age · 13.0% married households
Greenville is the county seat and the most populous city in Pitt County, North Carolina, United States. The principal city of the Greenville metropolitan area, and the 10th-most populous city in the U.S. state of North Carolina. Greenville is the health, entertainment, and educational hub of North Carolina’s Tidewater and Coastal Plain. The city’s official population as of the 2013 United States census estimate is 89,130 residents while the Greenville Metropolitan Area includes 174,263 people. In January 2008 and January 2010, Greenville was named one of the nation’s “100 Best Communities for Young People” by the America’s Promise Alliance. In June 2012, Greenville was ranked in the top ten of the nation’s “Best Small Places For Business And Careers” by Forbes magazine. In 2010 Greenville was ranked twenty-fourth in mid-city business growth and development by Forbes Magazine.
Data | Crime | Cost of living | Movers
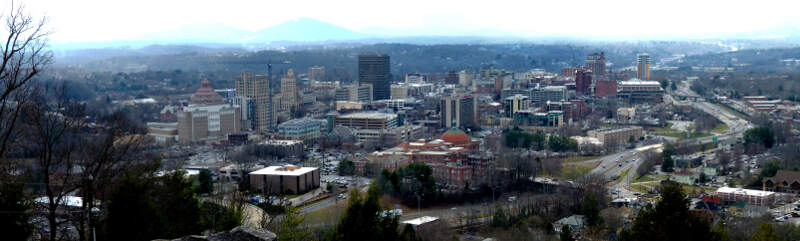
40.7 median age · 10.0% married households
Asheville is a city and the county seat of Buncombe County, North Carolina, United States. It is the largest city in Western North Carolina, and the 12th-most populous city in the U.S. state of North Carolina. The city’s population was 89,121 according to the 2016 estimates. It is the principal city in the four-county Asheville metropolitan area, with a population of 424,858 in 2010. Asheville is home to the United States National Climatic Data Center, the world’s largest active archive of weather data.
Data | Crime | Cost of living | Movers
The receipts
Compare the top ten
Pick a metric. The bars rescale. The red line is North Carolina’s statewide median.
On the map
Where North Carolina’s singles cluster
Saturday Night Science
Methodology: How do you determine which city is best for singles in North Carolina anyways?
To give you the places in North Carolina which are best for singles to find one another, we used Saturday Night Science to look at a handful of metrics. Of course, we want to measure the type of people who live in each city and make some assumptions about what single people like.
So we researched the internet for a database that contains all that information.
We threw a lot of criteria at this one to get the best, most complete results possible. Using the 2020-2024 American Community Survey Census data produced for the state of North Carolina, we looked at every single city in the state. We paid particular attention to:
- Population density
- % of population that’s male vs. female (closer to a 50-50 ratio is better)
- % of households with kids
- Median age
- Number of unmarried people in each city
We then gave each city a “Singles Score.”
The higher the score, the better the city is for singles to find one another. We also limited our results to cities with over 10,000 people. For North Carolina, that meant a total of 89 cities.
We updated this article for 2026. This is our eleventh time ranking the best cities for singles in North Carolina.
Read on to see why Carrboro is the talk of the town while Summerfield is probably a bit on the bland side.
The full plate
Best Cities For Singles In North Carolina
Click any column to sort. Search by city name.
| Rank | City | Singles Score | Population | Median Age | % Married Households | % Households w/ Kids |
|---|---|---|---|---|---|---|
| 1 | Carrboro | 8.60 | 21,204 | 33.4 | 7.0% | 26.4% |
| 2 | Boone | 9.50 | 20,032 | 21.3 | 6.0% | 9.8% |
| 3 | Chapel Hill | 16.50 | 61,607 | 25.8 | 6.0% | 23.8% |
| 4 | Raleigh | 18.80 | 481,031 | 34.7 | 12.0% | 26.3% |
| 5 | Charlotte | 19.90 | 903,844 | 34.5 | 9.0% | 28.6% |
| 6 | Morrisville | 22.80 | 31,422 | 35.2 | 5.0% | 36.9% |
| 7 | Durham | 24.40 | 291,467 | 35.1 | 11.0% | 24.9% |
| 8 | Fayetteville | 25.80 | 210,815 | 30.6 | 11.0% | 29.7% |
| 9 | Greenville | 26.40 | 92,857 | 27.3 | 13.0% | 24.5% |
| 10 | Asheville | 27.40 | 94,535 | 40.7 | 10.0% | 20.5% |
| 11 | Wilmington | 29.20 | 120,805 | 37.1 | 13.0% | 18.8% |
| 12 | Garner | 29.40 | 34,473 | 37.7 | 17.0% | 27.1% |
| 13 | Greensboro | 30.20 | 301,198 | 34.3 | 13.0% | 28.4% |
| 14 | Mooresville | 31.10 | 52,381 | 35.8 | 10.0% | 35.4% |
| 15 | Davidson | 31.60 | 15,660 | 41.9 | 8.0% | 30.8% |
| 16 | Apex | 31.70 | 70,630 | 36.4 | 10.0% | 47.7% |
| 17 | Cary | 32.10 | 179,306 | 40.2 | 9.0% | 34.8% |
| 18 | Hope Mills | 32.20 | 17,939 | 34.0 | 16.0% | 36.3% |
| 19 | Elon | 32.40 | 11,032 | 21.2 | 14.0% | 28.4% |
| 20 | Salisbury | 34.00 | 35,825 | 36.5 | 19.0% | 28.8% |
| 21 | High Point | 34.90 | 116,245 | 37.7 | 16.0% | 29.2% |
| 22 | Monroe | 35.70 | 36,759 | 35.5 | 12.0% | 34.3% |
| 23 | Holly Springs | 35.80 | 45,248 | 36.5 | 11.0% | 51.4% |
| 24 | Spring Lake | 36.30 | 11,573 | 26.1 | 7.0% | 33.1% |
| 25 | Winston-Salem | 37.00 | 252,037 | 35.9 | 16.0% | 28.0% |
| 26 | Indian Trail | 38.30 | 42,036 | 36.2 | 14.0% | 43.9% |
| 27 | Goldsboro | 38.70 | 34,383 | 36.8 | 18.0% | 29.2% |
| 28 | Jacksonville | 39.10 | 71,279 | 23.4 | 6.0% | 34.2% |
| 29 | Asheboro | 39.40 | 27,580 | 37.3 | 18.0% | 30.5% |
| 30 | Cornelius | 39.60 | 32,783 | 44.0 | 8.0% | 29.2% |
| 31 | Matthews | 39.70 | 30,577 | 40.1 | 14.0% | 28.3% |
| 32 | Pinehurst | 40.40 | 18,256 | 60.6 | 13.0% | 16.7% |
| 33 | Hendersonville | 40.80 | 15,408 | 53.2 | 11.0% | 15.5% |
| 34 | Clayton | 42.80 | 29,320 | 33.0 | 14.0% | 34.4% |
| 35 | Kannapolis | 43.00 | 57,890 | 36.9 | 19.0% | 32.3% |
| 36 | Concord | 43.10 | 108,719 | 36.5 | 15.0% | 38.9% |
| 37 | Wake Forest | 43.20 | 52,844 | 38.6 | 14.0% | 38.8% |
| 38 | Pineville | 43.20 | 11,055 | 33.4 | 6.0% | 31.1% |
| 39 | Burlington | 43.70 | 59,610 | 40.1 | 18.0% | 28.1% |
| 40 | Graham | 44.30 | 18,048 | 37.8 | 20.0% | 27.9% |
| 41 | Southern Pines | 44.40 | 16,420 | 38.7 | 13.0% | 23.0% |
| 42 | Sanford | 44.70 | 31,478 | 34.7 | 19.0% | 38.6% |
| 43 | Kernersville | 44.90 | 27,830 | 39.3 | 19.0% | 25.9% |
| 44 | Hickory | 45.20 | 44,258 | 37.5 | 20.0% | 29.0% |
| 45 | Knightdale | 45.20 | 20,214 | 33.6 | 18.0% | 41.5% |
| 46 | Fuquay-Varina | 46.40 | 40,485 | 37.0 | 14.0% | 40.2% |
| 47 | Huntersville | 46.70 | 63,969 | 40.1 | 11.0% | 36.1% |
| 48 | Havelock | 47.70 | 17,691 | 24.7 | 10.0% | 38.9% |
| 49 | Gastonia | 48.40 | 82,884 | 36.5 | 21.0% | 32.8% |
| 50 | Henderson | 48.80 | 14,885 | 37.7 | 17.0% | 29.3% |
| 51 | Clemmons | 49.00 | 21,871 | 41.8 | 21.0% | 30.5% |
| 52 | Leland | 49.60 | 29,607 | 47.3 | 14.0% | 22.2% |
| 53 | Waxhaw | 49.90 | 22,275 | 36.2 | 8.0% | 59.4% |
| 54 | Belmont | 50.40 | 15,546 | 39.4 | 17.0% | 25.1% |
| 55 | Winterville | 50.60 | 10,725 | 36.5 | 24.0% | 29.9% |
| 56 | Rocky Mount | 50.70 | 54,297 | 40.7 | 19.0% | 25.4% |
| 57 | Lexington | 50.80 | 19,690 | 36.7 | 16.0% | 29.6% |
| 58 | Statesville | 51.10 | 29,894 | 37.1 | 15.0% | 32.2% |
| 59 | Stallings | 51.30 | 16,886 | 40.8 | 18.0% | 31.6% |
| 60 | Waynesville | 51.30 | 10,502 | 46.0 | 19.0% | 20.0% |
| 61 | New Bern | 51.50 | 32,734 | 38.9 | 15.0% | 25.5% |
| 62 | Morganton | 51.90 | 17,646 | 37.8 | 20.0% | 29.0% |
| 63 | Lumberton | 53.20 | 18,859 | 34.6 | 18.0% | 34.7% |
| 64 | Thomasville | 54.40 | 27,321 | 38.3 | 27.0% | 32.1% |
| 65 | Eden | 54.50 | 15,356 | 36.8 | 22.0% | 28.9% |
| 66 | Smithfield | 54.60 | 12,116 | 44.9 | 20.0% | 25.6% |
| 67 | Kings Mountain | 54.60 | 12,039 | 37.2 | 24.0% | 28.7% |
| 68 | Roanoke Rapids | 55.20 | 14,856 | 40.3 | 29.0% | 29.5% |
| 69 | Lincolnton | 55.90 | 11,783 | 37.1 | 23.0% | 30.3% |
| 70 | Kinston | 56.60 | 19,505 | 42.9 | 17.0% | 26.6% |
| 71 | Wendell | 57.00 | 13,064 | 38.0 | 17.0% | 34.3% |
| 72 | Wilson | 57.10 | 48,370 | 39.5 | 24.0% | 30.8% |
| 73 | Newton | 58.10 | 13,333 | 38.2 | 23.0% | 31.0% |
| 74 | Mint Hill | 58.20 | 27,556 | 45.1 | 19.0% | 28.8% |
| 75 | Reidsville | 59.40 | 14,585 | 42.0 | 22.0% | 25.9% |
| 76 | Rolesville | 59.40 | 10,766 | 40.6 | 18.0% | 49.1% |
| 77 | Mebane | 59.60 | 19,538 | 38.5 | 17.0% | 35.0% |
| 78 | Laurinburg | 60.80 | 15,087 | 37.4 | 21.0% | 33.2% |
| 79 | Shelby | 61.10 | 22,100 | 39.3 | 25.0% | 27.6% |
| 80 | Archdale | 61.60 | 12,087 | 46.1 | 26.0% | 25.0% |
| 81 | Lenoir | 62.20 | 18,299 | 45.7 | 20.0% | 22.0% |
| 82 | Albemarle | 62.80 | 16,762 | 39.5 | 23.0% | 30.5% |
| 83 | Weddington | 63.50 | 13,805 | 43.3 | 15.0% | 51.0% |
| 84 | Mount Holly | 63.90 | 18,208 | 39.0 | 23.0% | 36.0% |
| 85 | Harrisburg | 65.70 | 19,633 | 40.1 | 17.0% | 50.0% |
| 86 | Tarboro | 66.80 | 10,770 | 51.2 | 33.0% | 21.6% |
| 87 | Mount Airy | 67.10 | 10,633 | 46.0 | 22.0% | 27.3% |
| 88 | Lewisville | 67.50 | 13,828 | 40.8 | 30.0% | 38.0% |
| 89 | Summerfield | 70.70 | 11,116 | 44.0 | 16.0% | 37.7% |
Source: U.S. Census ACS 2020-2024. 89 cities with more than 10,000 residents.
Summary
Summary: The Best Cities For Singles In North Carolina For 2026
If you’re looking for a breakdown of cities in North Carolina ranked by criteria that most agree make a place a great spot for finding a single person (and potentially love), this is an accurate list.
The best cities for singles in North Carolina are Carrboro, Boone, Chapel Hill, Raleigh, Charlotte, Morrisville, Durham, Fayetteville, Greenville, and Asheville.


