We used Saturday Night Science to analyze California’s most recent Census data to determine the divorce rate for each city in California based on the percentage of currently divorced residents.
The city with the highest divorce rate in California is Yreka, with 16.0% of people over 15 years of age being divorced, per the most recent census data. The city with the lowest divorce rate in California is Saratoga.
California is 4.0% divorced overall. There are some 1,257,196 people living in California over fifteen years of age who are divorced. You can compare that to the 28,339,199 Americans who are currently divorced.
Isn’t the divorce rate in America close to 50%? Yes indeed. But we’re measuring something else; we are looking at counts and percentages of people over 15 years old who are currently divorced. That 50% statistic is for the percentage of people who have ever been divorced.
So now that we have you biting your nails, rethinking your worldview, and pulling out your hair, let’s look at the places in California with the highest rates of divorcees.
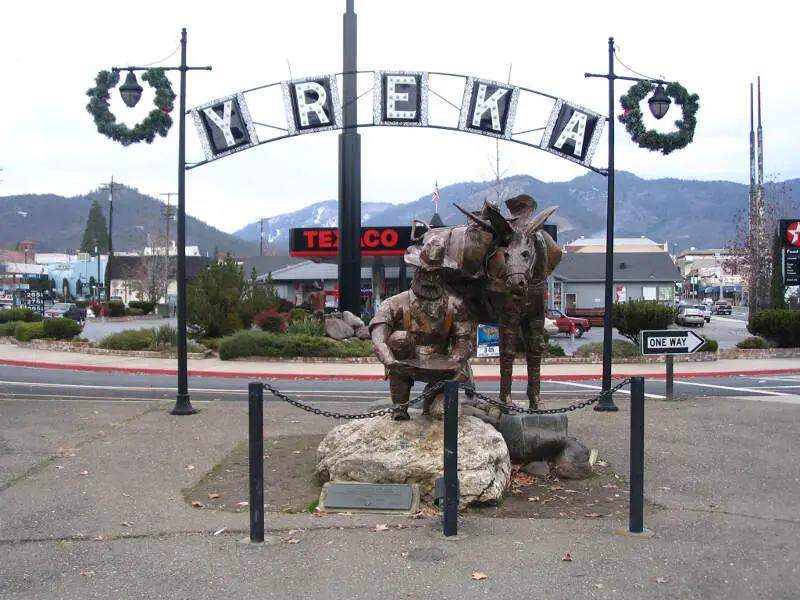
16.0% divorced · #1 highest divorce rate in California
Yreka is the county seat of Siskiyou County, California, United States, located in the Shasta Valley at 2,500 feet above sea level and covering about 10.1 sq mi area, of which most is land. As of the 2010 United States Census, the population was 7,765, reflecting an increase of 475 from the 7,290 counted in the 2000 Census. Yreka is home to the College of the Siskiyous, Klamath National Forest Interpretive Museum and the Siskiyou County Museum. Its gold mining heritage is commemorated by the high school team which uses a gold miner as their name and mascot.
Data | Crime | Cost of living | Movers
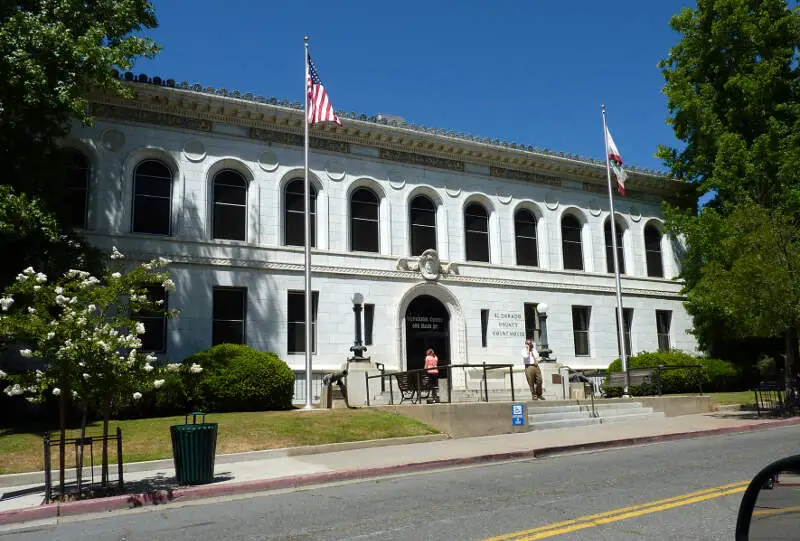
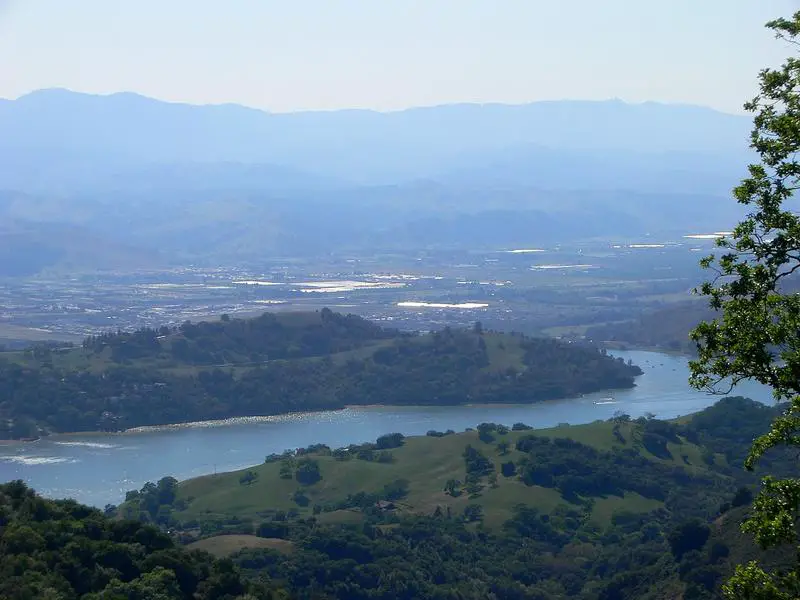
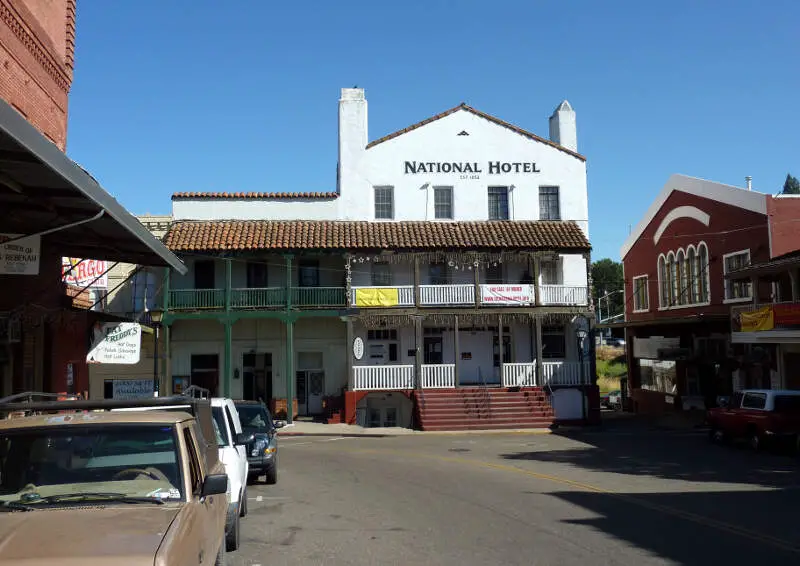
15.0% divorced · #2 highest divorce rate in California
Placerville is the county seat of El Dorado County, California. The population was 10,389 at the 2010 census, up from 9,610 at the 2000 census. It is part of the Sacramento-Arden-Arcade-Roseville Metropolitan Statistical Area.
Data | Crime | Cost of living | Movers
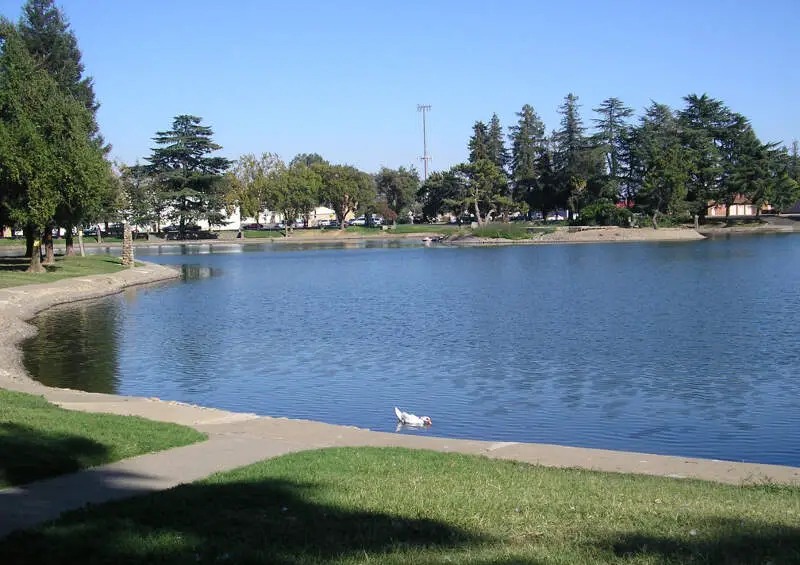
14.0% divorced · #4 highest divorce rate in California
Marysville is the county seat of Yuba County, California, United States. As of the 2010 United States Census, the population was 12,072, reflecting a decrease of 196 from the 12,268 counted in the 2000 Census. It is included in the Yuba City Metropolitan Statistical Area, often referred to as the Yuba-Sutter Area after the two counties, Yuba and Sutter. The metropolitan statistical area is part of the Greater Sacramento area.
Data | Crime | Cost of living | Movers
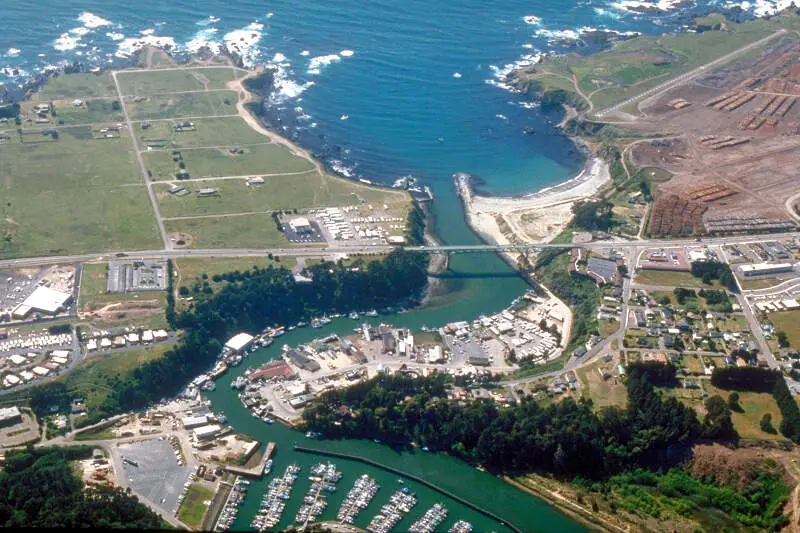
14.0% divorced · #4 highest divorce rate in California
Fort Bragg is a coastal city along State Route 1 in Mendocino County, California. It is 24 miles west of Willits, at an elevation of 85 feet. A California Historical Landmark, the city was founded, prior to the American Civil War, as a military garrison rather than a fortification. Fort Bragg is a tourist destination because of its picturesque views of the Pacific Ocean. Its population was 7,273 at the 2010 census.
Data | Crime | Cost of living | Movers
13.0% divorced · #5 highest divorce rate in California
Red Bluff is a city in and the county seat, of Tehama County, California, United States. The population was 14,076 at the 2010 census, up from 13,147 at the 2000 census.
Data | Crime | Cost of living | Movers
12.0% divorced · #8 highest divorce rate in California
Anderson is a city in Shasta County, California, USA, approximately 10 miles south of Redding. The population was 9,932 at the 2010 census, up from 9,022 at the 2000 census.
Data | Crime | Cost of living | Movers
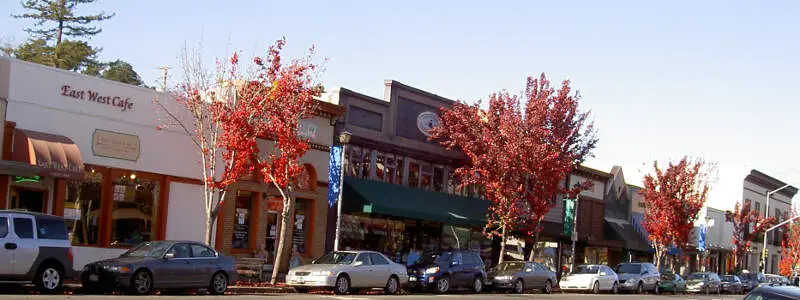
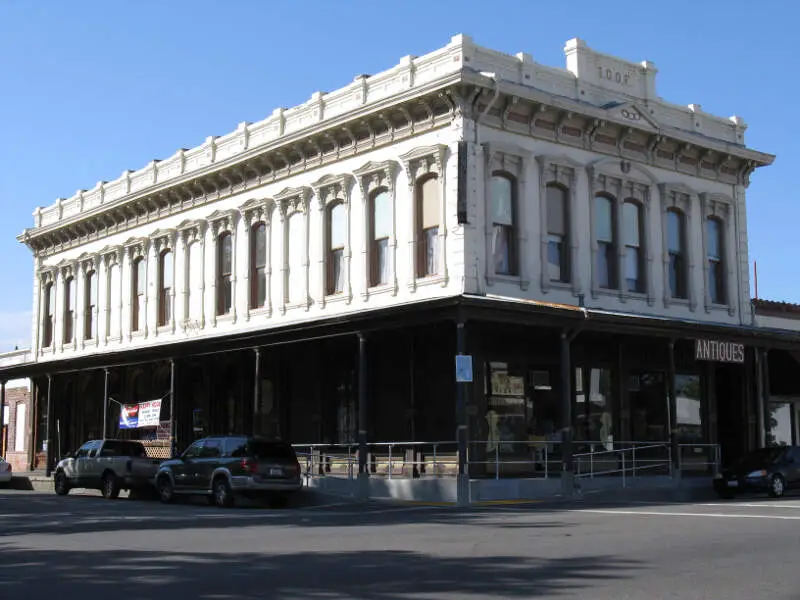
12.0% divorced · #8 highest divorce rate in California
Sebastopol or is a city in Sonoma County, California, United States, approximately 52mi north of San Francisco. The population was 7,379 at the 2010 census, but its businesses also serve surrounding rural portions of Sonoma County, a region known as West County, which has a population of up to 50,000 residents.
Data | Crime | Cost of living | Movers
12.0% divorced · #8 highest divorce rate in California
Data | Crime | Cost of living | Movers
12.0% divorced · #8 highest divorce rate in California
Data | Movers
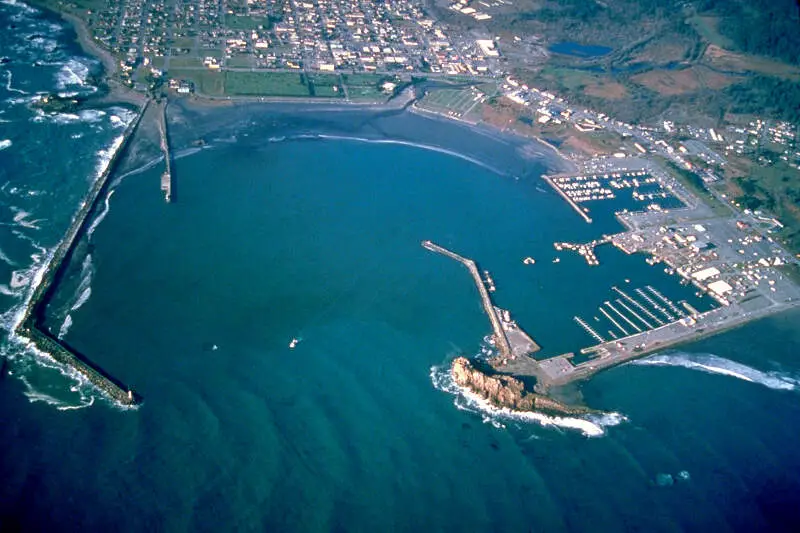
11.0% divorced · #12 highest divorce rate in California
Crescent City is the county seat of, and only incorporated city in, Del Norte County, California. Named for the crescent-shaped stretch of sandy beach south of the city, Crescent City had a total population of 7,643 in the 2010 census, up from 4,006 in the 2000 census. The population includes inmates at Pelican Bay State Prison, also within the city limits, and the former census-designated place Crescent City North annexed to the city. The city is also the site of the Redwood National Park headquarters, as well as the historic Battery Point Light. Due to the richness of the local Pacific Ocean waters and the related catch, and ease of access, Crescent City Harbor serves as home port for numerous commercial fishing vessels.
Data | Crime | Cost of living | Movers
The receipts
Compare the top ten
Pick a metric. The bars rescale. The red line is California’s statewide median.
California statewide median: $99,122
On the map
Where California’s highest divorce rates are
Saturday Night Science
How We Determined The Places In California That Get Un-Hitched The Most
We used Saturday Night Science to look at the U.S. Census Bureau on divorce rates. Because who likes tracking misery more than the U.S. government?
Specifically, we looked at the 2020-2024 American Community Survey table S1201 — Marital Status. Pretty straightforward on that front — we just had to extract the following column of data:
Today, the analysis focuses on the 428 places in California with a population of over 5,000.
- Population 15 Years and Over -> Divorced
We ranked each place by the percentage of divorcees over 15 years of age from highest to lowest. We crowned the divorce capital of California the place with the highest incidence of divorcees, Yreka.
And if you’re trying to avoid divorce, check out Saratoga, the city with the lowest divorce rate in California. We updated this article for 2026 and this list is our eleventh time ranking the cities in California with the highest divorce rates.
The full plate
Cities With The Highest Divorce Rates In California
Click any column to sort. Search by city name.
| Rank | City | Population | Divorcees | Divorce Rate |
|---|---|---|---|---|
| 1 | Yreka | 7,820 | 1,001 | 16.0% |
| 2 | Placerville | 10,762 | 1,291 | 15.0% |
| 3 | Marysville | 12,726 | 1,425 | 14.0% |
| 3 | Fort Bragg | 7,032 | 788 | 14.0% |
| 5 | Red Bluff | 14,549 | 1,513 | 13.0% |
| 7 | Anderson | 11,255 | 1,080 | 12.0% |
| 7 | Sebastopol | 7,445 | 715 | 12.0% |
| 7 | Lakeport | 5,113 | 491 | 12.0% |
| 7 | Jackson | 5,048 | 485 | 12.0% |
| 12 | Crescent City | 6,046 | 532 | 11.0% |
| 12 | Ione | 9,156 | 806 | 11.0% |
| 12 | Shasta Lake | 10,311 | 907 | 11.0% |
| 12 | Eureka | 26,010 | 2,289 | 11.0% |
| 12 | Tehachapi | 11,946 | 1,051 | 11.0% |
| 12 | Grover Beach | 12,604 | 1,109 | 11.0% |
| 19 | Oroville | 19,752 | 1,580 | 10.0% |
| 19 | Calimesa | 10,902 | 872 | 10.0% |
| 19 | Clearlake | 16,659 | 1,333 | 10.0% |
| 19 | Chowchilla | 19,020 | 1,522 | 10.0% |
| 19 | Grass Valley | 14,113 | 1,129 | 10.0% |
| 19 | Redding | 93,409 | 7,473 | 10.0% |
| 19 | Fortuna | 12,326 | 986 | 10.0% |
| 26 | Kingsburg | 12,755 | 918 | 9.0% |
| 26 | Auburn | 13,768 | 991 | 9.0% |
| 26 | Canyon Lake | 11,119 | 801 | 9.0% |
| 26 | Ukiah | 16,304 | 1,174 | 9.0% |
| 26 | Hughson | 7,648 | 551 | 9.0% |
| 26 | Sonoma | 10,670 | 768 | 9.0% |
| 26 | Exeter | 10,258 | 739 | 9.0% |
| 36 | Taft | 7,125 | 456 | 8.0% |
| 36 | Susanville | 14,177 | 907 | 8.0% |
| 36 | Big Bear Lake | 5,041 | 323 | 8.0% |
| 36 | Yucca Valley | 21,770 | 1,393 | 8.0% |
| 36 | Loomis | 6,853 | 439 | 8.0% |
| 36 | Sierra Madre | 10,940 | 700 | 8.0% |
| 36 | Colusa | 6,505 | 416 | 8.0% |
| 36 | Orland | 8,357 | 535 | 8.0% |
| 36 | Atascadero | 29,712 | 1,902 | 8.0% |
| 36 | Citrus Heights | 86,995 | 5,568 | 8.0% |
| 36 | Capitola | 9,689 | 620 | 8.0% |
| 36 | Martinez | 36,903 | 2,362 | 8.0% |
| 36 | Healdsburg | 11,243 | 720 | 8.0% |
| 36 | Rio Vista | 10,102 | 647 | 8.0% |
| 51 | Blythe | 17,396 | 974 | 7.0% |
| 51 | Scotts Valley | 12,044 | 674 | 7.0% |
| 51 | Ripon | 16,201 | 907 | 7.0% |
| 51 | Clovis | 124,725 | 6,985 | 7.0% |
| 51 | Hanford | 59,754 | 3,346 | 7.0% |
| 51 | Ojai | 7,577 | 424 | 7.0% |
| 51 | Visalia | 143,939 | 8,061 | 7.0% |
| 51 | El Paso de Robles (Paso Robles) | 31,446 | 1,761 | 7.0% |
| 51 | Apple Valley | 75,473 | 4,226 | 7.0% |
| 51 | Petaluma | 59,247 | 3,318 | 7.0% |
| 51 | Ridgecrest | 28,225 | 1,581 | 7.0% |
| 51 | Chico | 102,188 | 5,723 | 7.0% |
| 51 | Escalon | 7,451 | 417 | 7.0% |
| 51 | Willows | 6,190 | 347 | 7.0% |
| 51 | Yucaipa | 54,421 | 3,048 | 7.0% |
| 51 | Seal Beach | 24,722 | 1,384 | 7.0% |
| 82 | Hesperia | 100,775 | 4,837 | 6.0% |
| 82 | Lemoore | 27,102 | 1,301 | 6.0% |
| 82 | La Mesa | 60,797 | 2,918 | 6.0% |
| 82 | Simi Valley | 125,634 | 6,030 | 6.0% |
| 82 | Dixon | 19,683 | 945 | 6.0% |
| 82 | San Dimas | 33,789 | 1,622 | 6.0% |
| 82 | Pismo Beach | 8,014 | 385 | 6.0% |
| 82 | St. Helena | 5,318 | 255 | 6.0% |
| 82 | Galt | 25,962 | 1,246 | 6.0% |
| 82 | Turlock | 72,502 | 3,480 | 6.0% |
| 82 | Santa Rosa | 177,090 | 8,500 | 6.0% |
| 82 | Rohnert Park | 44,575 | 2,140 | 6.0% |
| 82 | Barstow | 25,100 | 1,205 | 6.0% |
| 82 | Gridley | 7,330 | 352 | 6.0% |
| 82 | Whittier | 86,165 | 4,136 | 6.0% |
| 82 | Brawley | 27,283 | 1,310 | 6.0% |
| 82 | Hemet | 91,326 | 4,384 | 6.0% |
| 82 | Vacaville | 102,596 | 4,925 | 6.0% |
| 82 | Chino | 92,652 | 4,447 | 6.0% |
| 82 | Corcoran | 22,491 | 1,080 | 6.0% |
| 82 | Pleasant Hill | 34,235 | 1,643 | 6.0% |
| 82 | Arroyo Grande | 18,372 | 882 | 6.0% |
| 82 | Lodi | 67,607 | 3,245 | 6.0% |
| 82 | Roseville | 155,955 | 7,486 | 6.0% |
| 82 | Lincoln | 52,956 | 2,542 | 6.0% |
| 82 | Folsom | 83,916 | 4,028 | 6.0% |
| 82 | Grand Terrace | 13,078 | 628 | 6.0% |
| 82 | Merced | 91,953 | 4,414 | 6.0% |
| 82 | Dana Point | 32,790 | 1,574 | 6.0% |
| 82 | Los Alamitos | 11,794 | 566 | 6.0% |
| 82 | Windsor | 26,081 | 1,252 | 6.0% |
| 82 | Lemon Grove | 27,686 | 1,329 | 6.0% |
| 82 | Fillmore | 16,816 | 807 | 6.0% |
| 82 | Huron | 6,519 | 313 | 6.0% |
| 82 | Calipatria | 6,548 | 314 | 6.0% |
| 82 | Yuba City | 69,471 | 3,335 | 6.0% |
| 82 | Hollister | 43,811 | 2,103 | 6.0% |
| 82 | Huntington Beach | 195,240 | 9,372 | 6.0% |
| 82 | Modesto | 219,215 | 10,522 | 6.0% |
| 82 | Morro Bay | 10,692 | 513 | 6.0% |
| 82 | Cotati | 7,489 | 359 | 6.0% |
Source: U.S. Census ACS 2020-2024. 428 cities with more than 5,000 residents.
Summary
Getting Some Closure In California After Untying The Knot
We now have a sense of what places in the Golden State don’t pay much attention to the whole “’til death do we part” phrase.
The cities with the highest divorce rate in California are Yreka, Placerville, Marysville, Fort Bragg, Red Bluff, Anderson, Sebastopol, Lakeport, Jackson, and Crescent City.
Try to keep in mind that the reason cities rank where they do in California could be because of the age, education, and income distribution, as all of those things impact the rate of divorce. Not sold on California? Take the two-minute Find Your Place quiz and see which state actually fits you.
Questions and answers
Divorce In California FAQs
What city in California has the highest divorce rate?
Yreka has the highest divorce rate in California for 2026, with 16.0% of residents over 15 currently divorced. Placerville and Marysville are next.
What is the divorce rate in California?
California is 4.0% divorced overall, versus a US divorce rate of 10.9%. That counts residents over 15 who are currently divorced, per the Census American Community Survey.
What are the divorce capitals of California?
The California cities with the highest divorce rates are Yreka, Placerville, Marysville, Fort Bragg, Red Bluff, Anderson, Sebastopol, Lakeport, Jackson, and Crescent City. We ranked all 428 cities with more than 5,000 residents.
Where do marriages last in California?
Saratoga posts the lowest divorce rate of the 428 California cities we ranked. Whatever they are doing there, it appears to be working.
How do you measure divorce rates?
We use the share of residents aged 15 and over who report being currently divorced in the Census American Community Survey. It is a snapshot of marital status today, not a count of divorces filed each year.