Newarkvs.New York Which City Is Right for You in 2026?
A head-to-head guide to cost of living, jobs, transportation, weather, crime, and quality of life — so you can decide where to live, work, or visit.
Updated 2026-05-26 · By HomeSnacks Editorial
Newark vs. New York at a glance
Choosing between Newark, NJ and New York, NY comes down to which trade-offs matter most to you. Below we break down cost of living, jobs, housing, crime, diversity, weather, transportation, and culture using public data from the U.S. Census Bureau, the FBI, and HomeSnacks' proprietary SnackAbility quality-of-life score.
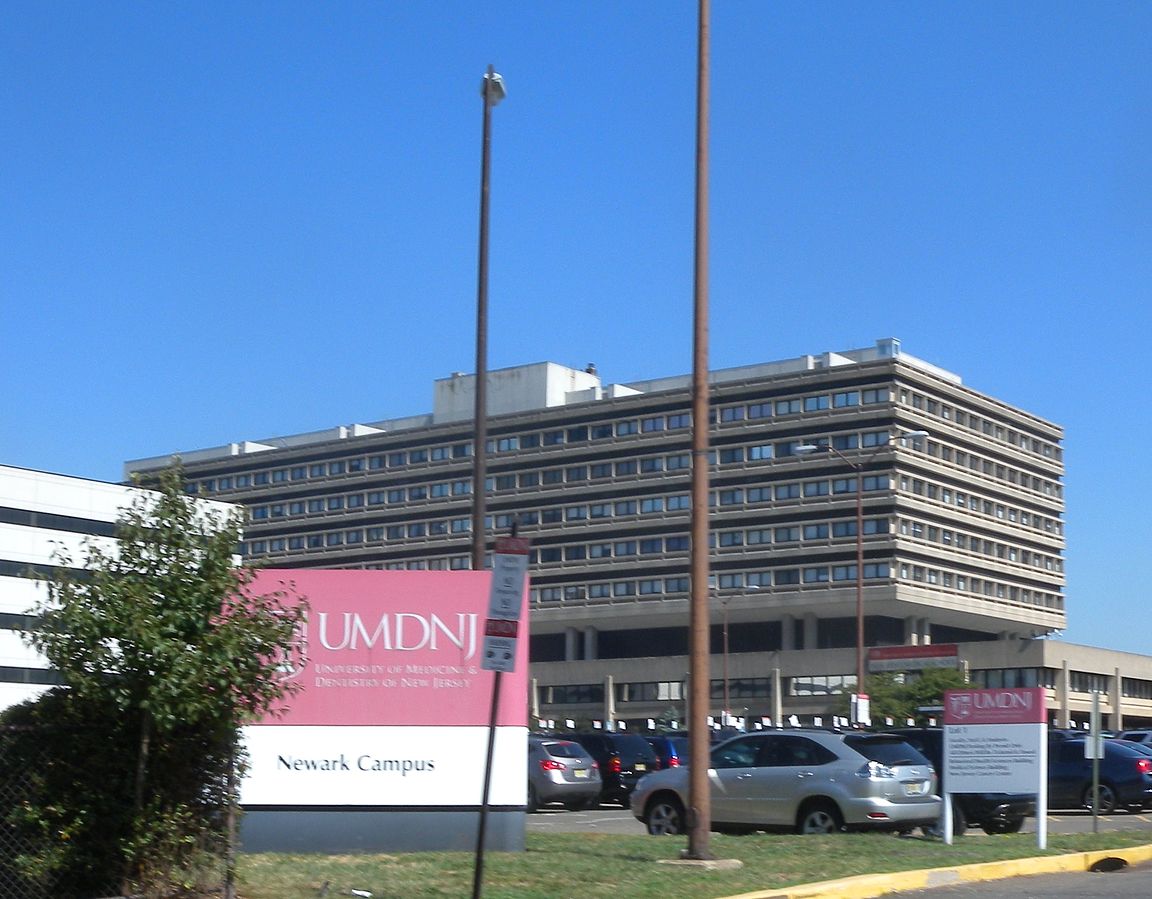
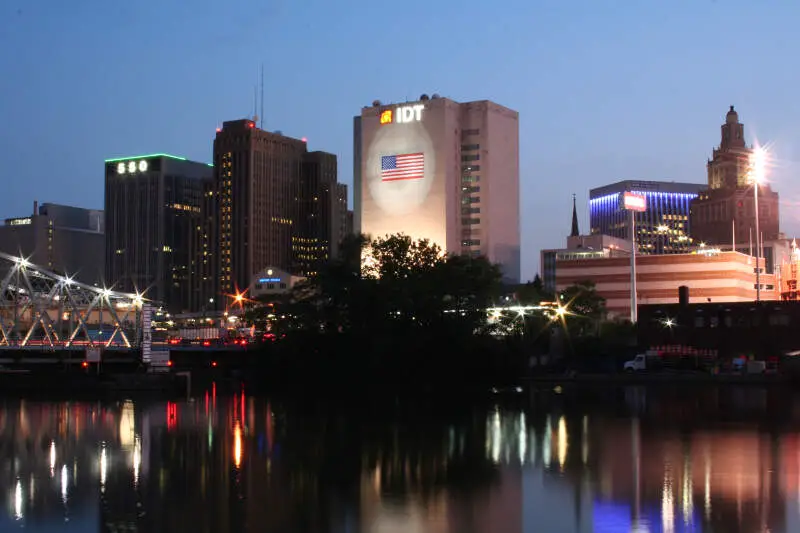
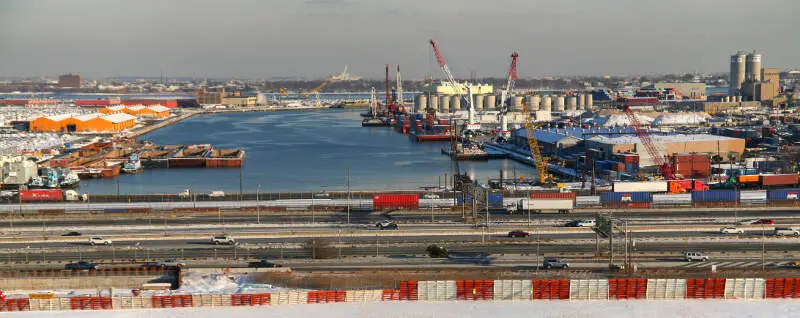
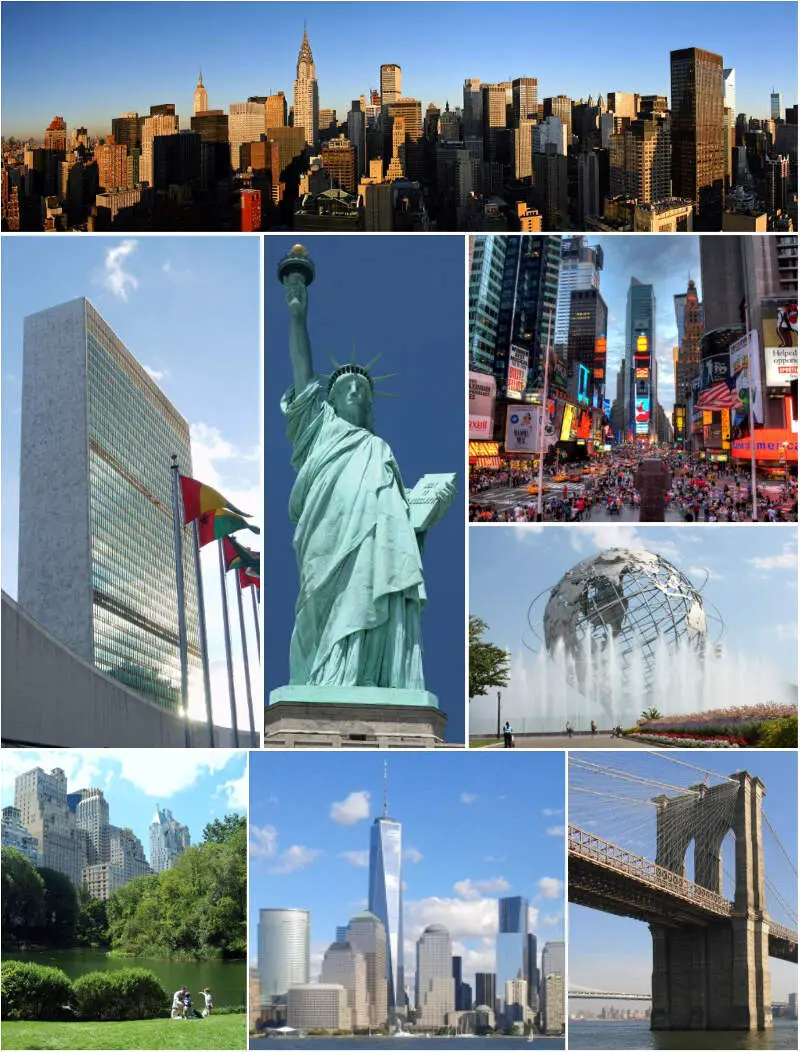
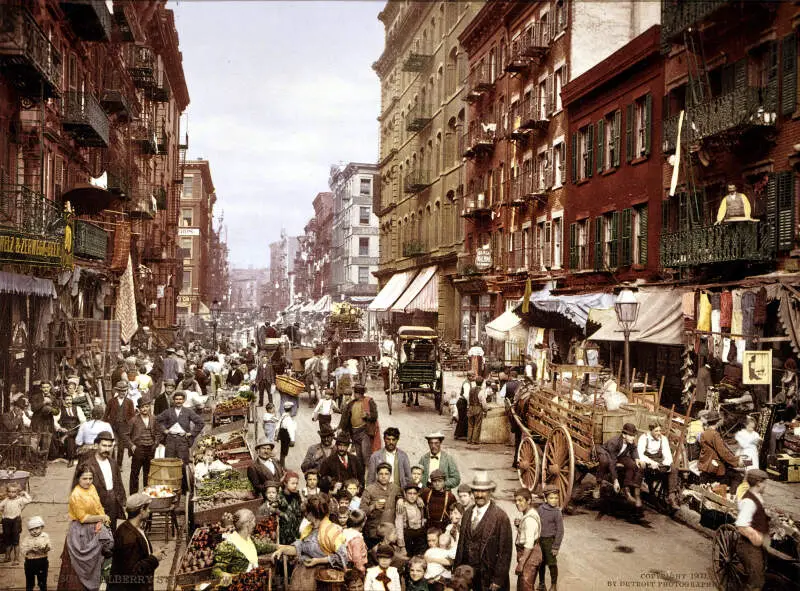
Newark vs. New York in photos
A side-by-side look at each city.

Cost of living
Newark is the cheaper city overall — 33% higher in New York than its rival. Index baseline: 100 = national average.
| Living expense | Newark | New York | US average |
|---|---|---|---|
| Overall | 121 | 180 | 100 |
| Services | 106 | 119 | 100 |
| Groceries | 110 | 124 | 100 |
| Health | 135 | 298 | 100 |
| Housing | 119 | 134 | 100 |
| Transportation | 110 | 119 | 100 |
| Utilities | 117 | 134 | 100 |
Lower index = cheaper. 100 = U.S. national average. Bar inside each cell scales relative to the highest value in the table.
Sources: HomeSnacks Cost of Living indices, normalized so 100 = U.S. national average. Drill in: Newark cost of living, New York cost of living, or the cheapest cities in America.
Housing breakdown
Home prices are higher in New York. Compare absolute price and price-to-income — a $500k home in a $100k-income city is very different from one in a $50k-income city.
| Metric | Newark | New York | United States |
|---|---|---|---|
| Median Home Value | $478,454 | $812,861 | $332,700 |
| Median Rent | $1,392 | $1,821 | $1,413 |
| Median Income | $52,060 | $80,483 | $80,734 |
| Home Value To Income | 9.2x | 10.1x | 4.1x |
| Rent To Monthly Income | 0.32x | 0.27x | 0.21x |
Source: U.S. Census Bureau ACS 2020-2024. See also states with the highest rent in America.
Crime
Newark is the safer city — total crime rate of 2,539 per 100k people vs 3,039 for New York. US average: 2,119.
| Crime (per 100k) | Newark | New York | US average |
|---|---|---|---|
| Total crime | 2,539 | 3,039 | 2,119 |
| Murder | 13 | 4 | 5 |
| Robbery | 143 | 187 | 61 |
| Aggravated Assault | 385 | 456 | 256 |
| Violent Crime | 581 | 671 | 359 |
| Burglary | 152 | 155 | 229 |
| Larceny | 931 | 2,015 | 1,272 |
| Car Theft | 874 | 199 | 259 |
| Property Crime | 1,957 | 2,368 | 1,760 |
Lower = safer. Bar inside each cell scales relative to the highest crime rate in the table.
Source: FBI Uniform Crime Reporting (2024). All rates are per 100,000 people. City pages: Newark crime, New York crime. See also: safest cities in America.
Diversity
New York is more racially diverse — lower HHI (closer to 0) means a more even mix across groups.
| Group | Newark | New York | United States |
|---|---|---|---|
| White | 8.9% | 31.0% | 57.4% |
| African American | 44.8% | 20.4% | 11.9% |
| American Indian | 0.1% | 0.2% | 0.5% |
| Asian | 2.0% | 14.6% | 5.9% |
| Hawaiian | 0.0% | 0.0% | 0.2% |
| Other | 2.5% | 1.4% | 0.6% |
| Two Or More | 4.1% | 3.9% | 4.3% |
| Hispanic | 37.6% | 28.5% | 19.3% |
Source: U.S. Census ACS 2020-2024. Lower HHI = more even racial mix. See also: most diverse cities in America.
SnackAbility — overall quality of life
New York scores higher overall — 8/10 vs 4/10. SnackAbility is our 1–10 quality-of-life score; the median U.S. city scores a 7.
SnackAbility is a HomeSnacks proprietary 1–10 score blending jobs, housing, education, commute, amenities, affordability, crime, and diversity. Median U.S. city ≈ 7. Data: Census, BLS, FBI. See also: best places to live in America.
Getting around: Newark vs. New York
How each city handles commuting, transit, walkability, and car culture — the day-to-day reality that shapes where you'd actually want to live.
Newark and New York sit just 9 miles apart, and that proximity shapes how people in both cities get around. PATH trains connect Newark to Lower Manhattan in about 20–30 minutes for a flat fare, and NJ Transit rail out of Newark Penn Station reaches Midtown or the Jersey Shore with equal ease. Newark Liberty International Airport is right there too, a convenience Manhattan residents don't have at their doorstep.
Car ownership is more common in Newark than in Manhattan, and surface traffic on the Turnpike and I-78 grinds at rush hour. If you commute by car in either city, both rank among the worst traffic metros in the country.
New York's MTA subway runs 24 hours a day across all five boroughs, and most Manhattan residents live without a car entirely. Delays, crowding on the 4/5/6 and L lines, and aging infrastructure are real frustrations. For transit frequency, New York has the edge, but Newark's PATH connection and airport access make it a genuinely connected option.
Jobs and careers in Newark vs. New York
The local job market, dominant industries, and which city to choose based on your career.
The income gap between the two cities is real. New York's median household income of $80,483 comes from a dense mix of high-wage industries: finance along Wall Street, media in Midtown, tech in the Flatiron and Hudson Yards corridors, and healthcare at NYU Langone, Mount Sinai, and NewYork-Presbyterian. The job market is competitive, but the volume of openings is hard to match anywhere.
Newark's median household income of $52,060 tells a more mixed story, though the city has substantial employers. Prudential Financial is headquartered downtown, Audible (an Amazon subsidiary) has offices in the Ironbound, and PSEG anchors the utility sector. Rutgers University–Newark and a cluster of major hospitals add stable public-sector and healthcare jobs.
Many Newark residents commute into New York, and the PATH makes that practical. Newark's cost of living index of 121 versus New York's 180 means your dollar goes further, even when the paycheck is smaller.
Weather and climate
What to expect day-to-day — sun, fog, heat, rain, and the seasonal extremes that shape the lifestyle.
Newark and New York share essentially the same climate, humid subtropical shading into humid continental. Summers run hot and sticky, with July highs regularly in the high 80s and heat indexes pushing into the 90s. Manhattan's dense concrete grid traps heat a bit more than Newark's lower skyline, but both cities deal with occasional heat waves.
Winters are cold and variable, with nor'easters capable of dropping a foot of snow overnight. Snow is a real possibility from December through March. A January morning at 15°F with wind off the Hudson or the Passaic is no joke, even if neither city gets the sustained cold of Buffalo or Minneapolis.
Spring and fall are genuinely pleasant in both places: mild temperatures, lower humidity, and comfortable stretches for being outside. If you're choosing between Newark and New York on climate alone, the difference is too small to matter.
Culture, nightlife, and entertainment
Food, music, neighborhoods, and the city vibe that gives each place its personality.
New York's cultural options are hard to overstate. Broadway, hundreds of live music venues, and museums from the Met to MoMA to the Whitney anchor a city where neighborhoods like the West Village, Williamsburg, and Astoria each have their own distinct nightlife identity. The flip side is cost: a night out in Manhattan adds up fast, and outer-borough bars have crept toward Manhattan pricing in recent years.
Newark's scene is smaller but worth knowing. The New Jersey Performing Arts Center (NJPAC) books national acts and touring productions at prices well below Broadway, and the Newark Museum of Art holds one of the better permanent collections in the region, consistently overlooked by visitors focused on Manhattan.
The Ironbound, Newark's Portuguese and Brazilian enclave, is one of the best dining destinations in the metro area. If you want authentic churrascarias and bacalhau without Midtown markups, Ironbound is a draw New York can't replicate.
Outdoor activities and day trips
Parks, beaches, hikes, and the weekend escapes that define life outside the city limits.
Branch Brook Park in Newark's North Ward, designed by Frederick Law Olmsted, hosts the largest cherry blossom collection in the United States, surpassing Washington D.C.'s display every April. Weequahic Park on the south side has a lake, golf course, and open green space. Beyond city limits, you're within an hour of the Jersey Shore beaches, the Delaware Water Gap, and the Watchung Reservation if you have a car.
New York's in-city options are more expansive. Central Park's 843 acres anchor Manhattan, Prospect Park serves Brooklyn, and the Hudson River Greenway offers miles of car-free waterfront running and cycling. Governors Island (open seasonally via ferry) is a quieter break from the grid, and the Rockaways give you real beach access without leaving the five boroughs.
For hiking, the Catskills and Harriman State Park are reachable from New York via Metro-North or a short drive. Without a car, New York has a clear edge for outdoor access. With a car, both cities put you equally close to the same regional destinations.
Bottom line: which city is right for you?
Based on the head-to-head data above, here's the short version — pick the city that lines up with what you actually care about.
Choose Newark if you prioritize…
- a lower cost of living (cheaper groceries, services, and day-to-day expenses).
- lower crime — a safer place to live, work, and raise a family.
Choose New York if you prioritize…
- more affordable housing relative to Newark.
- a more racially diverse community (lower HHI on Census data).
- a higher overall SnackAbility quality-of-life score.
Methodology: winners are picked from public data — U.S. Census Bureau ACS (income, home value, rent, race/HHI), FBI Uniform Crime Reporting (crime rates per 100k), and HomeSnacks' proprietary SnackAbility quality-of-life score, which blends Bureau of Labor Statistics data with the above.
More about New Jersey & New York

Best Places To Live In New Jersey
Photo: Public domain
Cheapest Places To Live In New Jersey
Photo: Public domain
Most Dangerous Cities In New Jersey
Photo: Public domain
Best Places To Raise A Family In New Jersey
Photo: Public domain
Best Places To Retire In New Jersey
Photo: Public domain
Richest Cities In New Jersey
Photo: Public domain
Safest Places In New Jersey
Photo: Public domain
Worst Places To Live In New Jersey
Photo: Public domain