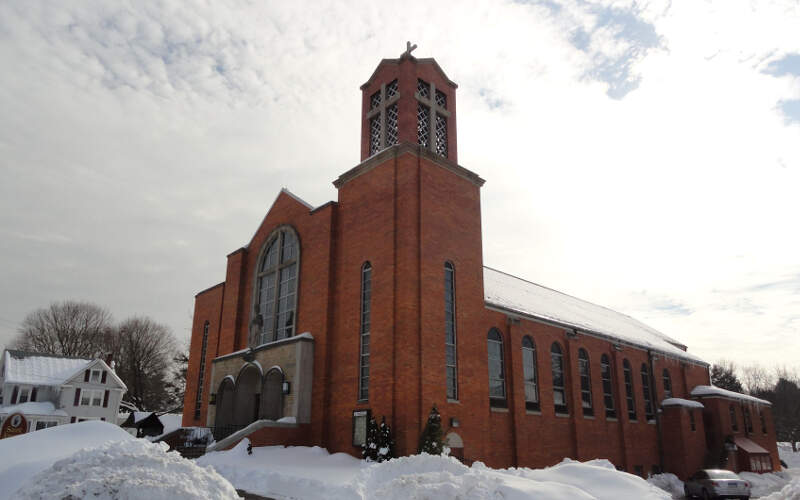
Rockville, CT
Demographics And Statistics
Living In Rockville, Connecticut Summary
Life in Rockville research summary. HomeSnacks has been using Saturday Night Science to research the quality of life in Rockville over the past nine years using Census, FBI, Zillow, and other primary data sources. Based on the most recently available data, we found the following about life in Rockville:
The population in Rockville is 6,657.
The median home value in Rockville is $241,234.
The median income in Rockville is $51,607.
The cost of living in Rockville is 102 which is 1.0x higher than the national average.
The median rent in Rockville is $1,137.
The unemployment rate in Rockville is 8.5%.
The poverty rate in Rockville is 23.9%.
The average high in Rockville is 58.8° and the average low is 38.5°.
Table Of Contents
Rockville SnackAbility
Overall SnackAbility
Rockville, CT Cost Of Living
Cost of living in Rockville summary. We use data on the cost of living to determine how expensive it is to live in Rockville. Real estate prices drive most of the variance in cost of living around Connecticut. Key points include:
The cost of living in Rockville is 102 with 100 being average.
The cost of living in Rockville is 1.0x higher than the national average.
The median home value in Rockville is $241,234.
The median income in Rockville is $51,607.
Rockville's Overall Cost Of Living
Higher Than The National Average
Cost Of Living In Rockville Comparison Table
| Living Expense | Rockville | Connecticut | National Average | |
|---|---|---|---|---|
| Overall | 102 | 119 | 100 | |
| Services | 109 | 109 | 100 | |
| Groceries | 101 | 100 | 100 | |
| Health | 103 | 110 | 100 | |
| Housing | 92 | 137 | 100 | |
| Transportation | 98 | 101 | 100 | |
| Utilities | 126 | 131 | 100 | |
Rockville, CT Weather
The average high in Rockville is 58.8° and the average low is 38.5°.
There are 83.8 days of precipitation each year.
Expect an average of 48.3 inches of precipitation each year with 34.6 inches of snow.
| Stat | Rockville |
|---|---|
| Average Annual High | 58.8 |
| Average Annual Low | 38.5 |
| Annual Precipitation Days | 83.8 |
| Average Annual Precipitation | 48.3 |
| Average Annual Snowfall | 34.6 |
Average High
Days of Rain
Rockville, CT Photos


Rankings for Rockville in Connecticut


Locations Around Rockville
Map Of Rockville, CT
Best Places Around Rockville
West Hartford, CT
Population 63,809
Sherwood Manor, CT
Population 5,781
Wethersfield, CT
Population 27,180
Southwood Acres, CT
Population 8,154
Newington, CT
Population 30,551
Windsor Locks, CT
Population 12,555
Rockville Demographics And Statistics
Population over time in Rockville
The current population in Rockville is 6,657. The population has decreased -13.6% from 2010.
| Year | Population | % Change |
|---|---|---|
| 2023 | 6,657 | -4.2% |
| 2022 | 6,951 | -8.7% |
| 2021 | 7,612 | 7.5% |
| 2020 | 7,084 | -0.4% |
| 2019 | 7,115 | -3.0% |
| 2018 | 7,332 | 2.0% |
| 2017 | 7,188 | 0.1% |
| 2016 | 7,178 | -3.8% |
| 2015 | 7,459 | 1.5% |
| 2014 | 7,348 | 0.3% |
| 2013 | 7,328 | -4.4% |
| 2012 | 7,666 | 0.4% |
| 2011 | 7,637 | -0.9% |
| 2010 | 7,706 | - |
Race / Ethnicity in Rockville
Rockville is:
61.3% White with 4,083 White residents.
7.1% African American with 471 African American residents.
2.1% American Indian with 143 American Indian residents.
3.2% Asian with 215 Asian residents.
0.0% Hawaiian with 3 Hawaiian residents.
0.8% Other with 54 Other residents.
2.5% Two Or More with 169 Two Or More residents.
22.8% Hispanic with 1,519 Hispanic residents.
| Race | Rockville | CT | USA |
|---|---|---|---|
| White | 61.3% | 63.0% | 58.2% |
| African American | 7.1% | 9.9% | 12.0% |
| American Indian | 2.1% | 0.1% | 0.5% |
| Asian | 3.2% | 4.7% | 5.7% |
| Hawaiian | 0.0% | 0.0% | 0.2% |
| Other | 0.8% | 0.7% | 0.5% |
| Two Or More | 2.5% | 3.8% | 3.9% |
| Hispanic | 22.8% | 17.8% | 19.0% |
Gender in Rockville
Rockville is 51.5% female with 3,430 female residents.
Rockville is 48.5% male with 3,227 male residents.
| Gender | Rockville | CT | USA |
|---|---|---|---|
| Female | 51.5% | 50.9% | 50.5% |
| Male | 48.5% | 49.1% | 49.5% |
Highest level of educational attainment in Rockville for adults over 25
4.0% of adults in Rockville completed < 9th grade.
10.0% of adults in Rockville completed 9-12th grade.
40.0% of adults in Rockville completed high school / ged.
25.0% of adults in Rockville completed some college.
7.0% of adults in Rockville completed associate's degree.
9.0% of adults in Rockville completed bachelor's degree.
4.0% of adults in Rockville completed master's degree.
1.0% of adults in Rockville completed professional degree.
0.0% of adults in Rockville completed doctorate degree.
| Education | Rockville | CT | USA |
|---|---|---|---|
| < 9th Grade | 4.0% | 3.0% | 5.0% |
| 9-12th Grade | 10.0% | 5.0% | 6.0% |
| High School / GED | 40.0% | 26.0% | 26.0% |
| Some College | 25.0% | 16.0% | 19.0% |
| Associate's Degree | 7.0% | 8.0% | 9.0% |
| Bachelor's Degree | 9.0% | 23.0% | 21.0% |
| Master's Degree | 4.0% | 14.0% | 10.0% |
| Professional Degree | 1.0% | 3.0% | 2.0% |
| Doctorate Degree | 0.0% | 2.0% | 2.0% |
Household Income For Rockville, Connecticut
6.4% of households in Rockville earn Less than $10,000.
13.6% of households in Rockville earn $10,000 to $14,999.
13.1% of households in Rockville earn $15,000 to $24,999.
3.7% of households in Rockville earn $25,000 to $34,999.
11.4% of households in Rockville earn $35,000 to $49,999.
15.1% of households in Rockville earn $50,000 to $74,999.
15.2% of households in Rockville earn $75,000 to $99,999.
13.5% of households in Rockville earn $100,000 to $149,999.
6.5% of households in Rockville earn $150,000 to $199,999.
1.5% of households in Rockville earn $200,000 or more.
| Income | Rockville | CT | USA |
|---|---|---|---|
| Less than $10,000 | 6.4% | 4.4% | 4.9% |
| $10,000 to $14,999 | 13.6% | 3.2% | 3.6% |
| $15,000 to $24,999 | 13.1% | 5.6% | 6.6% |
| $25,000 to $34,999 | 3.7% | 5.6% | 6.8% |
| $35,000 to $49,999 | 11.4% | 8.6% | 10.4% |
| $50,000 to $74,999 | 15.1% | 13.4% | 15.7% |
| $75,000 to $99,999 | 15.2% | 12.0% | 12.7% |
| $100,000 to $149,999 | 13.5% | 17.8% | 17.4% |
| $150,000 to $199,999 | 6.5% | 11.2% | 9.3% |
| $200,000 or more | 1.5% | 18.2% | 12.6% |


