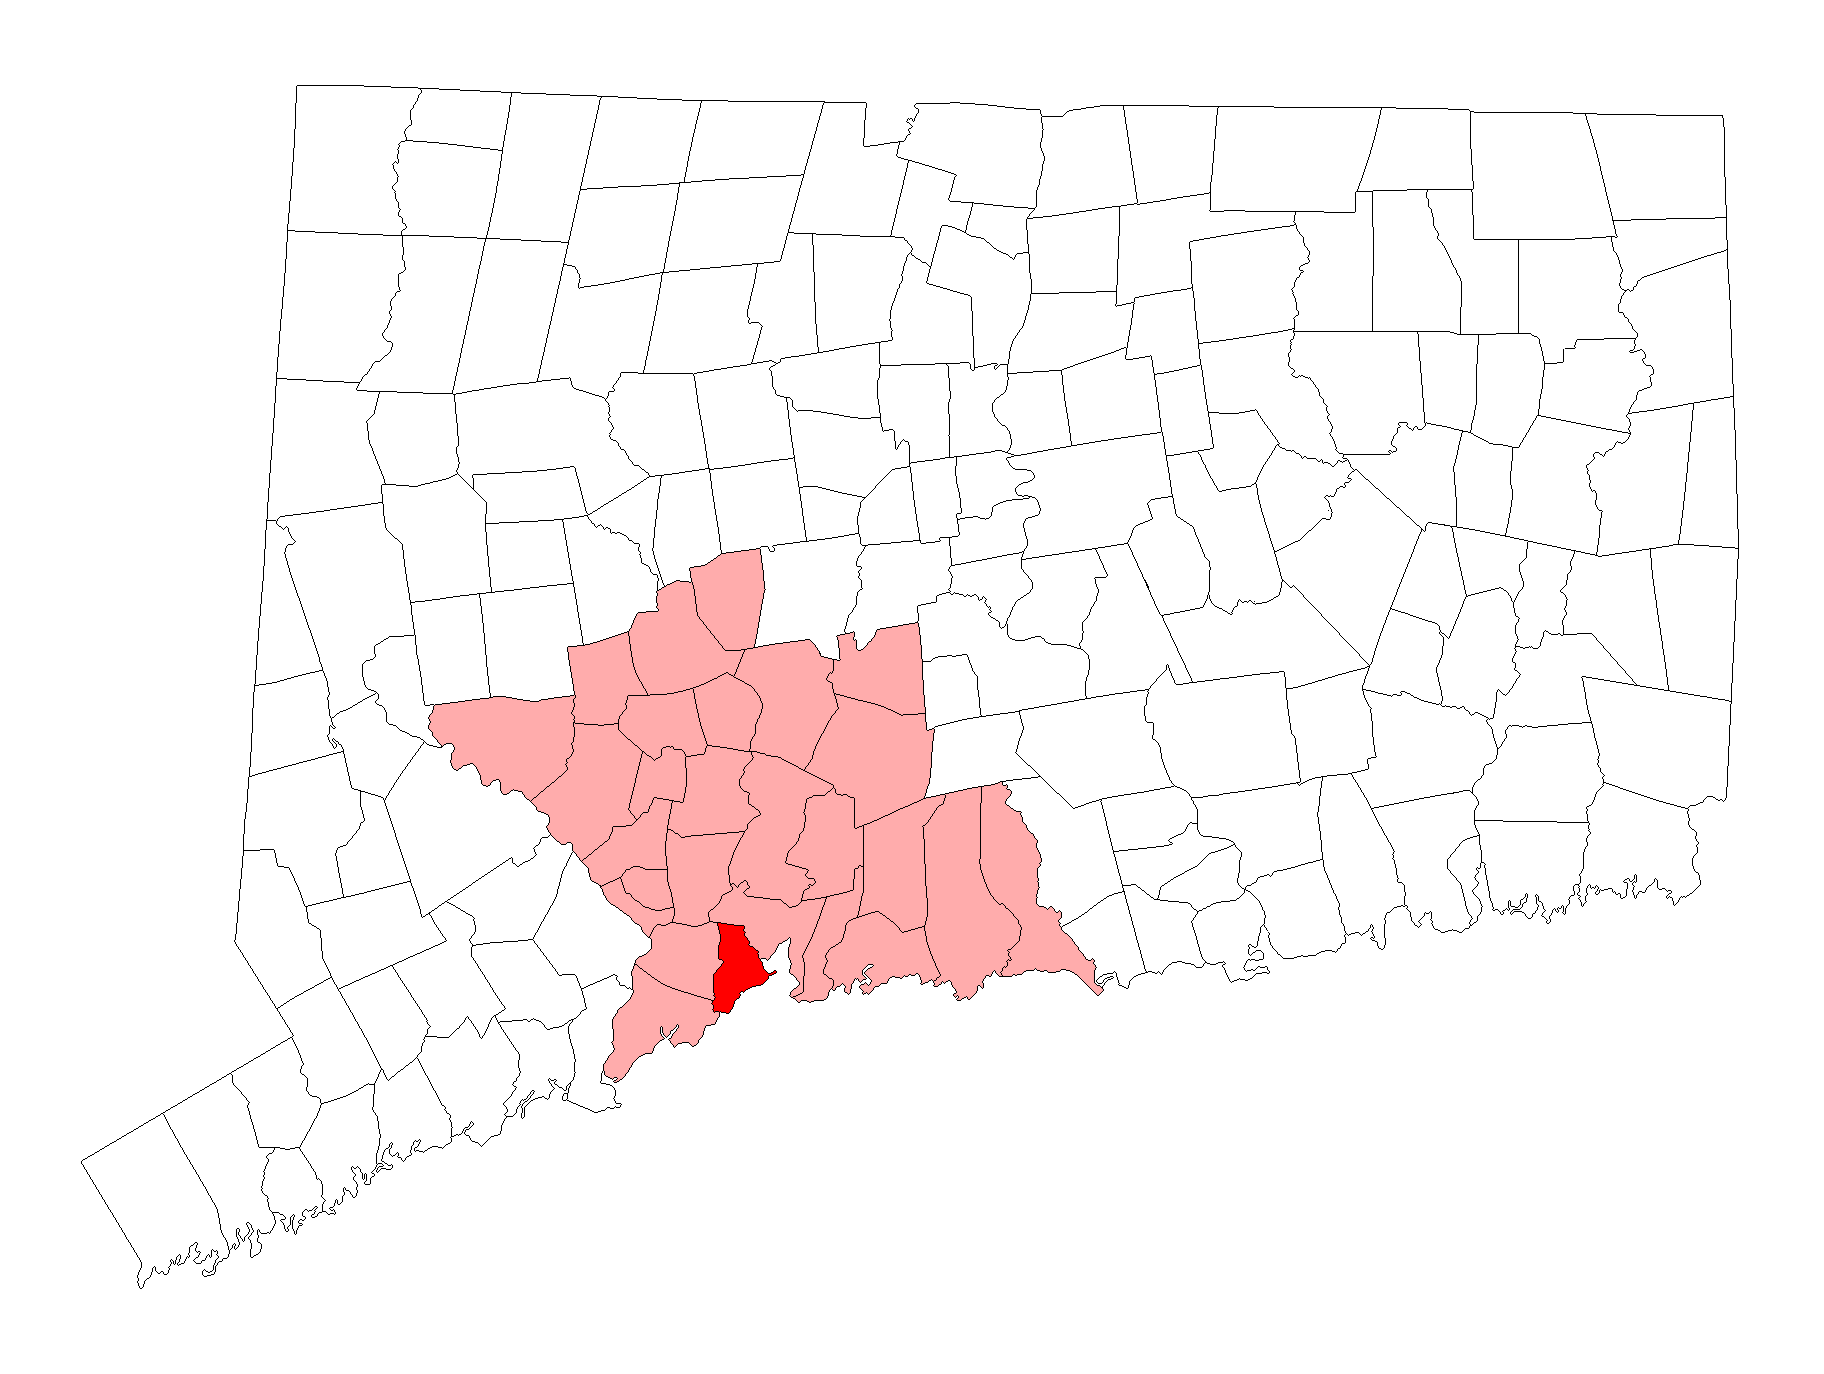
West Haven, CT
Demographics And Statistics
Living In West Haven, Connecticut Summary
Life in West Haven research summary. HomeSnacks has been using Saturday Night Science to research the quality of life in West Haven over the past nine years using Census, FBI, Zillow, and other primary data sources. Based on the most recently available data, we found the following about life in West Haven:
The population in West Haven is 55,147.
The median home value in West Haven is $342,870.
The median income in West Haven is $73,566.
The cost of living in West Haven is 112 which is 1.1x higher than the national average.
The median rent in West Haven is $1,389.
The unemployment rate in West Haven is 6.6%.
The poverty rate in West Haven is 12.5%.
The average high in West Haven is 60.5° and the average low is 41.1°.
West Haven SnackAbility
Overall SnackAbility
West Haven, CT Crime Report
Crime in West Haven summary. We use data from the FBI to determine the crime rates in West Haven. Key points include:
There were 733 total crimes in West Haven in the last reporting year.
The overall crime rate per 100,000 people in West Haven is 1,342.5 / 100k people.
The violent crime rate per 100,000 people in West Haven is 104.4 / 100k people.
The property crime rate per 100,000 people in West Haven is 1,238.1 / 100k people.
Overall, crime in West Haven is -36.65% below the national average.
Total Crimes
Below National Average
Crime In West Haven Comparison Table
| Statistic | Count Raw |
West Haven / 100k People |
Connecticut / 100k People |
National / 100k People |
|---|---|---|---|---|
| Total Crimes Per 100K | 733 | 1,342.5 | 1,502.1 | 2,119.2 |
| Violent Crime | 57 | 104.4 | 136.0 | 359.0 |
| Murder | 2 | 3.7 | 2.4 | 5.0 |
| Robbery | 22 | 40.3 | 38.1 | 61.0 |
| Aggravated Assault | 25 | 45.8 | 77.5 | 256.0 |
| Property Crime | 676 | 1,238.1 | 1,366.1 | 1,760.0 |
| Burglary | 67 | 122.7 | 117.3 | 229.0 |
| Larceny | 458 | 838.9 | 1,013.7 | 1,272.0 |
| Car Theft | 151 | 276.6 | 235.0 | 259.0 |
West Haven, CT Cost Of Living
Cost of living in West Haven summary. We use data on the cost of living to determine how expensive it is to live in West Haven. Real estate prices drive most of the variance in cost of living around Connecticut. Key points include:
The cost of living in West Haven is 112 with 100 being average.
The cost of living in West Haven is 1.1x higher than the national average.
The median home value in West Haven is $342,870.
The median income in West Haven is $73,566.
West Haven's Overall Cost Of Living
Higher Than The National Average
Cost Of Living In West Haven Comparison Table
| Living Expense | West Haven | Connecticut | National Average | |
|---|---|---|---|---|
| Overall | 112 | 119 | 100 | |
| Services | 110 | 109 | 100 | |
| Groceries | 97 | 100 | 100 | |
| Health | 114 | 110 | 100 | |
| Housing | 112 | 137 | 100 | |
| Transportation | 101 | 101 | 100 | |
| Utilities | 134 | 131 | 100 | |
West Haven, CT Weather
The average high in West Haven is 60.5° and the average low is 41.1°.
There are 77.6 days of precipitation each year.
Expect an average of 49.9 inches of precipitation each year with 34.0 inches of snow.
| Stat | West Haven |
|---|---|
| Average Annual High | 60.5 |
| Average Annual Low | 41.1 |
| Annual Precipitation Days | 77.6 |
| Average Annual Precipitation | 49.9 |
| Average Annual Snowfall | 34.0 |
Average High
Days of Rain
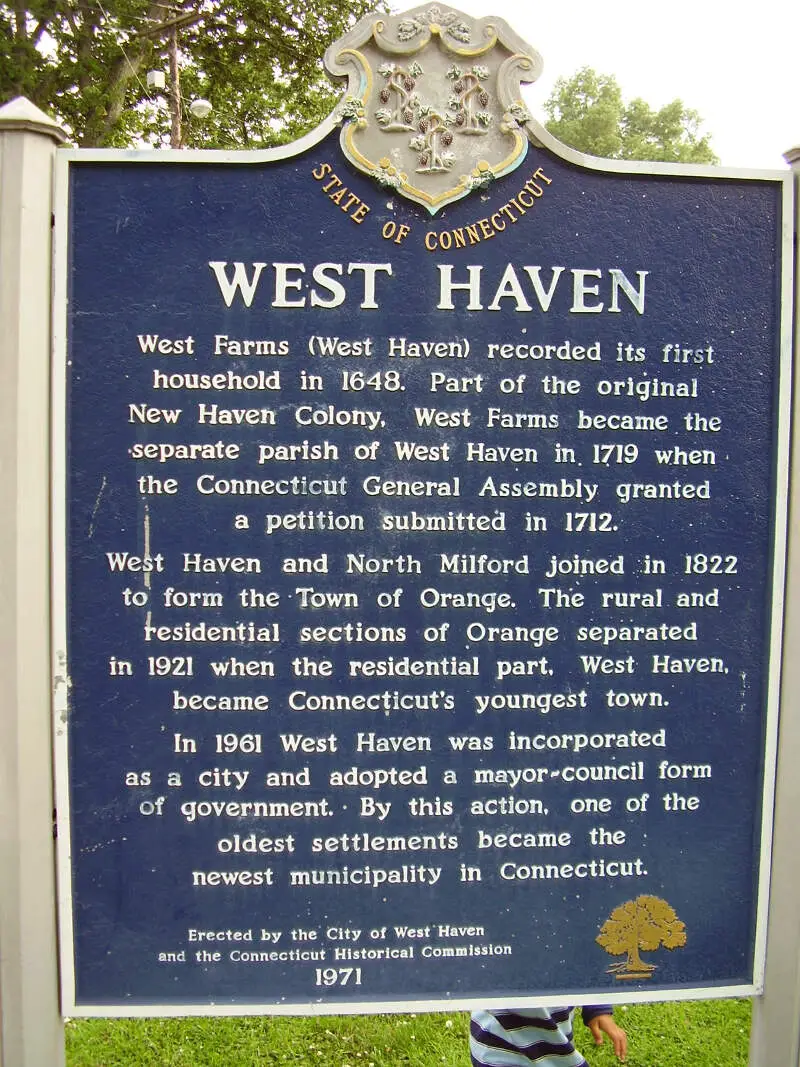
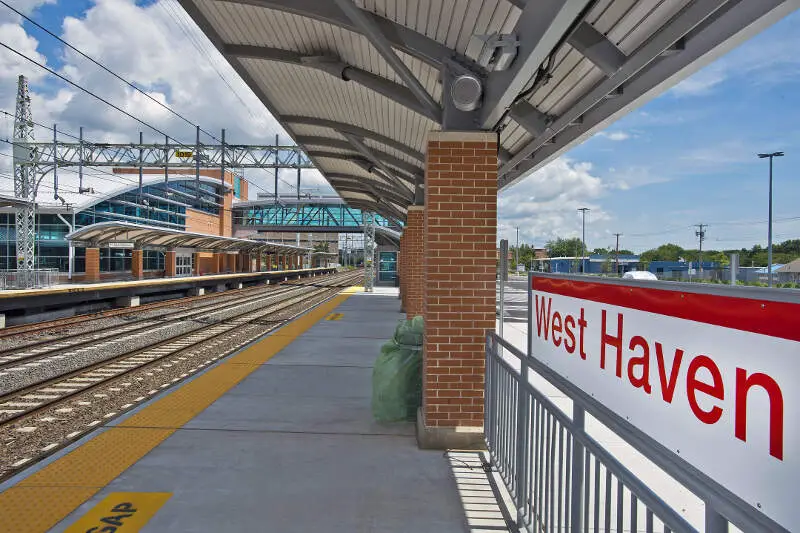
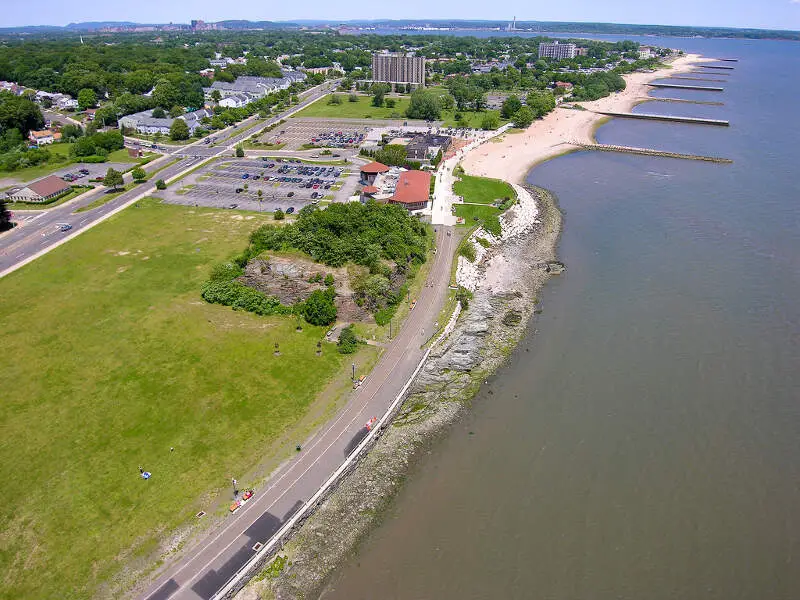
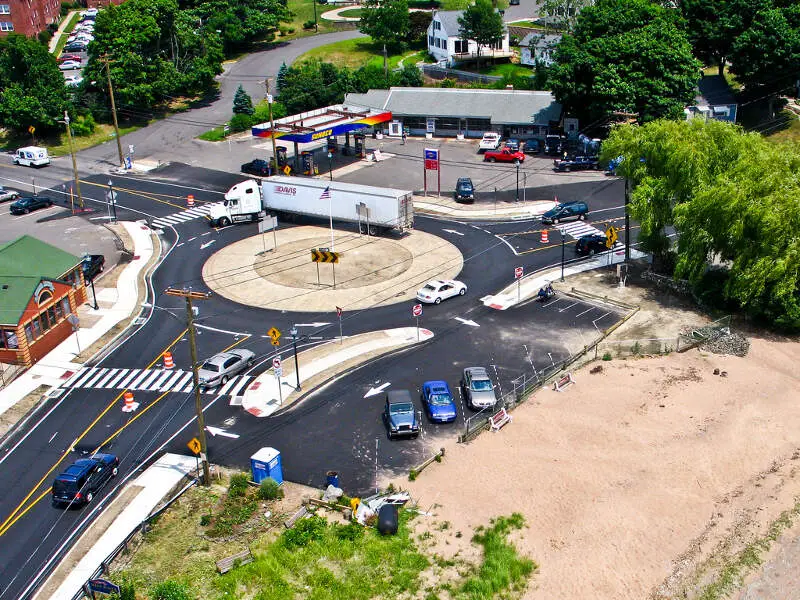
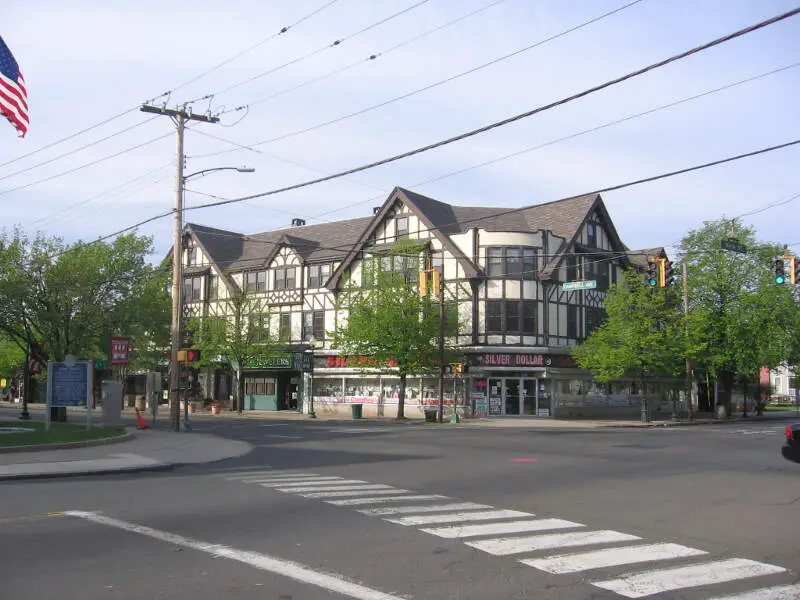
West Haven, CT Photos


Rankings for West Haven in Connecticut


Locations Around West Haven
Map Of West Haven, CT
Best Places Around West Haven
Orange, CT
Population 14,251
North Haven, CT
Population 24,177
Milford, CT
Population 50,749
Shelton, CT
Population 41,402
East Haven, CT
Population 27,729
Wallingford Center, CT
Population 18,107
Ansonia, CT
Population 18,951
Branford Center, CT
Population 6,130
West Haven Demographics And Statistics
Population over time in West Haven
The current population in West Haven is 55,147. The population has increased 0.1% from 2010.
| Year | Population | % Change |
|---|---|---|
| 2023 | 55,147 | -0.3% |
| 2022 | 55,336 | -0.3% |
| 2021 | 55,518 | 1.6% |
| 2020 | 54,666 | -0.2% |
| 2019 | 54,763 | -0.3% |
| 2018 | 54,918 | -0.2% |
| 2017 | 55,044 | 0.1% |
| 2016 | 54,972 | -0.4% |
| 2015 | 55,189 | -0.2% |
| 2014 | 55,290 | -0.1% |
| 2013 | 55,349 | -0.1% |
| 2012 | 55,386 | 0.2% |
| 2011 | 55,249 | 0.3% |
| 2010 | 55,070 | - |
Race / Ethnicity in West Haven
West Haven is:
46.7% White with 25,728 White residents.
18.2% African American with 10,019 African American residents.
0.1% American Indian with 76 American Indian residents.
4.7% Asian with 2,581 Asian residents.
0.1% Hawaiian with 59 Hawaiian residents.
0.9% Other with 488 Other residents.
2.9% Two Or More with 1,591 Two Or More residents.
26.5% Hispanic with 14,605 Hispanic residents.
| Race | West Haven | CT | USA |
|---|---|---|---|
| White | 46.7% | 63.0% | 58.2% |
| African American | 18.2% | 9.9% | 12.0% |
| American Indian | 0.1% | 0.1% | 0.5% |
| Asian | 4.7% | 4.7% | 5.7% |
| Hawaiian | 0.1% | 0.0% | 0.2% |
| Other | 0.9% | 0.7% | 0.5% |
| Two Or More | 2.9% | 3.8% | 3.9% |
| Hispanic | 26.5% | 17.8% | 19.0% |
Gender in West Haven
West Haven is 51.8% female with 28,579 female residents.
West Haven is 48.2% male with 26,568 male residents.
| Gender | West Haven | CT | USA |
|---|---|---|---|
| Female | 51.8% | 50.9% | 50.5% |
| Male | 48.2% | 49.1% | 49.5% |
Highest level of educational attainment in West Haven for adults over 25
6.0% of adults in West Haven completed < 9th grade.
6.0% of adults in West Haven completed 9-12th grade.
33.0% of adults in West Haven completed high school / ged.
19.0% of adults in West Haven completed some college.
7.0% of adults in West Haven completed associate's degree.
17.0% of adults in West Haven completed bachelor's degree.
9.0% of adults in West Haven completed master's degree.
2.0% of adults in West Haven completed professional degree.
1.0% of adults in West Haven completed doctorate degree.
| Education | West Haven | CT | USA |
|---|---|---|---|
| < 9th Grade | 6.0% | 3.0% | 5.0% |
| 9-12th Grade | 6.0% | 5.0% | 6.0% |
| High School / GED | 33.0% | 26.0% | 26.0% |
| Some College | 19.0% | 16.0% | 19.0% |
| Associate's Degree | 7.0% | 8.0% | 9.0% |
| Bachelor's Degree | 17.0% | 23.0% | 21.0% |
| Master's Degree | 9.0% | 14.0% | 10.0% |
| Professional Degree | 2.0% | 3.0% | 2.0% |
| Doctorate Degree | 1.0% | 2.0% | 2.0% |
Household Income For West Haven, Connecticut
5.6% of households in West Haven earn Less than $10,000.
2.4% of households in West Haven earn $10,000 to $14,999.
6.8% of households in West Haven earn $15,000 to $24,999.
7.5% of households in West Haven earn $25,000 to $34,999.
10.9% of households in West Haven earn $35,000 to $49,999.
17.9% of households in West Haven earn $50,000 to $74,999.
12.7% of households in West Haven earn $75,000 to $99,999.
18.4% of households in West Haven earn $100,000 to $149,999.
9.8% of households in West Haven earn $150,000 to $199,999.
8.0% of households in West Haven earn $200,000 or more.
| Income | West Haven | CT | USA |
|---|---|---|---|
| Less than $10,000 | 5.6% | 4.4% | 4.9% |
| $10,000 to $14,999 | 2.4% | 3.2% | 3.6% |
| $15,000 to $24,999 | 6.8% | 5.6% | 6.6% |
| $25,000 to $34,999 | 7.5% | 5.6% | 6.8% |
| $35,000 to $49,999 | 10.9% | 8.6% | 10.4% |
| $50,000 to $74,999 | 17.9% | 13.4% | 15.7% |
| $75,000 to $99,999 | 12.7% | 12.0% | 12.7% |
| $100,000 to $149,999 | 18.4% | 17.8% | 17.4% |
| $150,000 to $199,999 | 9.8% | 11.2% | 9.3% |
| $200,000 or more | 8.0% | 18.2% | 12.6% |


