Columbus SnackAbility
Overall SnackAbility
Cost of living in Columbus summary. We use data on the cost of living to determine how expensive it is to live in Columbus. Real estate prices drive most of the variance in cost of living around Georgia. Key points include:
The cost of living in Columbus is 96 with 100 being average.
The cost of living in Columbus is 1.0x lower than the national average.
The median home value in Columbus is $173,152.
The median income in Columbus is $58,073.
Columbus's Overall Cost Of Living
Lower Than The National Average
Cost Of Living In Columbus Comparison Table
| Living Expense | Columbus | Georgia | National Average |
|---|---|---|---|
| Overall | 96 | 95 | 100 |
| Services | 102 | 97 | 100 |
| Groceries | 100 | 99 | 100 |
| Health | 87 | 88 | 100 |
| Housing | 101 | 101 | 100 |
| Transportation | 96 | 104 | 100 |
| Utilities | 105 | 101 | 100 |
Source: Cost of living index, normalized to US average = 100
Columbus, GA Weather
The average high in Columbus is 75.9° and the average low is 53.1°.
There are 71.1 days of precipitation each year.
Expect an average of 47.6 inches of precipitation each year with 0.3 inches of snow.
| Stat | Columbus |
|---|---|
| Average Annual High | 75.9 |
| Average Annual Low | 53.1 |
| Annual Precipitation Days | 71.1 |
| Average Annual Precipitation | 47.6 |
| Average Annual Snowfall | 0.3 |
Average High
Days of Rain
Source: NOAA climate normals (30-year)
Columbus, GA Photos


2 Reviews & Comments About Columbus

It is a very boring town with not much going on for families. The public schools are run by Nazis.
The riverfront is dirty. My kids and I can't walk along the river without seeing trash and homeless people.
The crime in the area is actually increasing by murders ad robbery's every night. The schools in the area are slowly increasing with better teachers, better principals, and our very own performing arts school. There are lots of family fun things to do in the Columbus-Fort Benning area such as
Launch, Stars and Stripes, Hollywood Connection, Lakebottom Park, Chattohoochee Riverfront Park, and more. I still love Columbus mines the crime I have lived there for 7 years.
My favorite thing about Columbus is the River walk. It does flood very easily but I love the park it has a lot of things to do YOU CAN ZIP LINE ACROSS THE RIVER!!!
Rankings & Articles For Columbus


Locations Around Columbus
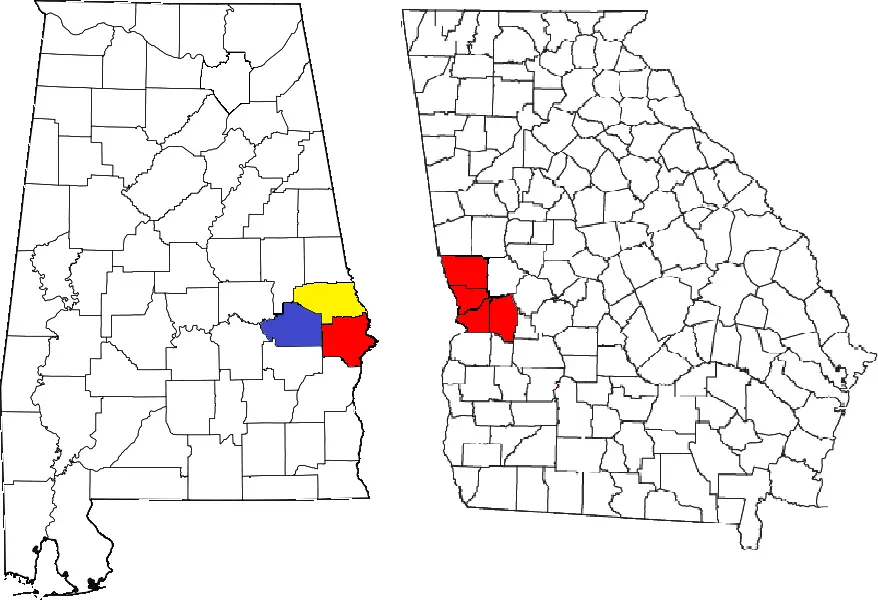
Map Of Columbus, GA
Best Places Around Columbus
Eufaula, AL
Population 12,584
Opelika, AL
Population 32,820
LaGrange, GA
Population 32,078
Americus, GA
Population 15,813
Auburn, AL
Population 80,594
Thomaston, GA
Population 9,831
Columbus Demographics And Statistics
Population over time in Columbus
The current population in Columbus is 203,711. The population has increased 8.6% from 2010.
| Year | Population | % Change |
|---|---|---|
| 2024 | 203,711 | -0.3% |
| 2023 | 204,383 | -0.1% |
| 2022 | 204,572 | 0.1% |
| 2021 | 204,366 | 4.6% |
| 2020 | 195,418 | -0.2% |
| 2019 | 195,739 | -0.5% |
| 2018 | 196,670 | -1.0% |
| 2017 | 198,647 | -0.8% |
| 2016 | 200,303 | 0.0% |
| 2015 | 200,285 | 1.0% |
| 2014 | 198,247 | 1.7% |
| 2013 | 194,949 | 1.9% |
| 2012 | 191,278 | 1.4% |
| 2011 | 188,548 | 0.5% |
| 2010 | 187,629 | - |
Race / Ethnicity in Columbus
See the full breakdown
Columbus is:
36.7% White with 74,833 White residents.
46.1% African American with 93,972 African American residents.
0.0% American Indian with 91 American Indian residents.
2.6% Asian with 5,257 Asian residents.
0.1% Hawaiian with 305 Hawaiian residents.
0.6% Other with 1,226 Other residents.
5.2% Two Or More with 10,670 Two Or More residents.
8.5% Hispanic with 17,357 Hispanic residents.
| Race | Columbus | GA | USA |
|---|---|---|---|
| White | 36.7% | 49.1% | 57.4% |
| African American | 46.1% | 30.7% | 11.9% |
| American Indian | 0.0% | 0.1% | 0.5% |
| Asian | 2.6% | 4.5% | 5.9% |
| Hawaiian | 0.1% | 0.1% | 0.2% |
| Other | 0.6% | 0.6% | 0.6% |
| Two Or More | 5.2% | 3.9% | 4.3% |
| Hispanic | 8.5% | 11.0% | 19.3% |
Gender in Columbus
See the full breakdown
Columbus is 51.9% female with 105,702 female residents.
Columbus is 48.1% male with 98,009 male residents.
| Gender | Columbus | GA | USA |
|---|---|---|---|
| Female | 51.9% | 51.2% | 50.5% |
| Male | 48.1% | 48.8% | 49.5% |
Highest level of educational attainment in Columbus for adults over 25
See the full breakdown
5.0% of adults in Columbus completed < 9th grade.
7.0% of adults in Columbus completed 9-12th grade.
27.0% of adults in Columbus completed high school / ged.
22.0% of adults in Columbus completed some college.
9.0% of adults in Columbus completed associate's degree.
18.0% of adults in Columbus completed bachelor's degree.
9.0% of adults in Columbus completed master's degree.
2.0% of adults in Columbus completed professional degree.
1.0% of adults in Columbus completed doctorate degree.
| Education | Columbus | GA | USA |
|---|---|---|---|
| < 9th Grade | 5.0% | 4.0% | 4.0% |
| 9-12th Grade | 7.0% | 7.0% | 6.0% |
| High School / GED | 27.0% | 27.0% | 26.0% |
| Some College | 22.0% | 19.0% | 19.0% |
| Associate's Degree | 9.0% | 8.0% | 9.0% |
| Bachelor's Degree | 18.0% | 21.0% | 22.0% |
| Master's Degree | 9.0% | 10.0% | 10.0% |
| Professional Degree | 2.0% | 2.0% | 2.0% |
| Doctorate Degree | 1.0% | 2.0% | 2.0% |
Household Income For Columbus, Georgia
See the full breakdown
8.8% of households in Columbus earn Less than $10,000.
4.7% of households in Columbus earn $10,000 to $14,999.
8.2% of households in Columbus earn $15,000 to $24,999.
9.2% of households in Columbus earn $25,000 to $34,999.
12.7% of households in Columbus earn $35,000 to $49,999.
18.5% of households in Columbus earn $50,000 to $74,999.
12.3% of households in Columbus earn $75,000 to $99,999.
13.7% of households in Columbus earn $100,000 to $149,999.
5.2% of households in Columbus earn $150,000 to $199,999.
6.6% of households in Columbus earn $200,000 or more.
| Income | Columbus | GA | USA |
|---|---|---|---|
| Less than $10,000 | 8.8% | 5.4% | 5.0% |
| $10,000 to $14,999 | 4.7% | 3.4% | 3.4% |
| $15,000 to $24,999 | 8.2% | 6.6% | 6.3% |
| $25,000 to $34,999 | 9.2% | 6.8% | 6.6% |
| $35,000 to $49,999 | 12.7% | 10.7% | 10.1% |
| $50,000 to $74,999 | 18.5% | 15.9% | 15.5% |
| $75,000 to $99,999 | 12.3% | 13.0% | 12.6% |
| $100,000 to $149,999 | 13.7% | 17.3% | 17.5% |
| $150,000 to $199,999 | 5.2% | 9.2% | 9.6% |
| $200,000 or more | 6.6% | 11.9% | 13.4% |
Source: U.S. Census ACS 5-year estimates (2024)


