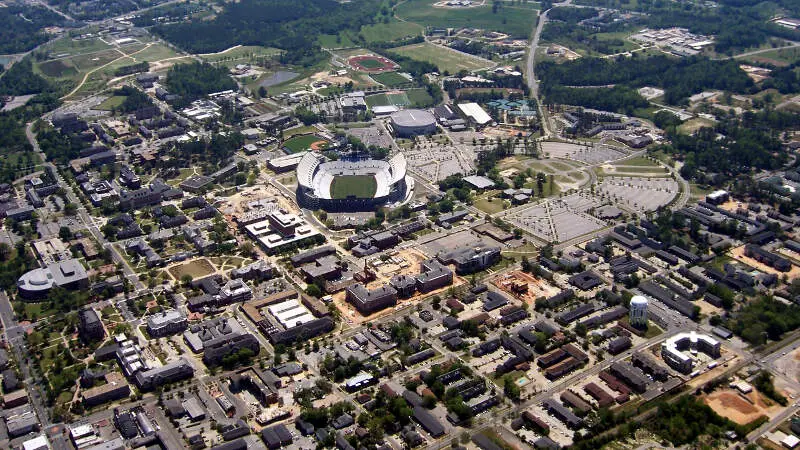
Auburn, AL
Demographics And Statistics
Living In Auburn, Alabama Summary
Life in Auburn research summary. HomeSnacks has been using Saturday Night Science to research the quality of life in Auburn over the past nine years using Census, FBI, Zillow, and other primary data sources. Based on the most recently available data, we found the following about life in Auburn:
The population in Auburn is 78,738.
The median home value in Auburn is $405,813.
The median income in Auburn is $56,123.
The cost of living in Auburn is 107 which is 1.1x higher than the national average.
The median rent in Auburn is $1,034.
The unemployment rate in Auburn is 3.8%.
The poverty rate in Auburn is 26.1%.
The average high in Auburn is 74.6° and the average low is 51.8°.
Auburn SnackAbility
Overall SnackAbility
Auburn, AL Crime Report
Crime in Auburn summary. We use data from the FBI to determine the crime rates in Auburn. Key points include:
There were 910 total crimes in Auburn in the last reporting year.
The overall crime rate per 100,000 people in Auburn is 1,086.5 / 100k people.
The violent crime rate per 100,000 people in Auburn is 107.5 / 100k people.
The property crime rate per 100,000 people in Auburn is 979.0 / 100k people.
Overall, crime in Auburn is -48.73% below the national average.
Total Crimes
Below National Average
Crime In Auburn Comparison Table
| Statistic | Count Raw |
Auburn / 100k People |
Alabama / 100k People |
National / 100k People |
|---|---|---|---|---|
| Total Crimes Per 100K | 910 | 1,086.5 | 1,924.9 | 2,119.2 |
| Violent Crime | 90 | 107.5 | 359.9 | 359.0 |
| Murder | 0 | 0.0 | 8.7 | 5.0 |
| Robbery | 8 | 9.6 | 34.0 | 61.0 |
| Aggravated Assault | 66 | 78.8 | 291.4 | 256.0 |
| Property Crime | 820 | 979.0 | 1,565.1 | 1,760.0 |
| Burglary | 33 | 39.4 | 243.5 | 229.0 |
| Larceny | 730 | 871.6 | 1,148.5 | 1,272.0 |
| Car Theft | 57 | 68.1 | 173.0 | 259.0 |
Auburn, AL Cost Of Living
Cost of living in Auburn summary. We use data on the cost of living to determine how expensive it is to live in Auburn. Real estate prices drive most of the variance in cost of living around Alabama. Key points include:
The cost of living in Auburn is 107 with 100 being average.
The cost of living in Auburn is 1.1x higher than the national average.
The median home value in Auburn is $405,813.
The median income in Auburn is $56,123.
Auburn's Overall Cost Of Living
Higher Than The National Average
Cost Of Living In Auburn Comparison Table
| Living Expense | Auburn | Alabama | National Average | |
|---|---|---|---|---|
| Overall | 107 | 90 | 100 | |
| Services | 96 | 97 | 100 | |
| Groceries | 97 | 98 | 100 | |
| Health | 93 | 86 | 100 | |
| Housing | 130 | 74 | 100 | |
| Transportation | 91 | 93 | 100 | |
| Utilities | 112 | 102 | 100 | |
Auburn, AL Weather
The average high in Auburn is 74.6° and the average low is 51.8°.
There are 74.5 days of precipitation each year.
Expect an average of 51.5 inches of precipitation each year with 0.5 inches of snow.
| Stat | Auburn |
|---|---|
| Average Annual High | 74.6 |
| Average Annual Low | 51.8 |
| Annual Precipitation Days | 74.5 |
| Average Annual Precipitation | 51.5 |
| Average Annual Snowfall | 0.5 |
Average High
Days of Rain
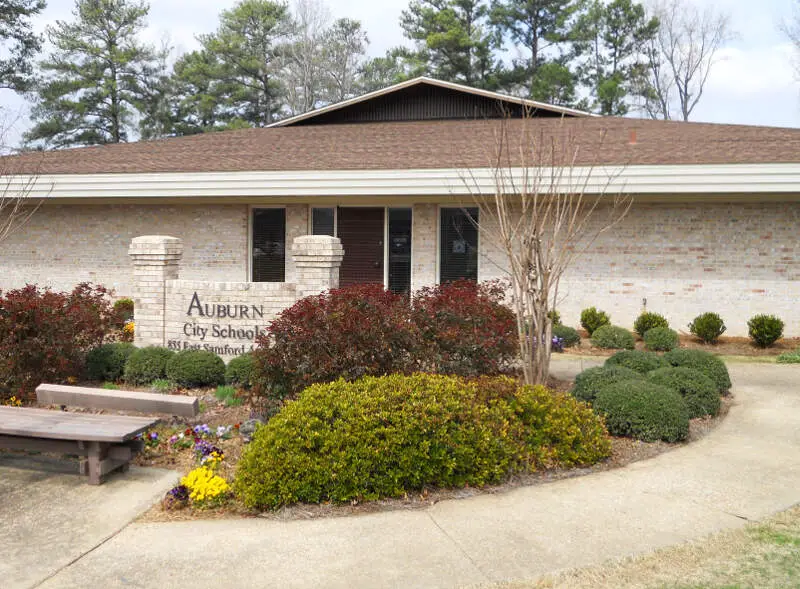
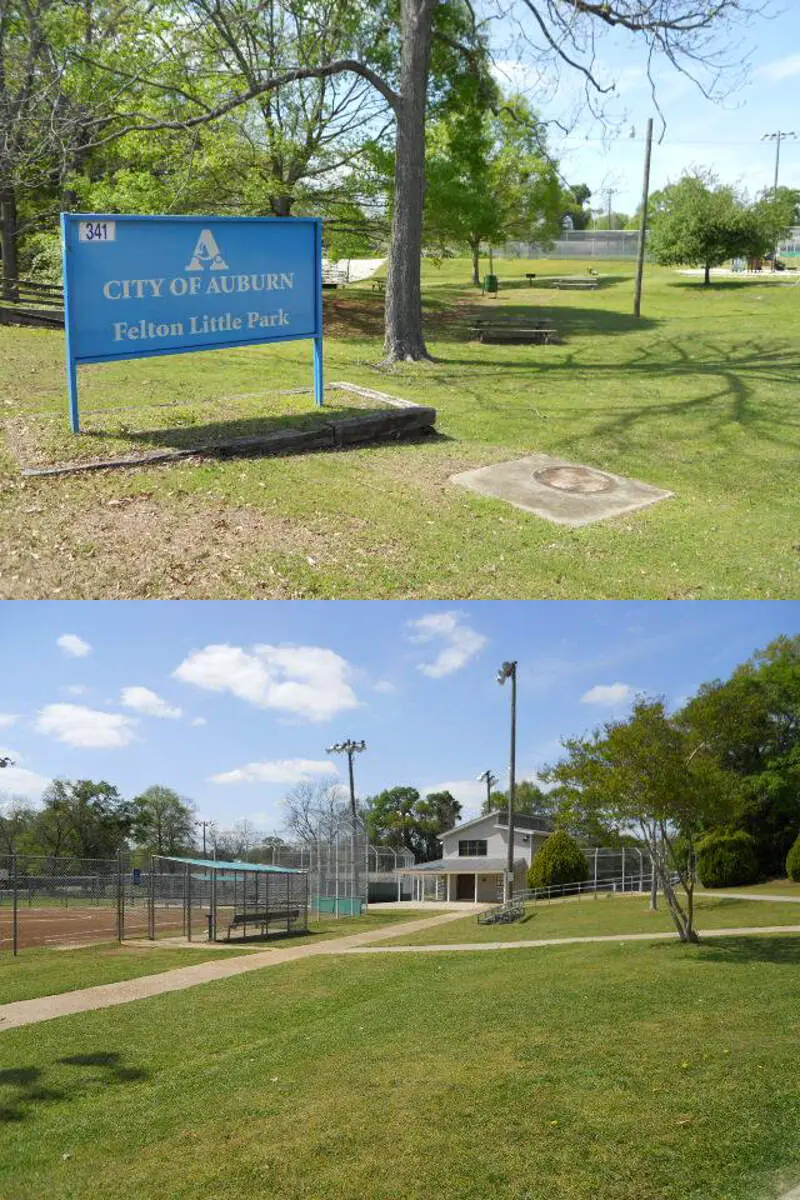
Auburn, AL Photos


1 Reviews & Comments About Auburn
/5

HomeSnacks User - 2018-07-15 15:45:27.755142
The university was excellent and provided a great experience for me overall. The small college town has a lot of life to it overall. Auburn, AL is proving to be a great place for college students in good time. That is worthwhile for anyone who wants to scope out the college town.
Affordable rent and low cost of living makes the city fun for everyone. Watch out for high crime areas in the city though. That could detract from the standard of living that people tend to enjoy.
Rankings for Auburn in Alabama


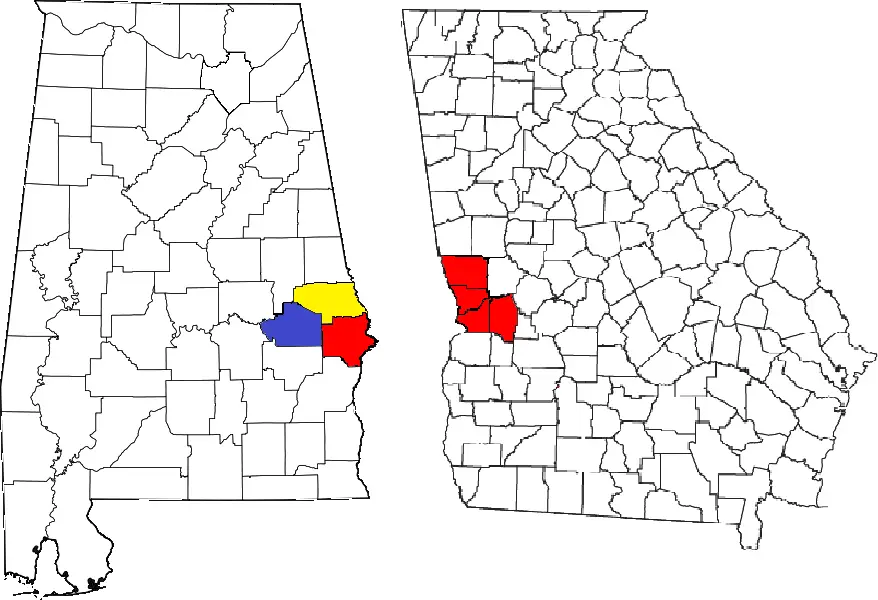
Locations Around Auburn
Map Of Auburn, AL
Best Places Around Auburn
Montgomery, AL
Population 198,440
Columbus, GA
Population 204,383
Opelika, AL
Population 31,944
LaGrange, GA
Population 31,479
Auburn Demographics And Statistics
Population over time in Auburn
The current population in Auburn is 78,738. The population has increased 54.2% from 2010.
| Year | Population | % Change |
|---|---|---|
| 2023 | 78,738 | 2.7% |
| 2022 | 76,660 | 2.7% |
| 2021 | 74,637 | 13.9% |
| 2020 | 65,508 | 2.3% |
| 2019 | 64,054 | 1.7% |
| 2018 | 62,996 | 2.5% |
| 2017 | 61,462 | 1.9% |
| 2016 | 60,318 | 2.8% |
| 2015 | 58,693 | 3.0% |
| 2014 | 56,986 | 2.9% |
| 2013 | 55,404 | 2.9% |
| 2012 | 53,817 | 3.0% |
| 2011 | 52,232 | 2.3% |
| 2010 | 51,057 | - |
Race / Ethnicity in Auburn
Auburn is:
65.7% White with 51,769 White residents.
18.6% African American with 14,684 African American residents.
0.1% American Indian with 51 American Indian residents.
8.4% Asian with 6,600 Asian residents.
0.0% Hawaiian with 21 Hawaiian residents.
0.3% Other with 222 Other residents.
2.1% Two Or More with 1,627 Two Or More residents.
4.8% Hispanic with 3,764 Hispanic residents.
| Race | Auburn | AL | USA |
|---|---|---|---|
| White | 65.7% | 63.8% | 58.2% |
| African American | 18.6% | 25.9% | 12.0% |
| American Indian | 0.1% | 0.3% | 0.5% |
| Asian | 8.4% | 1.4% | 5.7% |
| Hawaiian | 0.0% | 0.0% | 0.2% |
| Other | 0.3% | 0.3% | 0.5% |
| Two Or More | 2.1% | 2.9% | 3.9% |
| Hispanic | 4.8% | 5.4% | 19.0% |
Gender in Auburn
Auburn is 51.3% female with 40,407 female residents.
Auburn is 48.7% male with 38,330 male residents.
| Gender | Auburn | AL | USA |
|---|---|---|---|
| Female | 51.3% | 51.5% | 50.5% |
| Male | 48.7% | 48.5% | 49.5% |
Highest level of educational attainment in Auburn for adults over 25
0.0% of adults in Auburn completed < 9th grade.
3.0% of adults in Auburn completed 9-12th grade.
13.0% of adults in Auburn completed high school / ged.
14.0% of adults in Auburn completed some college.
7.0% of adults in Auburn completed associate's degree.
32.0% of adults in Auburn completed bachelor's degree.
20.0% of adults in Auburn completed master's degree.
3.0% of adults in Auburn completed professional degree.
8.0% of adults in Auburn completed doctorate degree.
| Education | Auburn | AL | USA |
|---|---|---|---|
| < 9th Grade | 0.0% | 4.0% | 5.0% |
| 9-12th Grade | 3.0% | 8.0% | 6.0% |
| High School / GED | 13.0% | 30.0% | 26.0% |
| Some College | 14.0% | 21.0% | 19.0% |
| Associate's Degree | 7.0% | 9.0% | 9.0% |
| Bachelor's Degree | 32.0% | 17.0% | 21.0% |
| Master's Degree | 20.0% | 8.0% | 10.0% |
| Professional Degree | 3.0% | 2.0% | 2.0% |
| Doctorate Degree | 8.0% | 1.0% | 2.0% |
Household Income For Auburn, Alabama
15.6% of households in Auburn earn Less than $10,000.
5.6% of households in Auburn earn $10,000 to $14,999.
8.9% of households in Auburn earn $15,000 to $24,999.
7.0% of households in Auburn earn $25,000 to $34,999.
9.3% of households in Auburn earn $35,000 to $49,999.
11.9% of households in Auburn earn $50,000 to $74,999.
9.2% of households in Auburn earn $75,000 to $99,999.
14.1% of households in Auburn earn $100,000 to $149,999.
8.3% of households in Auburn earn $150,000 to $199,999.
10.3% of households in Auburn earn $200,000 or more.
| Income | Auburn | AL | USA |
|---|---|---|---|
| Less than $10,000 | 15.6% | 6.3% | 4.9% |
| $10,000 to $14,999 | 5.6% | 5.0% | 3.6% |
| $15,000 to $24,999 | 8.9% | 9.2% | 6.6% |
| $25,000 to $34,999 | 7.0% | 8.7% | 6.8% |
| $35,000 to $49,999 | 9.3% | 12.2% | 10.4% |
| $50,000 to $74,999 | 11.9% | 16.8% | 15.7% |
| $75,000 to $99,999 | 9.2% | 12.5% | 12.7% |
| $100,000 to $149,999 | 14.1% | 15.2% | 17.4% |
| $150,000 to $199,999 | 8.3% | 7.1% | 9.3% |
| $200,000 or more | 10.3% | 7.2% | 12.6% |


