

Gayest places in Michigan research summary. We used Saturday Night Science to research the cities in Michigan with the highest percent of same-sex households for 2026. The data comes from the American Community Survey 2020-2024 5-year vintage, which counts same-sex married spouses and same-sex unmarried partners at the city level.
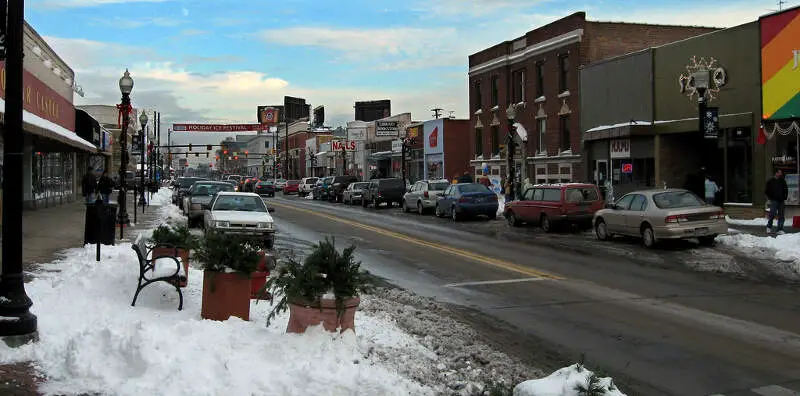
5.4% gay households · #1 gayest in Michigan
 Located in
Oakland County, Michigan
Located in
Oakland County, Michigan
Ferndale is a city in Oakland County of the U.S. state of Michigan. It forms part of the Detroit metropolitan area. As of the 2010 census, the city population was 19,900.
Data | Crime | Cost of living | Movers
5.1% gay households · #2 gayest in Michigan
3.6% gay households · #3 gayest in Michigan
3.3% gay households · #4 gayest in Michigan
 Located in
St. Clair County, Michigan
Located in
St. Clair County, Michigan
Data | Crime | Cost of living | Movers
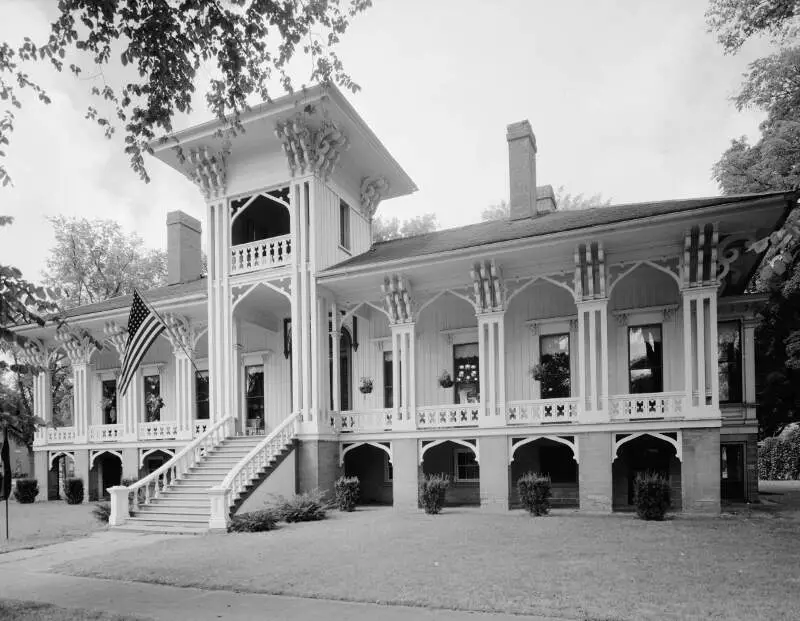
3.0% gay households · #5 gayest in Michigan
 Located in
Calhoun County, Michigan
Located in
Calhoun County, Michigan
Marshall is a city in the U.S. state of Michigan. It is part of the Battle Creek, Michigan Metropolitan Statistical Area. The population was 7,088 at the 2010 census. It is the county seat of Calhoun County. The town operates a student exchange program with its sister city, Kka, Japan.
Data | Crime | Cost of living | Movers
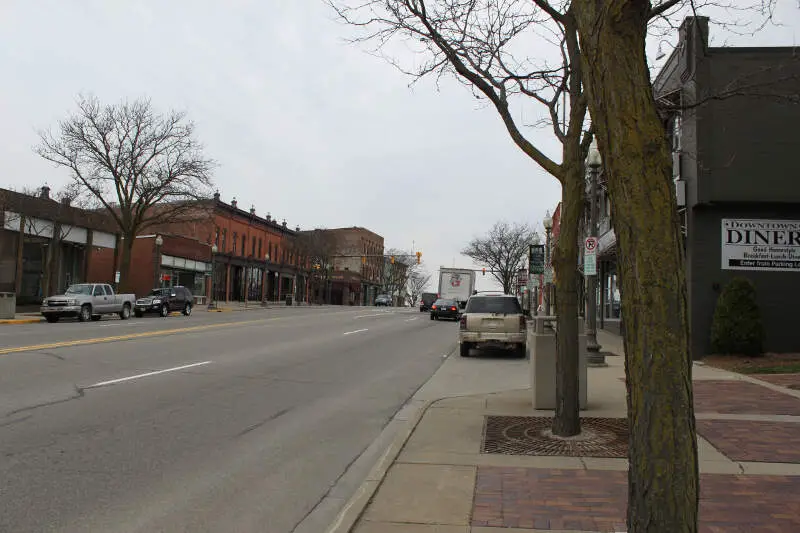
2.8% gay households · #6 gayest in Michigan
 Located in
Washtenaw County, Michigan
Located in
Washtenaw County, Michigan
Saline is a city in Washtenaw County in the U.S. state of Michigan. As of the 2010 census, the city population was 8,810.
Data | Crime | Cost of living | Movers
2.7% gay households · #7 gayest in Michigan
Data | Movers
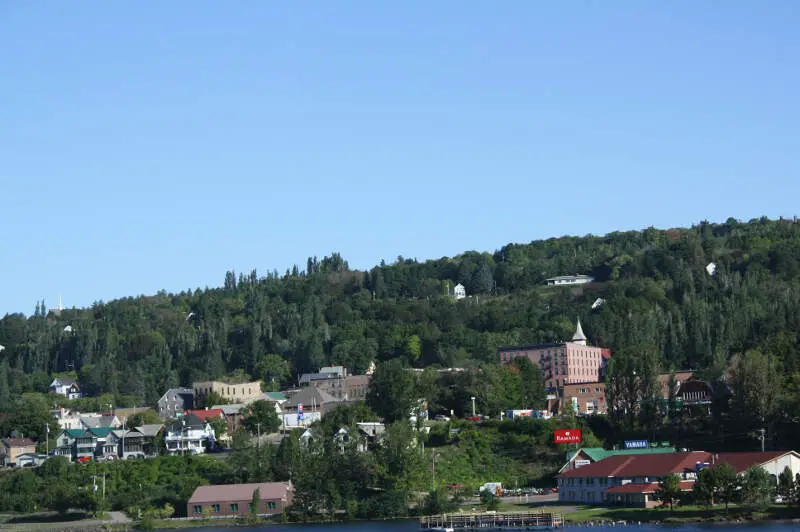
2.6% gay households · #8 gayest in Michigan
Data | Movers
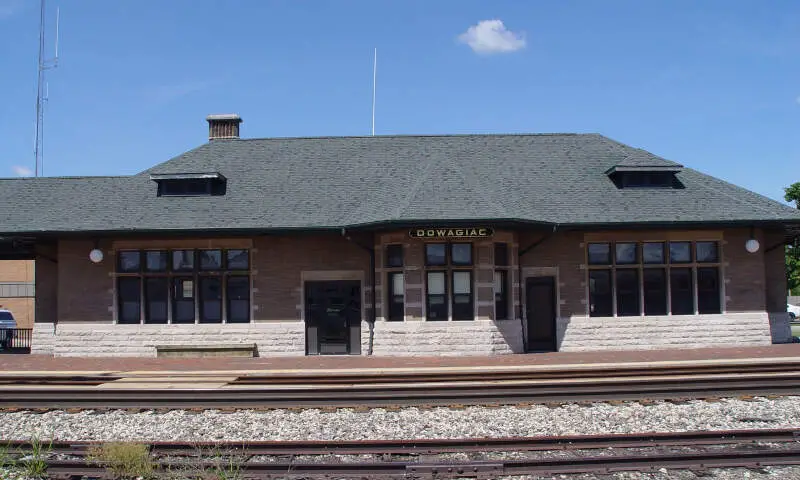
2.4% gay households · #9 gayest in Michigan
 Located in
Cass County, Michigan
Located in
Cass County, Michigan
Dowagiac is a city in Cass County in the U.S. state of Michigan. The population was 5,879 at the 2010 census. It is part of the South Bend-Mishawaka, IN-MI, Metropolitan Statistical Area.
Data | Crime | Cost of living | Movers
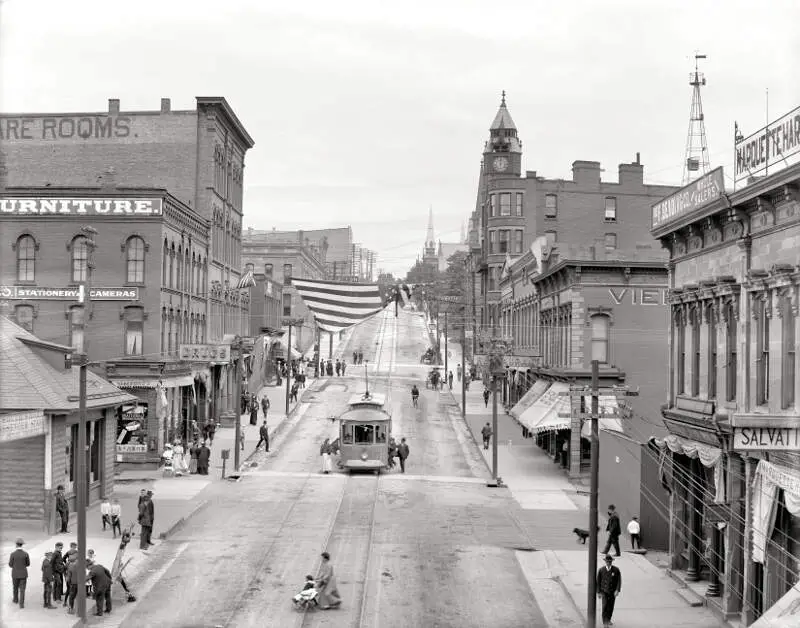
2.3% gay households · #10 gayest in Michigan
 Located in
Marquette County, Michigan
Located in
Marquette County, Michigan
Marquette is a city in the U.S. state of Michigan and the county seat of Marquette County. The population was 21,355 at the 2010 census, making it the largest city of the state’s Upper Peninsula. Marquette is a major port on Lake Superior, known primarily for shipping iron ore, and is the home of Northern Michigan University. In 2012, Marquette was listed among the 10 best places to retire in the U.S. by CBS MoneyWatch.
Data | Crime | Cost of living | Movers
The receipts
Compare the top ten
Pick a metric. The bars rescale. The red line is Michigan’s statewide median.
On the map
Where Michigan’s LGBTQ households are
Saturday Night Science
How we determined the gayest places in Michigan for 2026
In order to rank the gayest cities in Michigan, we used Saturday Night Science and the 2020-2024 American Community Survey 5-year estimates from the U.S. Census. We looked at:
- Percentage of all households that are unmarried, same-sex partners
We limited the analysis to non-CDPs that have over 1,000 households.
We ranked each place from 1 to 227 with the city containing the highest percentage of unmarried, same-sex partner households being the most gay.
In the end, Ferndale ended up being the most gay place with 5.4% gay households.
Skip to the end to see the list of all the places in the state from gayest to straightest.
We updated this report for 2026. This report is our eleventh time ranking the gayest places in Michigan.
The full plate
Gayest Places In Michigan
Click any column to sort. Search by city name.
| Rank | City | Households | LGBTQ Households | % Gay Households |
|---|---|---|---|---|
| 1 | Ferndale | 10,348 | 562 | 5.4% |
| 2 | Pleasant Ridge | 1,139 | 58 | 5.1% |
| 3 | Norway | 1,222 | 44 | 3.6% |
| 4 | Richmond | 2,456 | 81 | 3.3% |
| 5 | Marshall | 3,206 | 97 | 3.0% |
| 6 | Saline | 3,991 | 112 | 2.8% |
| 7 | Bad Axe | 1,355 | 36 | 2.7% |
| 8 | Hancock | 1,818 | 47 | 2.6% |
| 9 | Dowagiac | 2,565 | 61 | 2.4% |
| 10 | Marquette | 8,903 | 206 | 2.3% |
| 11 | River Rouge | 2,749 | 62 | 2.3% |
| 12 | Oak Park | 12,452 | 265 | 2.1% |
| 13 | Sault Ste. Marie | 5,860 | 122 | 2.1% |
| 14 | Lapeer | 3,701 | 77 | 2.1% |
| 15 | Fenton | 5,208 | 107 | 2.1% |
| 16 | Corunna | 1,476 | 30 | 2.0% |
| 17 | Wixom | 8,720 | 176 | 2.0% |
| 18 | New Baltimore | 4,703 | 91 | 1.9% |
| 19 | Wyandotte | 10,737 | 207 | 1.9% |
| 20 | Clio | 1,176 | 22 | 1.9% |
| 21 | Grosse Pointe Woods | 6,418 | 120 | 1.9% |
| 22 | Clare | 1,409 | 26 | 1.8% |
| 23 | Ypsilanti | 8,790 | 160 | 1.8% |
| 24 | North Muskegon | 1,590 | 28 | 1.8% |
| 25 | Highland Park | 3,825 | 65 | 1.7% |
| 26 | Petoskey | 2,648 | 44 | 1.7% |
| 27 | Center Line | 3,713 | 60 | 1.6% |
| 28 | Harper Woods | 5,595 | 90 | 1.6% |
| 29 | Iron Mountain | 3,582 | 57 | 1.6% |
| 30 | Alpena | 5,088 | 80 | 1.6% |
| 31 | Kalamazoo | 29,523 | 464 | 1.6% |
| 32 | Royal Oak | 29,110 | 454 | 1.6% |
| 33 | St. Ignace | 1,171 | 18 | 1.5% |
| 34 | Niles | 5,016 | 77 | 1.5% |
| 35 | Grosse Pointe Park | 4,586 | 70 | 1.5% |
| 36 | Howell | 4,862 | 73 | 1.5% |
| 37 | Rockwood | 1,273 | 19 | 1.5% |
| 38 | Rogers City | 1,619 | 24 | 1.5% |
| 39 | Burton | 12,432 | 183 | 1.5% |
| 40 | Otsego | 1,511 | 22 | 1.5% |
| 41 | West Branch | 1,056 | 15 | 1.4% |
| 42 | Bay City | 14,677 | 187 | 1.3% |
| 43 | Kentwood | 21,245 | 270 | 1.3% |
| 44 | Grand Rapids | 80,222 | 1,011 | 1.3% |
| 45 | Ann Arbor | 50,499 | 621 | 1.2% |
| 46 | Lansing | 51,588 | 627 | 1.2% |
| 47 | Owosso | 6,320 | 75 | 1.2% |
| 48 | New Haven | 1,989 | 23 | 1.2% |
| 49 | Saginaw | 17,789 | 204 | 1.1% |
| 50 | Troy | 33,372 | 372 | 1.1% |
| 51 | Grand Ledge | 3,578 | 39 | 1.1% |
| 52 | Chelsea | 2,764 | 30 | 1.1% |
| 53 | Berkley | 6,840 | 73 | 1.1% |
| 54 | Ishpeming | 2,514 | 26 | 1.0% |
| 55 | Northville | 2,620 | 27 | 1.0% |
| 56 | Port Huron | 12,734 | 130 | 1.0% |
| 57 | Davison | 2,377 | 24 | 1.0% |
| 58 | Mount Clemens | 6,783 | 68 | 1.0% |
| 59 | Essexville | 1,311 | 13 | 1.0% |
| 60 | South Lyon | 4,976 | 49 | 1.0% |
| 61 | Plymouth | 4,185 | 41 | 1.0% |
| 62 | Franklin | 1,032 | 10 | 1.0% |
| 63 | Clawson | 5,680 | 55 | 1.0% |
| 64 | Traverse City | 7,191 | 65 | 0.9% |
| 65 | Kalkaska | 1,118 | 10 | 0.9% |
| 66 | Milan | 2,605 | 23 | 0.9% |
| 67 | Flushing | 3,629 | 32 | 0.9% |
| 68 | Hamtramck | 7,120 | 62 | 0.9% |
| 69 | Cedar Springs | 1,495 | 13 | 0.9% |
| 70 | Lathrup Village | 1,611 | 14 | 0.9% |
| 71 | Portage | 20,844 | 179 | 0.9% |
| 72 | Westland | 35,932 | 307 | 0.9% |
| 73 | Reed City | 1,069 | 9 | 0.8% |
| 74 | Zeeland | 2,396 | 20 | 0.8% |
| 75 | Ecorse | 3,614 | 29 | 0.8% |
| 76 | Manistique | 1,521 | 12 | 0.8% |
| 77 | Eastpointe | 13,251 | 104 | 0.8% |
| 78 | Oxford | 1,538 | 12 | 0.8% |
| 79 | Caro | 1,945 | 15 | 0.8% |
| 80 | Blissfield | 1,306 | 10 | 0.8% |
| 81 | Hazel Park | 6,804 | 52 | 0.8% |
| 82 | Detroit | 257,998 | 1,943 | 0.8% |
| 83 | Coldwater | 4,458 | 33 | 0.7% |
| 84 | Cheboygan | 2,164 | 16 | 0.7% |
| 85 | Melvindale | 4,250 | 31 | 0.7% |
| 86 | Battle Creek | 21,128 | 154 | 0.7% |
| 87 | Grand Haven | 5,510 | 40 | 0.7% |
| 88 | Williamston | 1,794 | 13 | 0.7% |
| 89 | Wyoming | 29,417 | 213 | 0.7% |
| 90 | Milford | 2,627 | 19 | 0.7% |
| 91 | Southgate | 12,553 | 89 | 0.7% |
| 92 | Belding | 2,157 | 15 | 0.7% |
| 93 | Mount Pleasant | 7,872 | 54 | 0.7% |
| 94 | Iron River | 1,314 | 9 | 0.7% |
| 95 | Trenton | 7,888 | 54 | 0.7% |
| 96 | Utica | 2,489 | 17 | 0.7% |
| 97 | Portland | 1,611 | 11 | 0.7% |
| 98 | Warren | 54,744 | 364 | 0.7% |
| 99 | Wayland | 1,661 | 11 | 0.7% |
| 100 | Birmingham | 9,440 | 62 | 0.7% |
Source: U.S. Census ACS 2020-2024. Places with over 1,000 households.
Summary
There You Have It – The Most LGBT Friendly Cities In Michigan For 2026
If you’re looking at the number of gay households in Michigan, this is an accurate list.
The gayest cities in Michigan are Ferndale, Pleasant Ridge, Norway, Richmond, Marshall, Saline, Bad Axe, Hancock, Dowagiac, and Marquette. Not sold on Michigan? Take the two-minute Find Your Place quiz and see which state actually fits you.
Questions and answers
Gayest Places In Michigan FAQs
What is the gayest city in Michigan?
Ferndale is the gayest place in Michigan for 2026, with same-sex couples making up 5.4% of households. Pleasant Ridge and Norway are next.
What are the gayest places in Michigan?
The gayest places in Michigan are Ferndale, Pleasant Ridge, Norway, Richmond, Marshall, Saline, Bad Axe, Hancock, Dowagiac, and Marquette. We ranked all 227 places with over 1,000 households by their share of same-sex partner households.
How do you measure the gayest places?
The Census does not ask about sexual orientation, so we use the closest thing it tracks: the share of households headed by same-sex partners, from the American Community Survey. It undercounts single LGBT residents, but it is consistent from place to place.
What is the straightest place in Michigan?
Almont is the straightest place in Michigan by this measure, with same-sex couples at 0.0% of households. It anchors the other end of the ranking.
Does a town have to be big to make the list?
No. Any Michigan place with more than 1,000 households qualifies, and 227 made the cut this year. Small towns can and do out-rank the big cities on this one.



