Chillicothe, IL
Demographics And Statistics
Living In Chillicothe, Illinois Summary
Life in Chillicothe research summary. HomeSnacks has been using Saturday Night Science to research the quality of life in Chillicothe over the past nine years using Census, FBI, Zillow, and other primary data sources. Based on the most recently available data, we found the following about life in Chillicothe:
The population in Chillicothe is 6,185.
The median home value in Chillicothe is $179,783.
The median income in Chillicothe is $62,108.
The cost of living in Chillicothe is 86 which is 0.9x lower than the national average.
The median rent in Chillicothe is $798.
The unemployment rate in Chillicothe is 5.7%.
The poverty rate in Chillicothe is 14.5%.
The average high in Chillicothe is 61.3° and the average low is 41.0°.
Chillicothe SnackAbility
Overall SnackAbility
Chillicothe, IL Crime Report
Crime in Chillicothe summary. We use data from the FBI to determine the crime rates in Chillicothe. Key points include:
There were 65 total crimes in Chillicothe in the last reporting year.
The overall crime rate per 100,000 people in Chillicothe is 1,095.4 / 100k people.
The violent crime rate per 100,000 people in Chillicothe is 151.7 / 100k people.
The property crime rate per 100,000 people in Chillicothe is 943.7 / 100k people.
Overall, crime in Chillicothe is -48.31% below the national average.
Total Crimes
Below National Average
Crime In Chillicothe Comparison Table
| Statistic | Count Raw |
Chillicothe / 100k People |
Illinois / 100k People |
National / 100k People |
|---|---|---|---|---|
| Total Crimes Per 100K | 65 | 1,095.4 | 2,004.4 | 2,119.2 |
| Violent Crime | 9 | 151.7 | 289.2 | 359.0 |
| Murder | 0 | 0.0 | 5.8 | 5.0 |
| Robbery | 0 | 0.0 | 90.2 | 61.0 |
| Aggravated Assault | 6 | 101.1 | 146.3 | 256.0 |
| Property Crime | 56 | 943.7 | 1,715.2 | 1,760.0 |
| Burglary | 9 | 151.7 | 290.5 | 229.0 |
| Larceny | 44 | 741.5 | 1,134.4 | 1,272.0 |
| Car Theft | 3 | 50.6 | 290.4 | 259.0 |
Chillicothe, IL Cost Of Living
Cost of living in Chillicothe summary. We use data on the cost of living to determine how expensive it is to live in Chillicothe. Real estate prices drive most of the variance in cost of living around Illinois. Key points include:
The cost of living in Chillicothe is 86 with 100 being average.
The cost of living in Chillicothe is 0.9x lower than the national average.
The median home value in Chillicothe is $179,783.
The median income in Chillicothe is $62,108.
Chillicothe's Overall Cost Of Living
Lower Than The National Average
Cost Of Living In Chillicothe Comparison Table
| Living Expense | Chillicothe | Illinois | National Average | |
|---|---|---|---|---|
| Overall | 86 | 97 | 100 | |
| Services | 95 | 95 | 100 | |
| Groceries | 97 | 99 | 100 | |
| Health | 86 | 93 | 100 | |
| Housing | 68 | 95 | 100 | |
| Transportation | 103 | 102 | 100 | |
| Utilities | 92 | 91 | 100 | |
Chillicothe, IL Weather
The average high in Chillicothe is 61.3° and the average low is 41.0°.
There are 69.2 days of precipitation each year.
Expect an average of 36.7 inches of precipitation each year with 22.4 inches of snow.
| Stat | Chillicothe |
|---|---|
| Average Annual High | 61.3 |
| Average Annual Low | 41.0 |
| Annual Precipitation Days | 69.2 |
| Average Annual Precipitation | 36.7 |
| Average Annual Snowfall | 22.4 |
Average High
Days of Rain
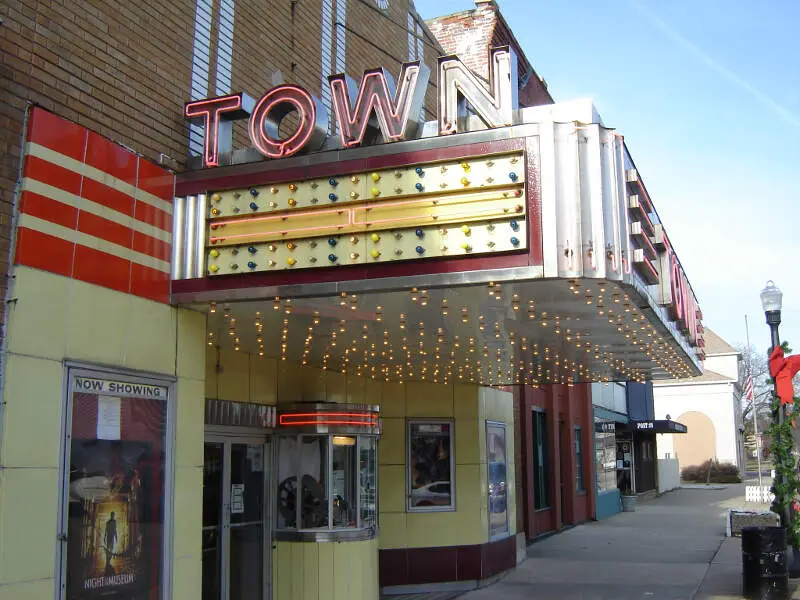
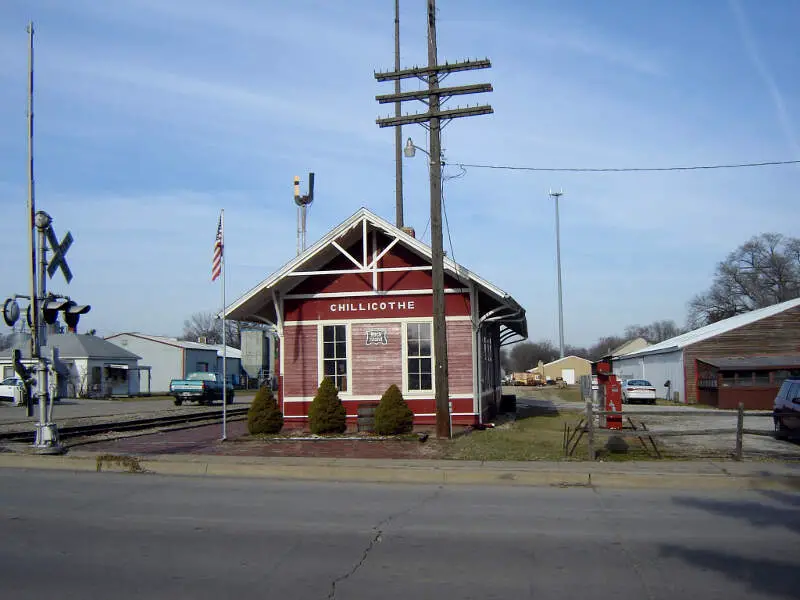
Chillicothe, IL Photos

1 Reviews & Comments About Chillicothe
/5

HomeSnacks User - 2018-09-06 03:32:47.227392
The crime was very low in Chillicothe. The schools are nice and quiet. There is a movie theater, grocery stores, and cozy restaurants. There is also a free gym with a hot tub, sauna room, swimming pool and track. There are many forests to hike in. It is very peaceful and calm there.
My favorite places are the forests and hiking trails. I really enjoy the kind people that live there. It is a great place to unwind. My favorite event is the Summer Camp Music Festival every year at Three Sisters Park. The only problem is it may be a boring place to some.
Rankings for Chillicothe in Illinois


Locations Around Chillicothe
Map Of Chillicothe, IL
Best Places Around Chillicothe
Washington, IL
Population 15,946
Eureka, IL
Population 5,095
East Peoria, IL
Population 22,485
Peoria Heights, IL
Population 5,834
Peoria, IL
Population 112,126
Chillicothe Demographics And Statistics
Population over time in Chillicothe
The current population in Chillicothe is 6,185. The population has decreased -1.3% from 2010.
| Year | Population | % Change |
|---|---|---|
| 2023 | 6,185 | 0.9% |
| 2022 | 6,130 | -2.3% |
| 2021 | 6,272 | -0.9% |
| 2020 | 6,326 | 1.7% |
| 2019 | 6,218 | 1.4% |
| 2018 | 6,135 | -1.3% |
| 2017 | 6,214 | 0.7% |
| 2016 | 6,169 | 1.3% |
| 2015 | 6,092 | -1.4% |
| 2014 | 6,181 | -0.3% |
| 2013 | 6,202 | 1.0% |
| 2012 | 6,139 | 0.4% |
| 2011 | 6,116 | -2.4% |
| 2010 | 6,268 | - |
Race / Ethnicity in Chillicothe
Chillicothe is:
86.0% White with 5,317 White residents.
1.7% African American with 107 African American residents.
0.0% American Indian with 0 American Indian residents.
0.5% Asian with 32 Asian residents.
0.0% Hawaiian with 0 Hawaiian residents.
0.0% Other with 0 Other residents.
8.8% Two Or More with 545 Two Or More residents.
3.0% Hispanic with 184 Hispanic residents.
| Race | Chillicothe | IL | USA |
|---|---|---|---|
| White | 86.0% | 58.7% | 58.2% |
| African American | 1.7% | 13.6% | 12.0% |
| American Indian | 0.0% | 0.1% | 0.5% |
| Asian | 0.5% | 5.8% | 5.7% |
| Hawaiian | 0.0% | 0.0% | 0.2% |
| Other | 0.0% | 0.3% | 0.5% |
| Two Or More | 8.8% | 3.0% | 3.9% |
| Hispanic | 3.0% | 18.5% | 19.0% |
Gender in Chillicothe
Chillicothe is 55.0% female with 3,404 female residents.
Chillicothe is 45.0% male with 2,781 male residents.
| Gender | Chillicothe | IL | USA |
|---|---|---|---|
| Female | 55.0% | 50.6% | 50.5% |
| Male | 45.0% | 49.4% | 49.5% |
Highest level of educational attainment in Chillicothe for adults over 25
1.0% of adults in Chillicothe completed < 9th grade.
2.0% of adults in Chillicothe completed 9-12th grade.
35.0% of adults in Chillicothe completed high school / ged.
24.0% of adults in Chillicothe completed some college.
12.0% of adults in Chillicothe completed associate's degree.
20.0% of adults in Chillicothe completed bachelor's degree.
6.0% of adults in Chillicothe completed master's degree.
0.0% of adults in Chillicothe completed professional degree.
0.0% of adults in Chillicothe completed doctorate degree.
| Education | Chillicothe | IL | USA |
|---|---|---|---|
| < 9th Grade | 1.0% | 5.0% | 5.0% |
| 9-12th Grade | 2.0% | 5.0% | 6.0% |
| High School / GED | 35.0% | 25.0% | 26.0% |
| Some College | 24.0% | 20.0% | 19.0% |
| Associate's Degree | 12.0% | 8.0% | 9.0% |
| Bachelor's Degree | 20.0% | 22.0% | 21.0% |
| Master's Degree | 6.0% | 11.0% | 10.0% |
| Professional Degree | 0.0% | 2.0% | 2.0% |
| Doctorate Degree | 0.0% | 2.0% | 2.0% |
Household Income For Chillicothe, Illinois
1.4% of households in Chillicothe earn Less than $10,000.
3.9% of households in Chillicothe earn $10,000 to $14,999.
6.6% of households in Chillicothe earn $15,000 to $24,999.
6.1% of households in Chillicothe earn $25,000 to $34,999.
11.6% of households in Chillicothe earn $35,000 to $49,999.
29.1% of households in Chillicothe earn $50,000 to $74,999.
18.8% of households in Chillicothe earn $75,000 to $99,999.
11.5% of households in Chillicothe earn $100,000 to $149,999.
5.6% of households in Chillicothe earn $150,000 to $199,999.
5.5% of households in Chillicothe earn $200,000 or more.
| Income | Chillicothe | IL | USA |
|---|---|---|---|
| Less than $10,000 | 1.4% | 5.2% | 4.9% |
| $10,000 to $14,999 | 3.9% | 3.4% | 3.6% |
| $15,000 to $24,999 | 6.6% | 6.2% | 6.6% |
| $25,000 to $34,999 | 6.1% | 6.5% | 6.8% |
| $35,000 to $49,999 | 11.6% | 9.9% | 10.4% |
| $50,000 to $74,999 | 29.1% | 15.1% | 15.7% |
| $75,000 to $99,999 | 18.8% | 12.7% | 12.7% |
| $100,000 to $149,999 | 11.5% | 17.9% | 17.4% |
| $150,000 to $199,999 | 5.6% | 9.9% | 9.3% |
| $200,000 or more | 5.5% | 13.1% | 12.6% |


