Geneva, IL
Demographics And Statistics
Living In Geneva, Illinois Summary
Life in Geneva research summary. HomeSnacks has been using Saturday Night Science to research the quality of life in Geneva over the past nine years using Census, FBI, Zillow, and other primary data sources. Based on the most recently available data, we found the following about life in Geneva:
The population in Geneva is 21,299.
The median home value in Geneva is $518,616.
The median income in Geneva is $136,621.
The cost of living in Geneva is 126 which is 1.3x higher than the national average.
The median rent in Geneva is $1,805.
The unemployment rate in Geneva is 1.7%.
The poverty rate in Geneva is 2.5%.
The average high in Geneva is 58.6° and the average low is 38.5°.
Geneva SnackAbility
Overall SnackAbility
Geneva, IL Crime Report
Crime in Geneva summary. We use data from the FBI to determine the crime rates in Geneva. Key points include:
There were 123 total crimes in Geneva in the last reporting year.
The overall crime rate per 100,000 people in Geneva is 584.2 / 100k people.
The violent crime rate per 100,000 people in Geneva is 61.7 / 100k people.
The property crime rate per 100,000 people in Geneva is 522.4 / 100k people.
Overall, crime in Geneva is -72.44% below the national average.
Total Crimes
Below National Average
Crime In Geneva Comparison Table
| Statistic | Count Raw |
Geneva / 100k People |
Illinois / 100k People |
National / 100k People |
|---|---|---|---|---|
| Total Crimes Per 100K | 123 | 584.2 | 2,004.4 | 2,119.2 |
| Violent Crime | 13 | 61.7 | 289.2 | 359.0 |
| Murder | 2 | 9.5 | 5.8 | 5.0 |
| Robbery | 0 | 0.0 | 90.2 | 61.0 |
| Aggravated Assault | 5 | 23.7 | 146.3 | 256.0 |
| Property Crime | 110 | 522.4 | 1,715.2 | 1,760.0 |
| Burglary | 6 | 28.5 | 290.5 | 229.0 |
| Larceny | 100 | 474.9 | 1,134.4 | 1,272.0 |
| Car Theft | 4 | 19.0 | 290.4 | 259.0 |
Geneva, IL Cost Of Living
Cost of living in Geneva summary. We use data on the cost of living to determine how expensive it is to live in Geneva. Real estate prices drive most of the variance in cost of living around Illinois. Key points include:
The cost of living in Geneva is 126 with 100 being average.
The cost of living in Geneva is 1.3x higher than the national average.
The median home value in Geneva is $518,616.
The median income in Geneva is $136,621.
Geneva's Overall Cost Of Living
Higher Than The National Average
Cost Of Living In Geneva Comparison Table
| Living Expense | Geneva | Illinois | National Average | |
|---|---|---|---|---|
| Overall | 126 | 97 | 100 | |
| Services | 107 | 95 | 100 | |
| Groceries | 96 | 99 | 100 | |
| Health | 99 | 93 | 100 | |
| Housing | 181 | 95 | 100 | |
| Transportation | 115 | 102 | 100 | |
| Utilities | 82 | 91 | 100 | |
Geneva, IL Weather
The average high in Geneva is 58.6° and the average low is 38.5°.
There are 70.7 days of precipitation each year.
Expect an average of 35.9 inches of precipitation each year with 30.0 inches of snow.
| Stat | Geneva |
|---|---|
| Average Annual High | 58.6 |
| Average Annual Low | 38.5 |
| Annual Precipitation Days | 70.7 |
| Average Annual Precipitation | 35.9 |
| Average Annual Snowfall | 30.0 |
Average High
Days of Rain
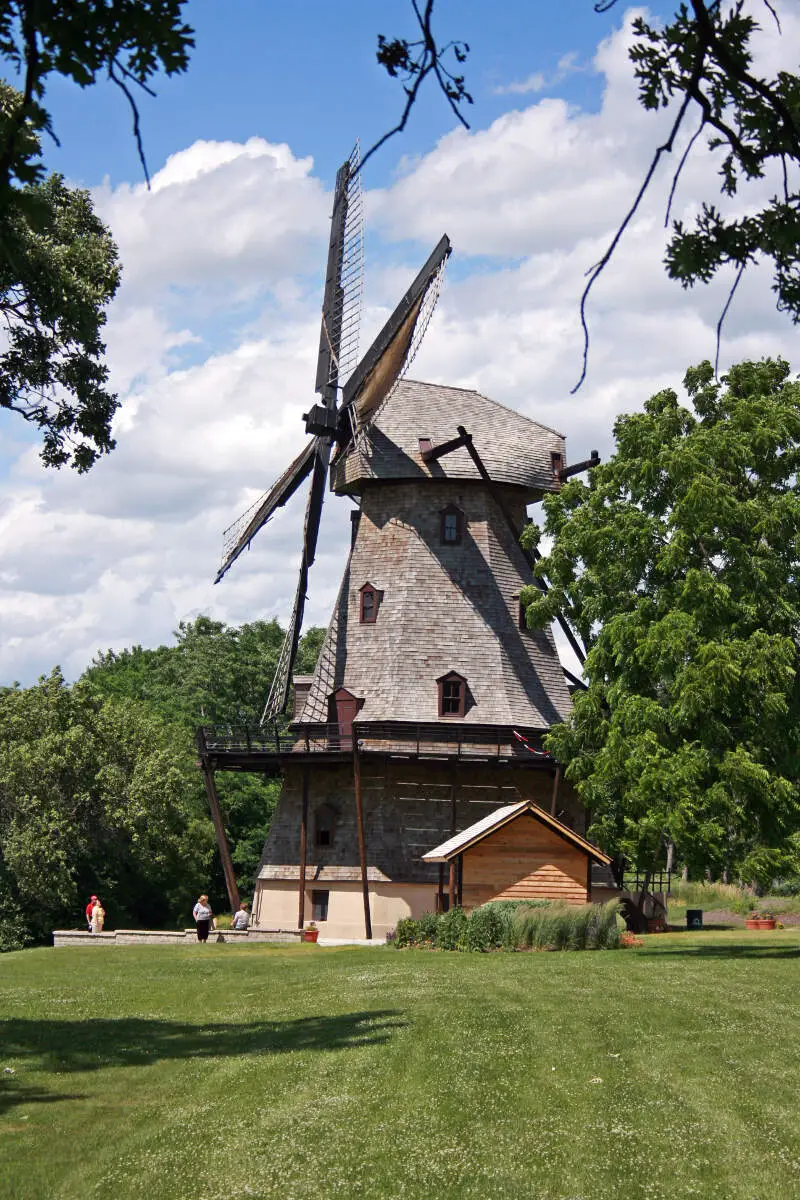
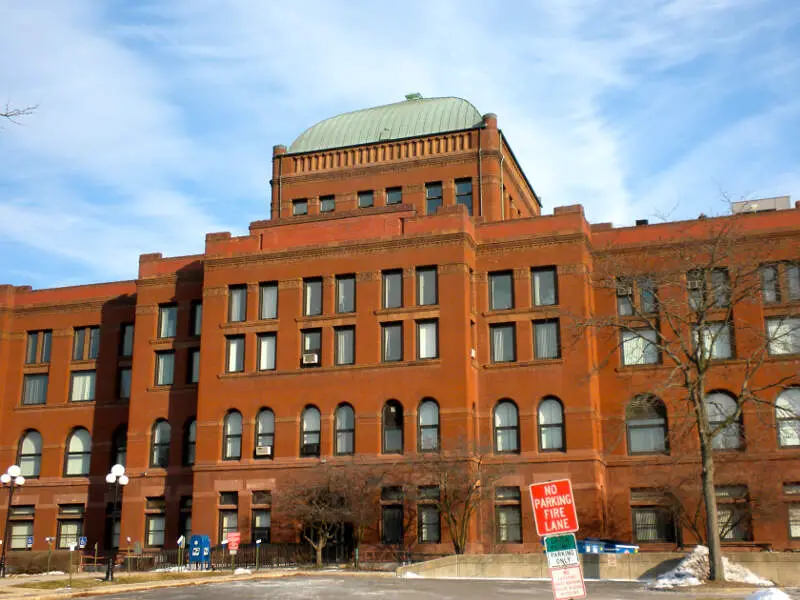
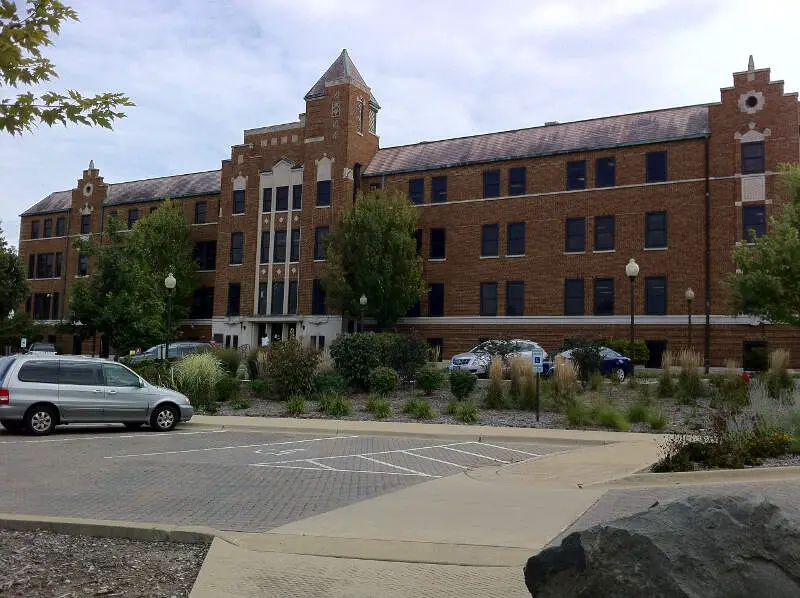
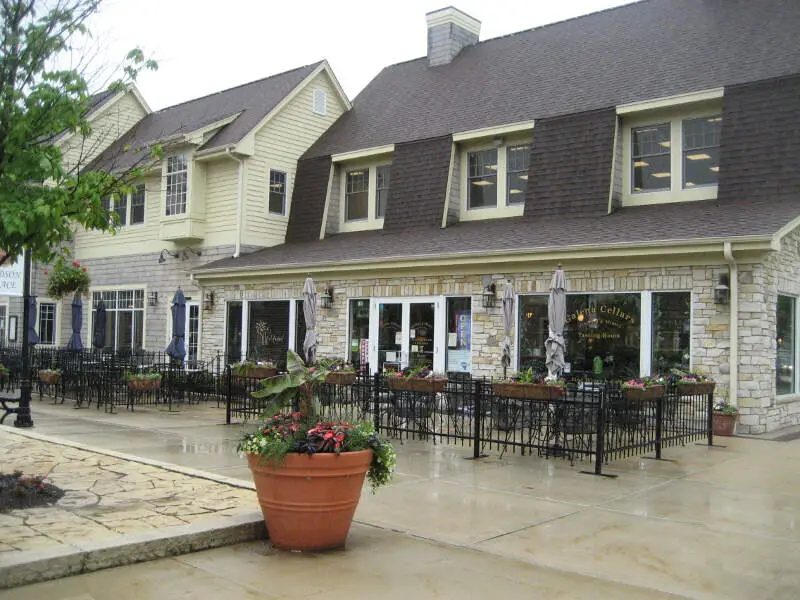
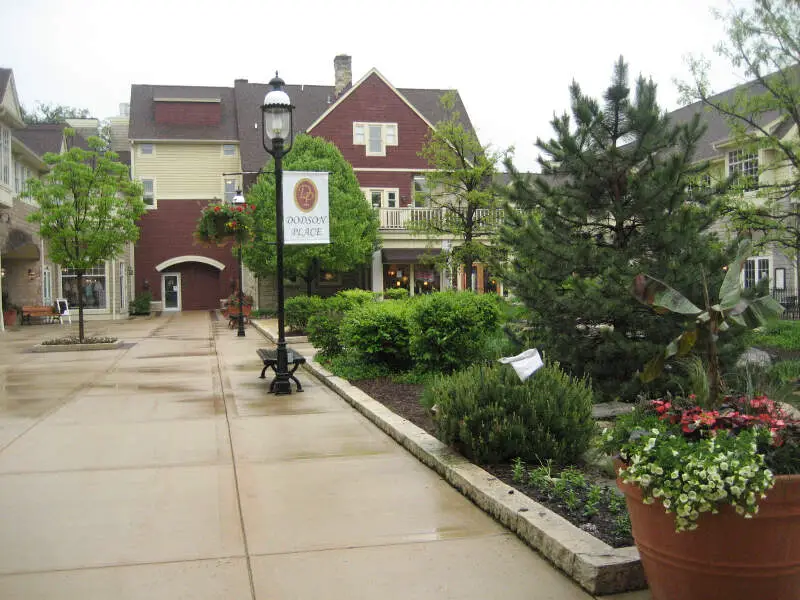
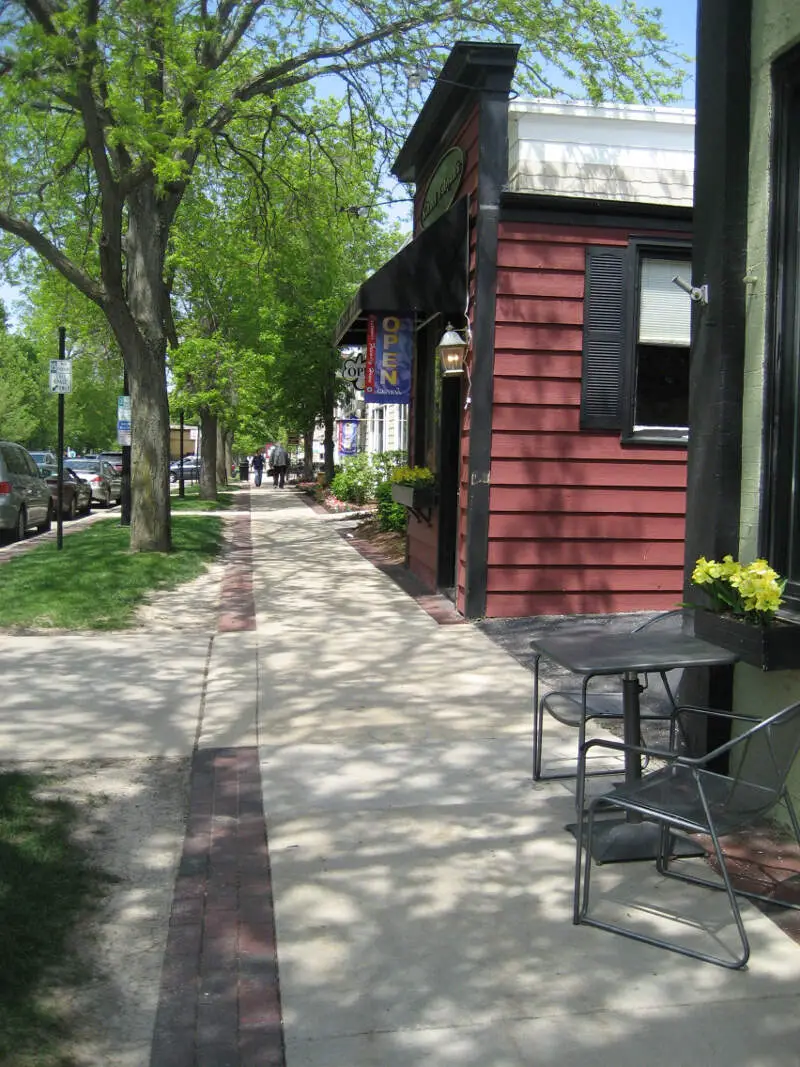
Geneva, IL Photos
Rankings for Geneva in Illinois


Locations Around Geneva
Map Of Geneva, IL
Best Places Around Geneva
Elmhurst, IL
Population 45,538
Clarendon Hills, IL
Population 8,642
Winfield, IL
Population 9,982
Glen Ellyn, IL
Population 28,270
Wheaton, IL
Population 53,453
Bartlett, IL
Population 40,531
Naperville, IL
Population 149,424
Hoffman Estates, IL
Population 51,186
Lisle, IL
Population 23,413
Itasca, IL
Population 9,525
Geneva Demographics And Statistics
Population over time in Geneva
The current population in Geneva is 21,299. The population has decreased -0.7% from 2010.
| Year | Population | % Change |
|---|---|---|
| 2023 | 21,299 | -0.4% |
| 2022 | 21,390 | -0.4% |
| 2021 | 21,472 | -1.7% |
| 2020 | 21,843 | -0.2% |
| 2019 | 21,888 | 0.4% |
| 2018 | 21,799 | 0.0% |
| 2017 | 21,791 | 0.3% |
| 2016 | 21,732 | 0.1% |
| 2015 | 21,704 | 0.2% |
| 2014 | 21,662 | 0.3% |
| 2013 | 21,607 | 0.1% |
| 2012 | 21,588 | 0.2% |
| 2011 | 21,550 | 0.5% |
| 2010 | 21,448 | - |
Race / Ethnicity in Geneva
Geneva is:
82.9% White with 17,653 White residents.
1.5% African American with 323 African American residents.
0.1% American Indian with 21 American Indian residents.
2.4% Asian with 501 Asian residents.
0.0% Hawaiian with 0 Hawaiian residents.
0.1% Other with 21 Other residents.
4.3% Two Or More with 918 Two Or More residents.
8.7% Hispanic with 1,862 Hispanic residents.
| Race | Geneva | IL | USA |
|---|---|---|---|
| White | 82.9% | 58.7% | 58.2% |
| African American | 1.5% | 13.6% | 12.0% |
| American Indian | 0.1% | 0.1% | 0.5% |
| Asian | 2.4% | 5.8% | 5.7% |
| Hawaiian | 0.0% | 0.0% | 0.2% |
| Other | 0.1% | 0.3% | 0.5% |
| Two Or More | 4.3% | 3.0% | 3.9% |
| Hispanic | 8.7% | 18.5% | 19.0% |
Gender in Geneva
Geneva is 53.2% female with 11,322 female residents.
Geneva is 46.8% male with 9,977 male residents.
| Gender | Geneva | IL | USA |
|---|---|---|---|
| Female | 53.2% | 50.6% | 50.5% |
| Male | 46.8% | 49.4% | 49.5% |
Highest level of educational attainment in Geneva for adults over 25
2.0% of adults in Geneva completed < 9th grade.
2.0% of adults in Geneva completed 9-12th grade.
12.0% of adults in Geneva completed high school / ged.
13.0% of adults in Geneva completed some college.
7.0% of adults in Geneva completed associate's degree.
39.0% of adults in Geneva completed bachelor's degree.
18.0% of adults in Geneva completed master's degree.
4.0% of adults in Geneva completed professional degree.
3.0% of adults in Geneva completed doctorate degree.
| Education | Geneva | IL | USA |
|---|---|---|---|
| < 9th Grade | 2.0% | 5.0% | 5.0% |
| 9-12th Grade | 2.0% | 5.0% | 6.0% |
| High School / GED | 12.0% | 25.0% | 26.0% |
| Some College | 13.0% | 20.0% | 19.0% |
| Associate's Degree | 7.0% | 8.0% | 9.0% |
| Bachelor's Degree | 39.0% | 22.0% | 21.0% |
| Master's Degree | 18.0% | 11.0% | 10.0% |
| Professional Degree | 4.0% | 2.0% | 2.0% |
| Doctorate Degree | 3.0% | 2.0% | 2.0% |
Household Income For Geneva, Illinois
2.0% of households in Geneva earn Less than $10,000.
0.6% of households in Geneva earn $10,000 to $14,999.
1.0% of households in Geneva earn $15,000 to $24,999.
3.8% of households in Geneva earn $25,000 to $34,999.
5.3% of households in Geneva earn $35,000 to $49,999.
11.3% of households in Geneva earn $50,000 to $74,999.
10.6% of households in Geneva earn $75,000 to $99,999.
19.6% of households in Geneva earn $100,000 to $149,999.
14.4% of households in Geneva earn $150,000 to $199,999.
31.3% of households in Geneva earn $200,000 or more.
| Income | Geneva | IL | USA |
|---|---|---|---|
| Less than $10,000 | 2.0% | 5.2% | 4.9% |
| $10,000 to $14,999 | 0.6% | 3.4% | 3.6% |
| $15,000 to $24,999 | 1.0% | 6.2% | 6.6% |
| $25,000 to $34,999 | 3.8% | 6.5% | 6.8% |
| $35,000 to $49,999 | 5.3% | 9.9% | 10.4% |
| $50,000 to $74,999 | 11.3% | 15.1% | 15.7% |
| $75,000 to $99,999 | 10.6% | 12.7% | 12.7% |
| $100,000 to $149,999 | 19.6% | 17.9% | 17.4% |
| $150,000 to $199,999 | 14.4% | 9.9% | 9.3% |
| $200,000 or more | 31.3% | 13.1% | 12.6% |


