Pana, IL
Demographics And Statistics
Living In Pana, Illinois Summary
Life in Pana research summary. HomeSnacks has been using Saturday Night Science to research the quality of life in Pana over the past nine years using Census, FBI, Zillow, and other primary data sources. Based on the most recently available data, we found the following about life in Pana:
The population in Pana is 5,277.
The median home value in Pana is $102,779.
The median income in Pana is $45,083.
The cost of living in Pana is 74 which is 0.7x lower than the national average.
The median rent in Pana is $670.
The unemployment rate in Pana is 6.8%.
The poverty rate in Pana is 14.6%.
The average high in Pana is 63.6° and the average low is 43.0°.
Table Of Contents
Pana SnackAbility
Overall SnackAbility
Pana, IL Cost Of Living
Cost of living in Pana summary. We use data on the cost of living to determine how expensive it is to live in Pana. Real estate prices drive most of the variance in cost of living around Illinois. Key points include:
The cost of living in Pana is 74 with 100 being average.
The cost of living in Pana is 0.7x lower than the national average.
The median home value in Pana is $102,779.
The median income in Pana is $45,083.
Pana's Overall Cost Of Living
Lower Than The National Average
Cost Of Living In Pana Comparison Table
| Living Expense | Pana | Illinois | National Average | |
|---|---|---|---|---|
| Overall | 74 | 97 | 100 | |
| Services | 81 | 95 | 100 | |
| Groceries | 96 | 99 | 100 | |
| Health | 83 | 93 | 100 | |
| Housing | 49 | 95 | 100 | |
| Transportation | 92 | 102 | 100 | |
| Utilities | 90 | 91 | 100 | |
Pana, IL Weather
The average high in Pana is 63.6° and the average low is 43.0°.
There are 69.6 days of precipitation each year.
Expect an average of 39.1 inches of precipitation each year with 15.7 inches of snow.
| Stat | Pana |
|---|---|
| Average Annual High | 63.6 |
| Average Annual Low | 43.0 |
| Annual Precipitation Days | 69.6 |
| Average Annual Precipitation | 39.1 |
| Average Annual Snowfall | 15.7 |
Average High
Days of Rain
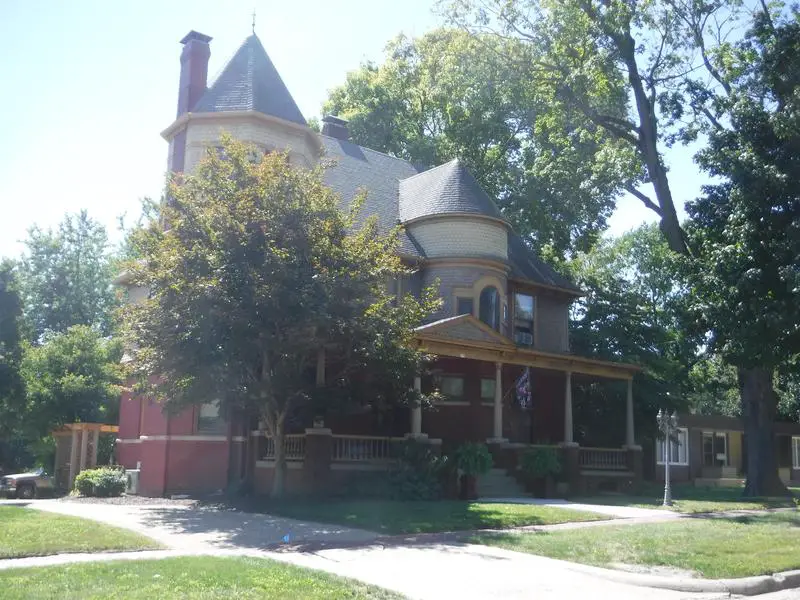
Pana, IL Photos

Rankings for Pana in Illinois


Locations Around Pana
Map Of Pana, IL
Best Places Around Pana
Chatham, IL
Population 14,740
Greenville, IL
Population 7,159
Springfield, IL
Population 113,714
Mount Zion, IL
Population 6,076
Charleston, IL
Population 17,212
Mattoon, IL
Population 16,334
Effingham, IL
Population 12,258
Carlinville, IL
Population 5,574
Hillsboro, IL
Population 5,693
Pana Demographics And Statistics
Population over time in Pana
The current population in Pana is 5,277. The population has decreased -11.9% from 2010.
| Year | Population | % Change |
|---|---|---|
| 2023 | 5,277 | 2.1% |
| 2022 | 5,167 | -2.6% |
| 2021 | 5,304 | -0.6% |
| 2020 | 5,338 | -2.0% |
| 2019 | 5,447 | -0.6% |
| 2018 | 5,478 | -1.7% |
| 2017 | 5,572 | -1.8% |
| 2016 | 5,673 | -0.2% |
| 2015 | 5,684 | 1.5% |
| 2014 | 5,601 | -0.8% |
| 2013 | 5,647 | -3.5% |
| 2012 | 5,850 | -2.0% |
| 2011 | 5,969 | -0.4% |
| 2010 | 5,991 | - |
Race / Ethnicity in Pana
Pana is:
90.4% White with 4,768 White residents.
1.9% African American with 99 African American residents.
0.0% American Indian with 0 American Indian residents.
0.9% Asian with 46 Asian residents.
0.0% Hawaiian with 0 Hawaiian residents.
0.7% Other with 37 Other residents.
1.5% Two Or More with 79 Two Or More residents.
4.7% Hispanic with 248 Hispanic residents.
| Race | Pana | IL | USA |
|---|---|---|---|
| White | 90.4% | 58.7% | 58.2% |
| African American | 1.9% | 13.6% | 12.0% |
| American Indian | 0.0% | 0.1% | 0.5% |
| Asian | 0.9% | 5.8% | 5.7% |
| Hawaiian | 0.0% | 0.0% | 0.2% |
| Other | 0.7% | 0.3% | 0.5% |
| Two Or More | 1.5% | 3.0% | 3.9% |
| Hispanic | 4.7% | 18.5% | 19.0% |
Gender in Pana
Pana is 48.2% female with 2,543 female residents.
Pana is 51.8% male with 2,733 male residents.
| Gender | Pana | IL | USA |
|---|---|---|---|
| Female | 48.2% | 50.6% | 50.5% |
| Male | 51.8% | 49.4% | 49.5% |
Highest level of educational attainment in Pana for adults over 25
5.0% of adults in Pana completed < 9th grade.
7.0% of adults in Pana completed 9-12th grade.
46.0% of adults in Pana completed high school / ged.
17.0% of adults in Pana completed some college.
10.0% of adults in Pana completed associate's degree.
10.0% of adults in Pana completed bachelor's degree.
2.0% of adults in Pana completed master's degree.
1.0% of adults in Pana completed professional degree.
2.0% of adults in Pana completed doctorate degree.
| Education | Pana | IL | USA |
|---|---|---|---|
| < 9th Grade | 5.0% | 5.0% | 5.0% |
| 9-12th Grade | 7.0% | 5.0% | 6.0% |
| High School / GED | 46.0% | 25.0% | 26.0% |
| Some College | 17.0% | 20.0% | 19.0% |
| Associate's Degree | 10.0% | 8.0% | 9.0% |
| Bachelor's Degree | 10.0% | 22.0% | 21.0% |
| Master's Degree | 2.0% | 11.0% | 10.0% |
| Professional Degree | 1.0% | 2.0% | 2.0% |
| Doctorate Degree | 2.0% | 2.0% | 2.0% |
Household Income For Pana, Illinois
6.0% of households in Pana earn Less than $10,000.
9.6% of households in Pana earn $10,000 to $14,999.
13.1% of households in Pana earn $15,000 to $24,999.
11.1% of households in Pana earn $25,000 to $34,999.
12.2% of households in Pana earn $35,000 to $49,999.
18.6% of households in Pana earn $50,000 to $74,999.
11.6% of households in Pana earn $75,000 to $99,999.
11.4% of households in Pana earn $100,000 to $149,999.
4.4% of households in Pana earn $150,000 to $199,999.
2.1% of households in Pana earn $200,000 or more.
| Income | Pana | IL | USA |
|---|---|---|---|
| Less than $10,000 | 6.0% | 5.2% | 4.9% |
| $10,000 to $14,999 | 9.6% | 3.4% | 3.6% |
| $15,000 to $24,999 | 13.1% | 6.2% | 6.6% |
| $25,000 to $34,999 | 11.1% | 6.5% | 6.8% |
| $35,000 to $49,999 | 12.2% | 9.9% | 10.4% |
| $50,000 to $74,999 | 18.6% | 15.1% | 15.7% |
| $75,000 to $99,999 | 11.6% | 12.7% | 12.7% |
| $100,000 to $149,999 | 11.4% | 17.9% | 17.4% |
| $150,000 to $199,999 | 4.4% | 9.9% | 9.3% |
| $200,000 or more | 2.1% | 13.1% | 12.6% |


