Plano, IL
Demographics And Statistics
Living In Plano, Illinois Summary
Life in Plano research summary. HomeSnacks has been using Saturday Night Science to research the quality of life in Plano over the past nine years using Census, FBI, Zillow, and other primary data sources. Based on the most recently available data, we found the following about life in Plano:
The population in Plano is 11,626.
The median home value in Plano is $301,085.
The median income in Plano is $83,102.
The cost of living in Plano is 105 which is 1.1x higher than the national average.
The median rent in Plano is $1,590.
The unemployment rate in Plano is 4.8%.
The poverty rate in Plano is 8.2%.
The average high in Plano is 59.3° and the average low is 39.1°.
Plano SnackAbility
Overall SnackAbility
Plano, IL Crime Report
Crime in Plano summary. We use data from the FBI to determine the crime rates in Plano. Key points include:
There were 83 total crimes in Plano in the last reporting year.
The overall crime rate per 100,000 people in Plano is 641.3 / 100k people.
The violent crime rate per 100,000 people in Plano is 69.5 / 100k people.
The property crime rate per 100,000 people in Plano is 571.8 / 100k people.
Overall, crime in Plano is -69.74% below the national average.
Total Crimes
Below National Average
Crime In Plano Comparison Table
| Statistic | Count Raw |
Plano / 100k People |
Illinois / 100k People |
National / 100k People |
|---|---|---|---|---|
| Total Crimes Per 100K | 83 | 641.3 | 2,004.4 | 2,119.2 |
| Violent Crime | 9 | 69.5 | 289.2 | 359.0 |
| Murder | 1 | 7.7 | 5.8 | 5.0 |
| Robbery | 0 | 0.0 | 90.2 | 61.0 |
| Aggravated Assault | 1 | 7.7 | 146.3 | 256.0 |
| Property Crime | 74 | 571.8 | 1,715.2 | 1,760.0 |
| Burglary | 4 | 30.9 | 290.5 | 229.0 |
| Larceny | 67 | 517.7 | 1,134.4 | 1,272.0 |
| Car Theft | 3 | 23.2 | 290.4 | 259.0 |
Plano, IL Cost Of Living
Cost of living in Plano summary. We use data on the cost of living to determine how expensive it is to live in Plano. Real estate prices drive most of the variance in cost of living around Illinois. Key points include:
The cost of living in Plano is 105 with 100 being average.
The cost of living in Plano is 1.1x higher than the national average.
The median home value in Plano is $301,085.
The median income in Plano is $83,102.
Plano's Overall Cost Of Living
Higher Than The National Average
Cost Of Living In Plano Comparison Table
| Living Expense | Plano | Illinois | National Average | |
|---|---|---|---|---|
| Overall | 105 | 97 | 100 | |
| Services | 107 | 95 | 100 | |
| Groceries | 95 | 99 | 100 | |
| Health | 97 | 93 | 100 | |
| Housing | 110 | 95 | 100 | |
| Transportation | 114 | 102 | 100 | |
| Utilities | 82 | 91 | 100 | |
Plano, IL Weather
The average high in Plano is 59.3° and the average low is 39.1°.
There are 72.3 days of precipitation each year.
Expect an average of 36.4 inches of precipitation each year with 26.4 inches of snow.
| Stat | Plano |
|---|---|
| Average Annual High | 59.3 |
| Average Annual Low | 39.1 |
| Annual Precipitation Days | 72.3 |
| Average Annual Precipitation | 36.4 |
| Average Annual Snowfall | 26.4 |
Average High
Days of Rain
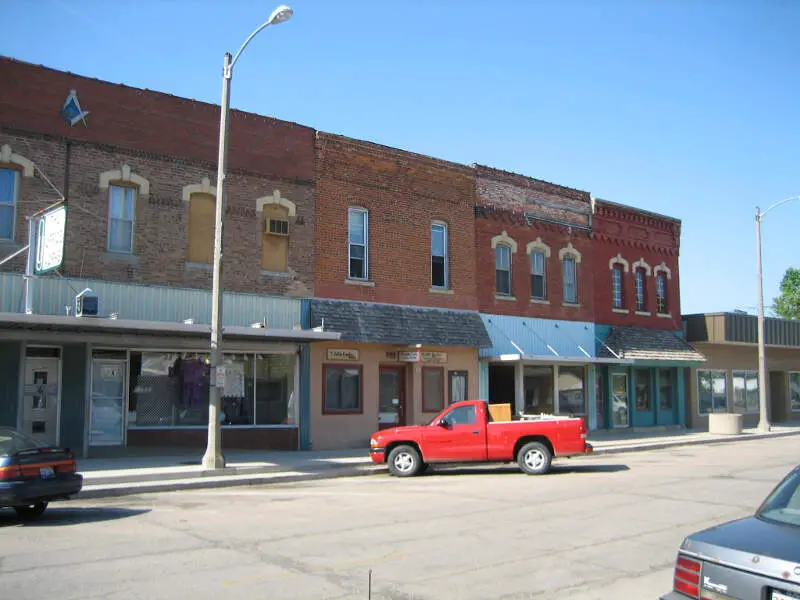
Plano, IL Photos
Plano Articles


Rankings for Plano in Illinois

Locations Around Plano
Map Of Plano, IL
Best Places Around Plano
Naperville, IL
Population 149,424
Geneva, IL
Population 21,299
Batavia, IL
Population 26,730
Plainfield, IL
Population 45,705
Boulder Hill, IL
Population 9,127
Oswego, IL
Population 35,463
Sugar Grove, IL
Population 9,233
Elburn, IL
Population 6,054
Shorewood, IL
Population 18,218
Sandwich, IL
Population 7,121
Plano Demographics And Statistics
Population over time in Plano
The current population in Plano is 11,626. The population has increased 22.7% from 2010.
| Year | Population | % Change |
|---|---|---|
| 2023 | 11,626 | 4.6% |
| 2022 | 11,113 | 2.1% |
| 2021 | 10,885 | -1.6% |
| 2020 | 11,058 | -5.9% |
| 2019 | 11,752 | -0.1% |
| 2018 | 11,766 | -0.8% |
| 2017 | 11,863 | -0.6% |
| 2016 | 11,929 | 0.1% |
| 2015 | 11,920 | 4.8% |
| 2014 | 11,371 | 3.4% |
| 2013 | 10,995 | 3.7% |
| 2012 | 10,602 | 4.1% |
| 2011 | 10,189 | 7.6% |
| 2010 | 9,472 | - |
Race / Ethnicity in Plano
Plano is:
55.7% White with 6,472 White residents.
4.7% African American with 541 African American residents.
0.0% American Indian with 0 American Indian residents.
0.9% Asian with 104 Asian residents.
0.0% Hawaiian with 0 Hawaiian residents.
0.0% Other with 0 Other residents.
1.7% Two Or More with 203 Two Or More residents.
37.0% Hispanic with 4,306 Hispanic residents.
| Race | Plano | IL | USA |
|---|---|---|---|
| White | 55.7% | 58.7% | 58.2% |
| African American | 4.7% | 13.6% | 12.0% |
| American Indian | 0.0% | 0.1% | 0.5% |
| Asian | 0.9% | 5.8% | 5.7% |
| Hawaiian | 0.0% | 0.0% | 0.2% |
| Other | 0.0% | 0.3% | 0.5% |
| Two Or More | 1.7% | 3.0% | 3.9% |
| Hispanic | 37.0% | 18.5% | 19.0% |
Gender in Plano
Plano is 50.9% female with 5,913 female residents.
Plano is 49.1% male with 5,712 male residents.
| Gender | Plano | IL | USA |
|---|---|---|---|
| Female | 50.9% | 50.6% | 50.5% |
| Male | 49.1% | 49.4% | 49.5% |
Highest level of educational attainment in Plano for adults over 25
5.0% of adults in Plano completed < 9th grade.
4.0% of adults in Plano completed 9-12th grade.
27.0% of adults in Plano completed high school / ged.
23.0% of adults in Plano completed some college.
14.0% of adults in Plano completed associate's degree.
22.0% of adults in Plano completed bachelor's degree.
5.0% of adults in Plano completed master's degree.
0.0% of adults in Plano completed professional degree.
0.0% of adults in Plano completed doctorate degree.
| Education | Plano | IL | USA |
|---|---|---|---|
| < 9th Grade | 5.0% | 5.0% | 5.0% |
| 9-12th Grade | 4.0% | 5.0% | 6.0% |
| High School / GED | 27.0% | 25.0% | 26.0% |
| Some College | 23.0% | 20.0% | 19.0% |
| Associate's Degree | 14.0% | 8.0% | 9.0% |
| Bachelor's Degree | 22.0% | 22.0% | 21.0% |
| Master's Degree | 5.0% | 11.0% | 10.0% |
| Professional Degree | 0.0% | 2.0% | 2.0% |
| Doctorate Degree | 0.0% | 2.0% | 2.0% |
Household Income For Plano, Illinois
2.0% of households in Plano earn Less than $10,000.
1.7% of households in Plano earn $10,000 to $14,999.
3.9% of households in Plano earn $15,000 to $24,999.
5.7% of households in Plano earn $25,000 to $34,999.
8.2% of households in Plano earn $35,000 to $49,999.
23.9% of households in Plano earn $50,000 to $74,999.
12.7% of households in Plano earn $75,000 to $99,999.
27.7% of households in Plano earn $100,000 to $149,999.
5.7% of households in Plano earn $150,000 to $199,999.
8.5% of households in Plano earn $200,000 or more.
| Income | Plano | IL | USA |
|---|---|---|---|
| Less than $10,000 | 2.0% | 5.2% | 4.9% |
| $10,000 to $14,999 | 1.7% | 3.4% | 3.6% |
| $15,000 to $24,999 | 3.9% | 6.2% | 6.6% |
| $25,000 to $34,999 | 5.7% | 6.5% | 6.8% |
| $35,000 to $49,999 | 8.2% | 9.9% | 10.4% |
| $50,000 to $74,999 | 23.9% | 15.1% | 15.7% |
| $75,000 to $99,999 | 12.7% | 12.7% | 12.7% |
| $100,000 to $149,999 | 27.7% | 17.9% | 17.4% |
| $150,000 to $199,999 | 5.7% | 9.9% | 9.3% |
| $200,000 or more | 8.5% | 13.1% | 12.6% |


